Norwich Inner Ring Road - Performance Study 2016-2018 - Norwich Bid
←
→
Page content transcription
If your browser does not render page correctly, please read the page content below
Norwich Inner Ring Road
Performance Study 2016-2018
Pitt Street              Charlton Road
                      Barker St
                                                                                                                      Gurney
                                                                                                                       Road

                                                                                   Whitefriars

                                                              Duke                                                     Ketts
                                                              Street                                                    Hill
         Dereham Road

                                        Cleveland
                                          Road

                                           Chapel Field        Market
                                             North             Avenue
                 Convent
                                                                                                                   Thorpe Road
                  Road

                                                                                 Ber
                                                                                Street

                                                                                                                          Carrow
                                                                                                                           Road
                                                                                               King
                                               St Stephens
                                                                                              Street
                                                  Road

                                                                   Finkelgate

                                                                                                                 Bracondale
                    Google Maps

This study looks at the patterns of traffic      two lanes of traffic in each direction for      Ber St provides an important link to the
movement along the Inner Ring Road (IRR)         movement around the IRR.                        inner road network, as well as major car
and notable streets in and out of the city’s                                                     parks. It has undergone significant work
core road network.                               The remaining portion to the east provides      for cycle improvements, road closures and
                                                 one lane in each direction for IRR travel,      reconfiguration of connecting routes.
The IRR is divided into eleven sections, and     with additional lanes for other traffic
measured in both directions. These have          movements (e.g. along Koblenz Avenue for        The Market Avenue loop measures a
been chosen to correspond with the most          car park access).                               common journey from the IRR at Foundry
important junctions of the Ring Road.                                                            Bridge junction, to the centre of the city.
                                                 Southbound between Barker St and                This multi-lane one way system is the
Journey times are also measured outbound         Dereham Rd sees the highest average             subject of many works to prioritise non-car
from Chapelfield North; outbound along           daily traffic, approx. 18,400 vehicles per      use.
Duke Street; both directions along Ber St        day (2017). The northbound Grapes Hill -
between Finkelgate and Golden Ball St            between Convent Rd and Dereham Rd - is          Chapel Field North provides egress for
(where All Saints St formerly joined); an        second with 15,400 (2017).                      workers and residents in the south-west
inbound route from the Foundry Bridge to                                                         area of the city.
Market Avenue, just after the Castle Mall        With one lane of through traffic, the
car park; and a return route from this point     eastbound section between Charlton              Duke Street is a northerly egress route
to the Foundry Bridge junction.                  Rd and Gurney Rd carries the highest            made more important by the progressive
                                                 proportion of traffic, at 13,000 vehicles per   closure of other roads in this area. It
The IRR has a speed limit of 30 mph              day (2017).                                     notably serves St Andrews - the largest
throughout.                                      Other sections of the road network have         capacity car park in the city centre.
                                                 also been analysed for their importance
The western portion of the IRR, between          with access to & from Norwich City Centre.
Finkelgate and Whitefriars provides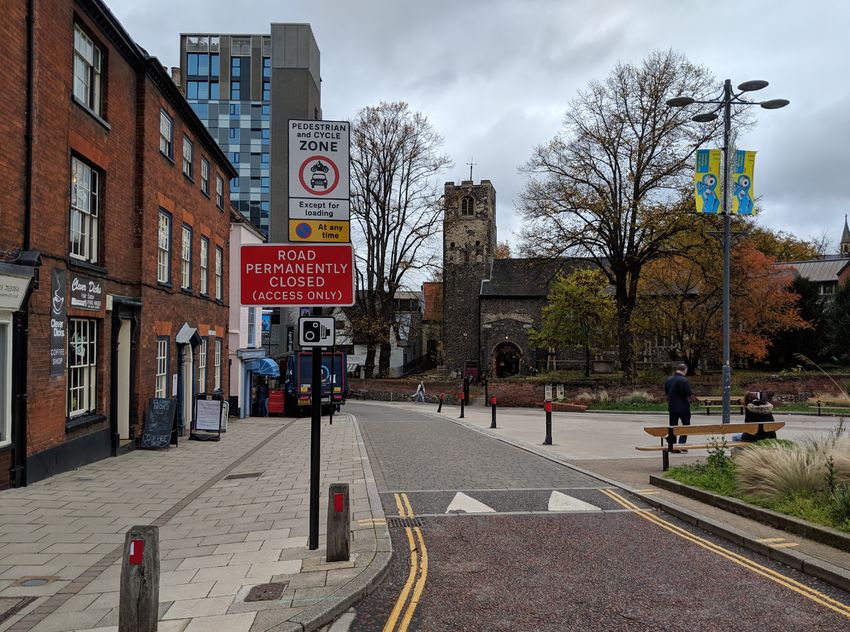
Methodology
Since 2016, Noggin and Norwich BID have        Aggregation                                      flow speed as acceptable. This is based on
been collecting estimated journey times                                                         the strategic road network and does not
along key stretches of Norwich’s roads,        Where baseline road performance is               necessarily apply to local roads.
including the Inner Ring Road (IRR) and        required for comparison, the previous 8          - For our purposes, acceptability is
various inner city streets.                    weeks’ data is collected and averaged on a       measured at three points (where free-flow
                                               mean basis. Only data from the same day          is given as journey time):
The purpose of this collection has been        of the week is included for comparison.          exceeding 150% of free-flow time;
to independently analyse the conditions                                                         exceeding 200%, and exceeding 300%.
of these roads, and see how they have          For free-flow conditions, the minimum            These figures provide a reasonable
changed over several months and years, as      journey time is taken from each day’s core       summary of the disturbances and
Norwich City Council and other authorities     hours. Again, this is aggregated using the       congestions observed on Norwich’s roads,
continue to evolve the road network.           mean minimum value for the previous 8            and give us a basis upon which to analyse
                                               weeks. This is intended to give a driver’s       trends.
Journey times have been collected from         perspective on typical clear conditions,
Google Maps. This was chosen as (at            particularly where it may take some time         Date & Time
the time of launch) the Maps service           for roads to recover from changes.
provided a free traffic estimation tool with                                                    This document follows the ISO standard
substantial coverage, collected from a wide    For summary statistical purposes (such           for Week Numbering. This is the week
variety of sources.                            as comments on how a section of road             numbering system typically used in diaries
                                               has performed by day), the median                and Microsoft Office.
The quality of data by this supplier is        journey time is typically taken. This
compared with the Council’s own data           provides a balance between normal and            Quarterly aggregation follows calendar
collection, which can be found within.         extraordinary conditions.                        months, i.e. Q1=Jan-Mar; Q2=Apr-Jun,
                                                                                                Q3=Jul-Sep; Q4=Oct-Dec.
Core hours                                     Where acceptability has been measured
                                               (the performance of a section of road            Times quoted are in local time,
An estimated journey time for each road        against freefflow conditions) each sample        incorporating daylight savings time where
segment was requested from Google Maps.        is compared against the free-flow (as            necessary.
At core hours (0700-2000 daily) this was       described above). Where the sample
retrieved every 15 minutes. Outside these      journey time exceeds 150% of free-flow,          Assessment
times, data was collected hourly.              it is amber; times in excess of 200% are
                                               red, and times over 300% of free-flow are        It should be noted that Noggin is a town
For each journey, the start and end points     black. This is calculated on a daily basis and   centre data analysis company and does
are configured to be as close to the           aggregates (such as the quarterly charts         not provide highways engineering advice.
adjacent junction as reasonably possible.      shown in this document) are based on the         Our analysis of the data and likely causes is
Thus, for roundabouts this would be            mean average percentages for that quarter.       based on observed trends and events only.
the exit and entry arms respectively. For
other junctions this would be the points       Measurement
immediately after or before the junction
itself.                                        Both free-flow and acceptability are based
                                               on Highways England specifications for
In some cases, the stretch of road             measurement of road performance.
concerned may traverse multiple junctions.
For instance, the section between              Highways England’s performance indicator
Finkelgate and the IRR includes a major        is based on motorway and trunk road
signalised junction at Charing Cross. The      journey time, which is not suitable for the
journey time may be significantly affected     shorter sections of the IRR.
by this junction, however for historical
consistency the route remains in place.        Therefore the following modifications
                                               were made:
Collection Reliability                         - In the Highways England manual, free-
                                               flow speed is based on the 85th percentile
The data source has proven reliable            of car speeds for a given link, capped at the
throughout, with high availability.            posted speed limit.
                                               - For our purposes, we must assume that
The only notable period of downtime was        Google has already performed some form
during Week 48 (week of 27 November)           of analysis to determine the typical road
2017 where a server issue prevented the        speed at free-flow, so these modifications
collection of data for five days. For the      are not necessary (nor are they possible
                                                                                                Highways England Operational Metrics Manual:
purposes of this report, the data has been     given the data set provided).                    https://assets.publishing.service.gov.uk/government/
infilled using averages of the previous and    - For acceptability, Highways England            u p l o a d s / s y s te m / u p l o a d s / a t t a c hm e n t_d a t a /
subsequent weeks.                              counts any journey above 3/4 of the free-        file/721108/Operational_Metrics_Manual.pdf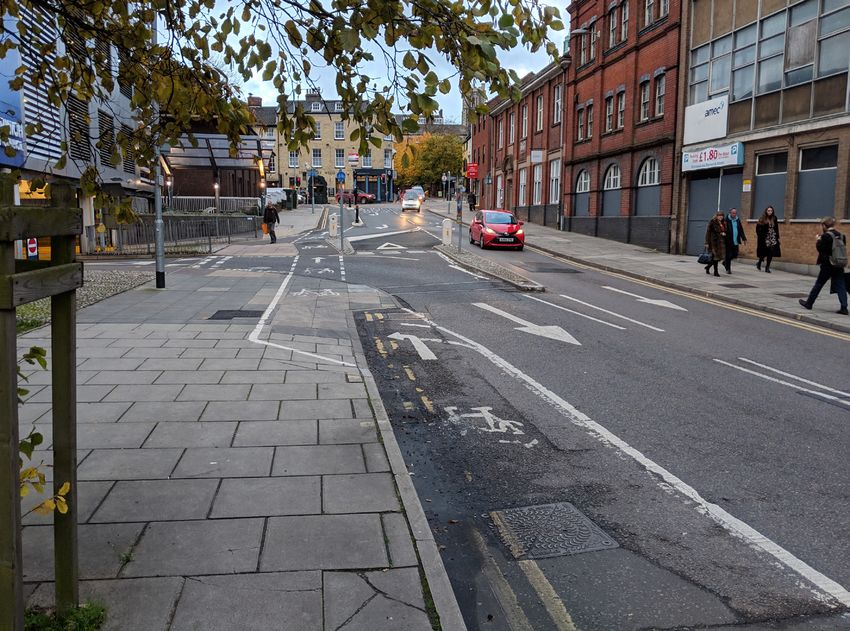
Google Maps as a Data Source
Google Maps provides estimates of driver                 these are from forecasts, actual results or a   In recent months Google has applied a new
journey times for routes between any two                 combination of the two.                         pricing policy which increases the cost of
arbitrary points on the UK road network.                                                                 acquisition for this data.
                                                         Where actual results have been taken, it
The methods used by Google are opaque;                   is again unclear how many samples are           Simultaneously, a number of other sources
we have no way of understanding exactly                  needed for Google to accept the data as         have emerged as potential replacements,
how these journey times are arrived at,                  representative. For instance, a moped user      offering a similar set of data.
nor do we know what influences their                     could have vastly different journey times to
estimations.                                             a car user.                                     Whilst we have not yet researched these
                                                                                                         sources in detail, it would be doubly
We ought to have a reasonable degree of                  Typically, councils use a combination of        interesting to see if they provide an
trust in Google that - as a competitive edge             manual counts, loops and ANPR systems           adequate alternative source, and whether
- they will be striving to provide the most              to collect their data. This data is used as     their results coincide with Google’s own
accurate journey time data.                              a basis for forecast models and review.         data or differ.
                                                         Therefore for Google Maps to succeed as
Nonetheless it is prudent to compare this                an alternative or complementary source          Where a road is temporarily closed (such
data with other known and controlled                     of data, we must first assess it against        as for works on Carrow Road Bridge) it
sources.                                                 existing sources.                               appears that Google continues to provide
                                                                                                         estimated journey times, but with higher
As with many online traffic sources,                     An extra note of caution is observed around     estimates. We typically see times of 10
Google accumulates its traffic data from                 the long-term free-flow performance. It is      minutes or more for a section of road that
millions of mobile phone users. As the                   feasible that Google’s implementation of        might typically take 40 seconds.
user (and their phone) goes about their                  their traffic estimates has been changed
daily travels, the travel time is recorded by            over time, and may have given a positive or     Behind the scenes, it is likely that Google
Google. These are then used in aggregate                 negative skew when viewed long-term.            is simply using this as a way to urge its
to determine the journey times across each                                                               route planner to find a diversion. For our
section of road.                                         In our figures we see changes of a few          purposes we must find a way to identify
                                                         seconds - significant for us but perhaps        these and mark them accordingly. This has
Google & other providers do make or have                 not for general journey time estimation.        not yet been resolved.
made use of fleet GPS, highways agency                   Whilst we have seen a general reduction in
surveys, loop systems and Satnav devices.                journey time (with some exceptions) this        Similarly, since Google Maps is finding
The extent of Google’s coverage in this                  may also be a result of systematic long-        the best route for a section of road, it is
regard is unknown.                                       term bias in the algorithms used by Google.     possible that it may find diversions away
                                                         Without identification and verification         from IRR that offer better times. These
Furthermore, it is unclear how the journey               from other sources, this remains an open        have not been tracked, but are certainly
time figures have been reached - whether                 risk factor.                                    worth consideration.

Right: Google Maps has been used to monitor the
effects of road changes, such as the pedestrianisation
of Westlegate and All Saints Green, on the Inner Ring
Road and key access points.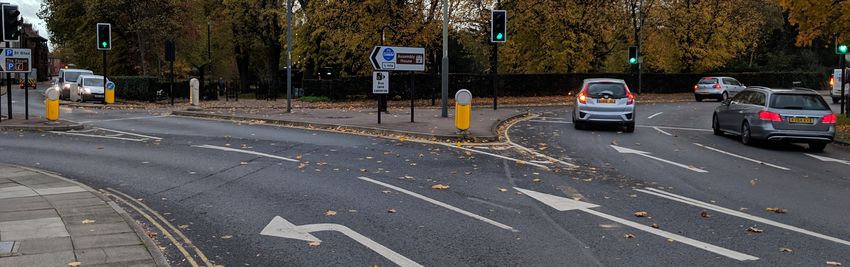
Supplemental Data
Norwich City Council has provided a                of volume (transit time is an unreliable              possible causes for this. For instance, the
number of additional data sources from             proxy).                                               ANPR points are some length along the
their various data collection projects, such                                                             carriageway from the junctions - about
as ANPR (origin-destination) and manual            However, ANPR gives a means to                        120m shorter than the Google equivalent.
counts at key intersections along the Inner        determine actual transit time between two
Ring Road.                                         surveyed points, and a small number of                With busy traffic lights at one end and a
                                                   survey locations between the council ANPR             roundabout at the other, the ANPR data is
ANPR records number plates of passing              project and the Google Maps data allow for            unlikely to detect the variability of these
vehicles. This allows the origin, destination      comparison.                                           factors (likely an intentional measure).
and route of vehicles to be determined, as
well as their journey time between any two         Where the two datasets are compared,                  This can perhaps be seen by the ranges of
points. The number plates themselves are           there is a broad agreement between                    times indicated: Google Maps estimates
removed; only the journey data is kept.            the two. A dip in afternoon journey time              between 2min and 2m30; ANPR typically
                                                   on Google Maps between approx 1415                    shows times below 1m30.
Traffic counts are difficult to relate             and 1630 is reflected in the ANPR data,
directly to Google Maps data, as we are            however the precise peaks and troughs do              Furthermore, we do not know the exact
not provided by the latter with any kind           not match very well at all. There are several         specification of Google’s system, which is
                                                            Left: ANPR data for 20 May 2017,
                                                                                                         likely to incorporate lag, estimation and
                                                            southbound      between      Kett’s   Hill   inaccuracies.
                                                            roundabout and Foundry Bridge junction.
                                                            Dotted line shows moving average.            We do not know Google’s sample size, and
                                                            Below: Google Maps data for the same day.
                                                                                                         the ANPR data yields 143 results for this
                                                                                                         particular stretch of road (of approx. 6000
                                                                                                         vehicles; so a collection rate of 2-3%).

                                                                                                         Given the variability observed in the
                                                                                                         data, and the small sample sizes, it is
                                                                                                         difficult to judge precisely how aligned
                                                                                                         the two datasets are other than the broad
                                                                                                         agreement for the afternoon dip in journey
                                                                                                         times.

General Performance

The transit time around Norwich’s Inner            Thursdays and Fridays are busier                      in High Street footfall. If traffic is heavily
Ring Road has declined slightly since 2016,        than usual on the Inner Ring Road in                  influenced by the shopping period - as we
where Quarter 4 (the first period of data          Q4 - particularly in 2017. Again likely               might already expect from previous years’
collection) was significantly above later          symptomatic of evening and Christmas                  performances - a retail decline might also
months.                                            encouraging shopper to the area.                      lead to a drop in congestion.
                                                                                                         The latter point may have particular merit:
2018 in general was better performing than         This weakened in 2018, with Q4 figures                apart from Week 51 (the week before
in 2017, although Q2 was exceptionally             barely above Q3 and Q2. This appears to               Christmas Day) 2018 was lower than
busier than usual - most likely with delays        be from a combination of effects. First,              previous years along the clockwise route,
on Grapes Hill and around Pitt Street.             traffic figures for mid-September through             with comparable figures to 2017 on the
                                                   October 2018 were particularly low. This              anti-clockwise route.
The fourth quarter of each year - October          offset any issues in November & December,
through December - is typically the busiest        bringing down the quarterly average.                  While most sections have seen an
period, with approaches to the Intu                                                                      improvement in free-flow journey times, a
Chapelfield shopping centre showing the            Second, national retail performance                   few areas increased slightly.
largest delays.                                    was weak in 2018, with commentators
                                                   remarking on the particularly sharp decline           Between Barker St and Dereham Rd,
                                                                                                         anti-clockwise, there has been a marginal
                                                                                                         increase in journey time - although to put
                                                                                                         this in context, free-flow journey time has
                                                                                                         risen from 43 to 45 seconds over 9 quarters.

                                                                                                         Chapelfield North has seen a slight
                                                                                                         increase in free-flow time again, although
                                                                                                         (as is referred later) this may well be
Left: General performance of Inner Ring Road per                Clockwise
                                                                                                         adjustments made to the benefit of other
quarter.                                                        Anti-Clockwise                           arms of the Convent Road roundabout.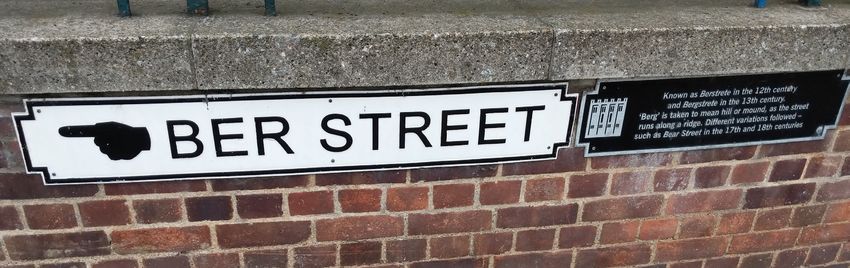
Free-Flow
Free-flow is measured as the average Free-flow is not affected by short-term
minimum time for drivers to travel a issues, such as temporary road closures and
section of road under core hours, that is incidents, since these rarely extend for the
0700-2000 daily. entirety of the day.
In these graphs, free-flow is measured For analysis purposes, the daily free-flow
across all seven days. speed has been aggregated on a quarterly
basis, using a mean average. This is
Free-flow is a good indicator of how the intended to give a fair representation of
road performs under ordinary conditions. the road conditions, including adjustments
By looking at the minimum journey time, for any temporary works or disruptions.
we can then compare this ideal time
against more congested periods, to see Many of the road sections have shown a
how much variance there is. decrease in free-flow transit time over the
last ten quarters.
Free-flow can change through a variety
of factors, such as traffic light retiming, Clockwise free-flow time has been
removal of obstacles and street furniture, improved in a number of areas: particularly
or improvements in road layout and between Ketts Hill and Convent Road (the
capacity. southerly portion of the Inner Ring Road).
It can also change if the posted speed limit Slowdowns are observed on the section
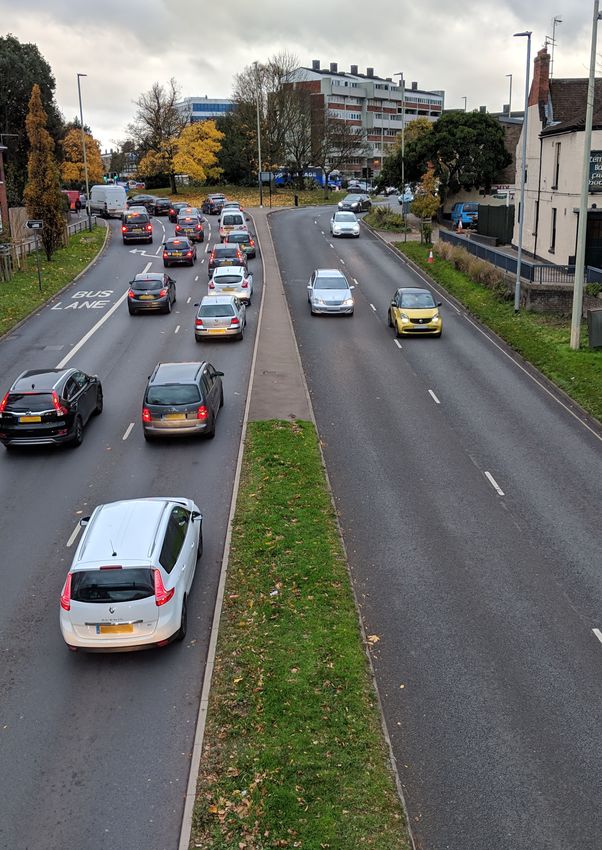
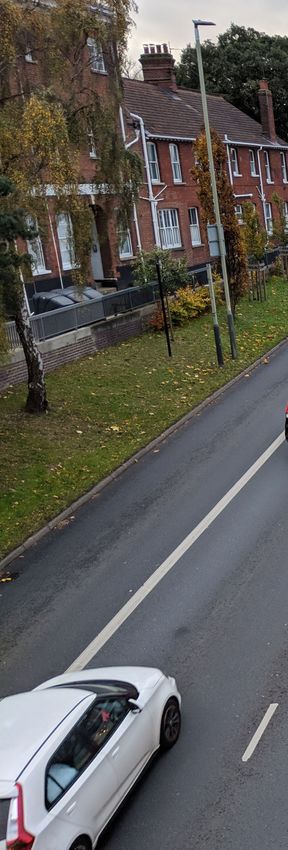
Below: Duke St has seen a number of transformations is also changed, although throughout the between King St and Carrow Road in both
to improve speed compliance, access to & from car
period we understand the IRR was subject directions, in the third quarter of 2018.
parks, and a contraflow cycle scheme.
to a blanket 30mph restriction. This eight-week slowdown beginning 30th
July appears to coincide with the repair
programme of the bridge - although video
taken in early September shows no sign of
disruption and traffic remains reasonable
throughout.
The egress route from Pottergate along
Duke Street has seen a rise in journey time,
peaking in mid-2018. Works in late 2016
were undertaken to install traffic cushions
and contraflow cycle paths, but journey
times continued to rise. As of late 2018
times have relaxed slightly.
Below and Right: Free-flow journey times across each
section of road, measured daily and averaged across
each quarter. The columns show the expected free-
flow journey time in seconds.
Above: Chapelfield North (outbound) Above: Thorpe Rd to Market Ave (inbound)Below: Above: Ber St, Finkelgate to Golden Ball St (in)
Below: Pottergate to Duke St (outbound) Market Ave to Thorpe Rd (outbound) Below: Ber St, Golden Ball St to Finkelgate (out)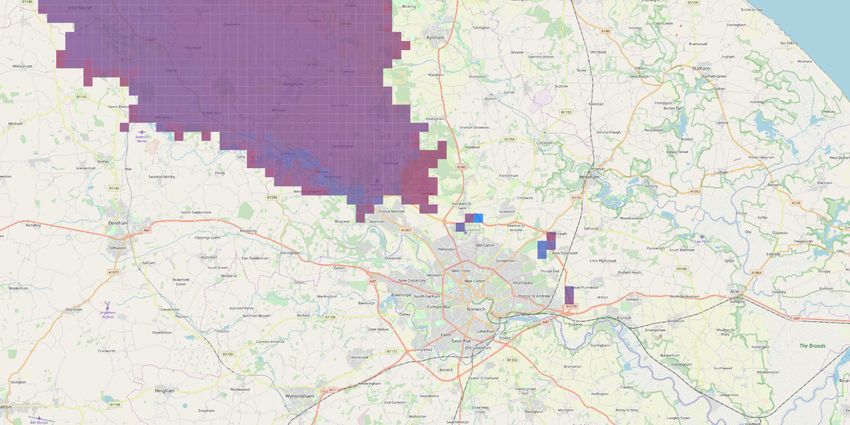
OUT OF CITY                       CLOCKWISE   ANTI-CLOCKWISE             CITY CENTRE

                         Barker Street

                                                    St Swithins Rd
                Dereham Road      A1074
                                                    St Benedicts Rd

                                              Cleveland Rd
                 Convent Road B1108
                                              Chapel Field North

              St Stephens Road      A11             St Stephens Street

                   Bracondale      A147

                                              King St

                  Carrow Road     A1242

                  Thorpe Road     A1242       Prince of Wales Road

                     Ketts
                         ’ Hill   B1140

                          Gurney Road

                 Charlton Road     A1151      Whitefriars

                            Pitt Street             Duke Street

OUT OF CITY                       CLOCKWISE   ANTI-CLOCKWISE             CITY CENTRE
Weekday Journey Time Acceptability

                                                      The Acceptability measure is based on           The issues in this section appear to arise
                                                      Highways England’s preferred measure            from the Convent Rd roundabout. Here, we
                                                      of road performance, which looks at how         see similar traffic issues on all approaches,
                                                      quickly a driver can travel a length of road    including Chapelfield North (shown below
                                                      versus its typical free-flow condition.         left), where performance appears to have
                                                                                                      deteriorated in the most recent months.
                                                      Highways England typically use this
                                                      measure on long sections of road, such          The clockwise section between St Stephens
                                                      as motorways, where only a small degree         Road and Convent Road roundabout
                                                      of change can be regarded as poor               appears to be heavily seasonally affected,
                                                      performance.                                    with a notable decline in Q4 of each year.
                                                                                                      More detailed analysis confirms this
                                                      For our purposes, the threshold is much         downward trend begins mid-September
                                                      higher. Journey times 150% of free-flow or      before reaching its lowest point
                                                      lower are considered ‘green’, with longer       immediately before Christmas.
                                                      journey times scaled accordingly (the table
                                                      is shown to the left).                          Given the proximity of Intu Chapelfield
                                                                                                      shopping centre, it would appear that
                                                      Further comments on this measurement            retail traffic heavily affects this section of
                                                      are provided in the remarks in later pages.     road.

                                                      The first set of results on these pages         A particularly striking drop in performance
                                                      show Acceptability for weekdays only,           can be seen on the approaches to Pitt St/
                                                      aggregated by quarter.                          Duke St roundabout, with a substantial
                                                                                                      decline in performance in Q2 and Q3 2018.
                                                      Many of the roads show mostly green bars,
                                                      including some in areas that handle a large     On both approaches the decline appears
                                                      amount of traffic.                              to begin the week of 2 April 2018, with
                                                                                                      the worst congestion ending by 27 August
                                                      The sections approaching Whitefriars            2018.
                                                      roundabout appear to perform consistently
                                                      well, despite the relatively high volumes of    This appears to coincide with a package of
                                                      traffic passing through this area.              works to replace the subway under the IRR
                                                                                                      with a pedestrian crossing a short distance
                                                      Grapes Hill - often a pinch point for traffic   east of the Pitt St/Duke St roundabout.
                                                      - seems to perform well northbound
                                                      between Convent Road and Dereham Road           These works also included the widening of
                                                      junctions, with improvements particularly       the central reservation between the two
                                                      after early 2017. This is a long, straight      carriageways and other highways works
                                                      section with two lanes widening to four at      likely to disrupt traffic.
                                                      the Dereham Road junction.

                                                      Meanwhile southbound on the same
                                                      section appears to struggle, with many
                                                      periods showing significant delays. The
                                                      free-flow for this road (2018 Q4) is approx
Below and right: Weekday Journey Time Acceptability   36 seconds, whereas 25% of the time this is
GREEN = Journey time within 150% of free flow.
                                                      108 seconds or greater.
AMBER = between 150% and 200%
RED = 200% to 300%
BLACK = 300% and over.

Above: Chapelfield North (outbound)                   Above: Thorpe Rd to Market Ave (inbound)        Above: Ber St, Finkelgate to Golden Ball St (in)
Below: Pottergate to Duke St (outbound)               Below: Market Ave to Thorpe Rd (outbound)       Below: Ber St, Golden Ball St to Finkelgate (out)
OUT OF CITY                       CLOCKWISE   ANTI-CLOCKWISE             CITY CENTRE

                         Barker Street

                                                    St Swithins Rd
                Dereham Road      A1074
                                                    St Benedicts Rd

                                              Cleveland Rd
                 Convent Road B1108
                                              Chapel Field North

              St Stephens Road      A11             St Stephens Street

                   Bracondale      A147

                                              King St

                  Carrow Road     A1242

                  Thorpe Road     A1242       Prince of Wales Road

                     Ketts
                         ’ Hill   B1140

                          Gurney Road

                 Charlton Road     A1151      Whitefriars

                            Pitt Street             Duke Street

OUT OF CITY                       CLOCKWISE   ANTI-CLOCKWISE             CITY CENTRE
Weekend Journey Time Acceptability
Weekends naturally shift focus away from At weekends, Chapelfield North forms one not as much as on weekdays.
commuter traffic to leisure, retail and of the key routes out of the city centre for
domestic. businesses, shoppers and residents near The anti-clockwise route between
the Intu development (although Intu car Bracondale and Carrow Road is showing
This can pose its own set of issues, as park itself has a separate exit to the IRR). signs of congestion, with ‘black’
the Inner Ring Road and surrounding acceptability scores emerging where they
routes are used in a different way, and Given the relatively small area of coverage did not show on weekdays.
improvements to benefit the commuter for this road, and that neighbouring
may not be as positive for the shopper. Cleveland Road (itself recently converted More detailed analysis shows that the
to two-way running) provides additional proportion of reds and blacks are fairly
This is evident on Chapelfield North, where egress for more northerly vehicles, it may consistent throughout the surveyed period,
the outbound route leads onto the busy be that the delays are strategic in favour of particularly during Carrow Rd Bridge
Convent Road roundabout. This road’s other roundabout arms. repairs, but it appears there are fewer
capacity was reduced a number of years amber periods - and a higher proportion of
ago (before the survey period) from a one- On the IRR itself, we see delays green ‘acceptable’ journey times
way two-lane street into two-way running, approaching this roundabout from both
and it leads onto a three stage signalised major directions, as we did on weekdays. This suggests that improvements have
junction immediately before the busy been found along this stretch of the IRR for
roundabout. Grapes Hill from Dereham Road to general traffic flow, but more serious jams
Convent Road roundabout is typically busy, remain unresolved.
although a larger ‘green’ period informs
us that the delays are not as often as on The performance around the Whitefriars
weekdays. roundabout remains consistently free-
Below: Convent Road roundabout includes a three flowing with near 100% green ‘acceptable’
stage traffic light junction allowing traffic from
Chapelfield North and Cleveland Road to enter the Similarly St Stephens Rd to Convent Rd results, as it does during weekdays. Long
roundabout, as well as access to Chapelfield North. roundabout shows some congestion, but delays appear to be quite rare.
Before 2014 both roads were one way, with Cleveland
Road taking traffic into the city centre system and
Chapelfield North back out again.
Below and right, acceptability on weekends.
GREEN = Journey time within 150% of free flow.
AMBER = between 150% and 200%
RED = 200% to 300%
BLACK = 300% and over.
Above: Chapelfield North (outbound) Above: Thorpe Rd to Market Ave (inbound)Below: Above: Ber St, Finkelgate to Golden Ball St (in)
Below: Pottergate to Duke St (outbound) Market Ave to Thorpe Rd (outbound) Below: Ber St, Golden Ball St to Finkelgate (out)OUT OF CITY CLOCKWISE ANTI-CLOCKWISE CITY CENTRE
Barker Street
St Swithins Rd
Dereham Road A1074
St Benedicts Rd
Cleveland Rd
Convent Road B1108
Chapel Field North
St Stephens Road A11 St Stephens Street
Bracondale A147
King St
Carrow Road A1242
Thorpe Road A1242 Prince of Wales Road
Ketts
’ Hill B1140
Gurney Road
Charlton Road A1151 Whitefriars
Pitt Street Duke Street
OUT OF CITY CLOCKWISE ANTI-CLOCKWISE CITY CENTRENorthern Distributor Road/Broadland Northway
The Northern Distributor Road (NDR) - also July 2017: Hold Rd/Reepham Rd open. will affect the performance of surrounding
known as the Broadland Northway - is a Nov 2017: Fakenham Rd, Cromer Rd open. roads.
newly constructed road providing an access Dec 2017: Wroxham Rd open.
and bypass route for traffic travelling along Apr 2018: remainder to Postwick open. Given the geography of Norwich, the
the northern part of the city. purpose of the NDR, and the presence of
There is little evidence to directly link any various mobility schemes, it is possible that
The NDR (20km in length) is a dual reduced congestion on the IRR with the the Outer Ring Road has benefitted more
carriageway all-purpose road, with at- opening of the NDR. than the Inner; we simply don’t hold the
grade and grade-separated junctions at figures to evidence this.
many points along the route, connecting to Whilst the IRR has enjoyed improved
the various roads that emerge from the city performance, particularly through 2017 Nonetheless, any road that allows users to
centre & towards the Broads. and 2018, this may well as be an outcome select the most efficient ingress/egress for
of general works as it is with the NDR Norwich is welcome, and likely to have a
At the eastern end of the NDR, it joins opening. net positive effect on general traffic at key
with the A47 for onward access to Great intersections, particularly to the north of
Yarmouth, the Southern bypass, and the That is not to say that the NDR has had no the city.
Postwick Park & Ride scheme. effect. Clearly, any new road in the area
It was opened for public use in stages,
between November 2017 and April 2018:
Reepham
Right: Purple areas show the residents whose route to
the centre of Norwich (given by the ITV Anglia office)
would be improved by following the NDR (shown here
in blue). Typically, the NDR opens up options via Holt
Rd and Reepham Rd.
This graph does not estimate traffic, so impacts of Norwich
rush hour, redistribution (because of NDR) and other
factors are not considered here, nor are benefits
drawn from removing East-West bypass traffic from
Fakenham Road.
Events Around the City
Lord Mayor’s Celebration “Beast from the East” Road Incidents
Parade: Sat 8 Jul 2017, Sat 7 Jul 2018 Widespread snow in late February and Incidents and temporary closures on the
With much of the City Centre closed for the early March 2018 brought significant travel IRR give us an indication of how well it
2017 parade (1700 onwards), our monitored issues to the area. copes with disruption.
roads are predictably affected. Google
Maps shows Duke St and Market Avenue On Tue 27 Feb 2018 snow arrived in the Following a collision on Fri 16 Dec 2016, the
area as closed from 1500 onwards. county, bringing school closures and area around Intu Chapelfield was partially
Just before the parade, we see slowdowns limited train services. closed. This is visible in the data as a large
clockwise between Whitefriars and Thorpe increase in journey time on Grapes Hill
Road, and anticlockwide from Braconsdale It appears that - in many places - drivers (southbound) - up to 5 times usual.
towards King St - perhaps visitors trying to stayed at home. Traffic across the IRR was
find parking before the event. reasonably smooth flowing throughout the The effects of events such as these can
day, however the appears to have been a create ‘shockwaves’ around the ring road.
The 2018 parade shows road closures slow-down across the road network around As far back as Whitefriars and Duke St,
earlier from Prince of Wales Road into the 2100, which appears to coincide with a journey time also jumped similar amounts
centre and delays are less pronounced. heavier spell of snow. for about an hour. Despite this, there is
Indeed, along the north and west many little to suggest drivers found alternative
sections of the IRR are quicker than usual. The following day (28 Feb) shows tricky routes to their destinations; clockwise
Perhaps locals know to avoid the IRR on conditions on the roads, with average was largely unaffected except for in the
this day. journey times far longer than usual. immediate vicinity of Intu Chapelfield.
https://www.bbc.co.uk/news/live/uk-
It should be noted that the 2018 event was From Thu 1 Mar, the weather warmed up england-43167994/page/12
on the same day as an England World Cup but it appears that many stayed away;
https://www.bbc.co.uk/news/av/uk-england-
game against Sweden. roads did not recover until the following norfolk-38342127/norwich-crash-causes-traffic-chaos-
week. for-christmas-shoppersSummary of Roadworks
Finkelgate Improvements Carrow Road Bridge St Crispins Road Subway Replacement
Between 2016 and 2017, a number of Carrow Road bridge is a lifting bridge over An underpass at St Crispins Road took
improvements were made to Finkelgate the River Wensum, near Norwich City FC pedestrians under the IRR, where it crosses
between Ber Street and the Inner Ring football stadium. It carries the A147 (part of Magdalen Street. This was filled in 2018
Road. This included widening of the the Inner Ring Road). and replaced with a pedestrian crossing.at
junction with the Inner Ring Road, and a On the 21st June 2018, the bridge the Botolph St off-slip.
switch to a mini-roundabout at Ber Street. underwent a test opening in preparation - Work began April 2018
for the movement of the TS Lord Nelson - Subway infilled June 2018
- Closure of Finkelgate northbound later in the week. The bridge was opened - Works completed August 2018
from Queen St (IRR). Left turn only from again (approx. 0740) on 24th June to allow
Finkelgate to Queen St. the boat to pass. Other Works
- Installation of traffic lights & revised Chapelfield Road (A147) – lane closure at
layout at Finkelgate/Queen St junction. - A yellow board warned of ‘long delays pedestrian crossing for patching work [July
- Installation of mini-roundabout at peak PM’ at the bridge on 15th & 16th June 15-19, 2016]
Finkelgate/Ber St junction. 2017 Ketts Hill sewer collapse; road closed entire
- Removal of all temporary closures and - Bridge test opening in preparation for length [12-15 Oct 2018]
movement restrictions. [Oct 2016] passing of TS Lord Nelson [21 June 2018] Source: [12]
Sources: [1] [2] - Bridge opened for passing of TS Lord
Nelson [0740, 24 June 2018] Ketts Hill Water closure [3-5 Sep 2018]
All Saints, Golden Ball and Ber St Junction - Closed for urgent repairs [1900-0700, 27 Source: [13]
Multiple changes were made at this July – 30 July 2018]
junction and surrounding roads. Before the - Closed for further repairs [1900, 8 Sep
survey period, the junction was updated 2018 – 0700, 9 Sep 2018]
from a traffic light intersection to a mini- Sources: [6] [7] [8] [9]
roundabout, with Golden Ball St converted
from one-way running to two-way. Brazen Gate
Following the closure of All Saints St, Brazen Gate is a stretch of road from Queen
Westlegate was also converted to a Street (IRR) for a few hundred metres
pedestrianised street. to service a small residential estate, a
Sainsburys, and provide access to Grove
- Conversion of Golden Ball St to two-way Road.
running; junction with All Saints St & Ber Brazen Gate follows a portion of the former
St converted from signalised to mini- railway line to Norwich Victoria Station
roundabout [Mar 2016] (now occupied by Victoria House). The
- Closure of All Saints St & Westlegate [Jan remainder of the course is a shared foot
2017]. and cycle way leading out of the city.
- Removal of mini-roundabout; installation The link between Grove Road and Brazen
of pedestrian crossing. [Q1 2017] Gate is restricted to buses only towards
- Closure of Thorn Lane at junction with Ber Brazen Gate, Mon-Fri 0730-0930
St. [July 2016] - Modifications to junction with Queens
- Improved access to John Lewis car park. Road. [Jan-Apr 2018]
Sources: [3] [4] [5] Source: [10]
[1] https://www.eveningnews24.co.uk/motoring/two-norwich-streets-re-open-after-roadworks-1-4724579
[2] https://cmis.norwich.gov.uk/Live/Document.ashx?czJKcaeAi5tUFL1DTL2UE4zNRBcoShgo=RIYIwpTIZvEwL7OUlCntrMsHPzhWl%2F9LiR6xsiaQhlcvnWsecPAhpw%3D%
3D&rUzwRPf%2BZ3zd4E7Ikn8Lyw%3D%3D=pwRE6AGJFLDNlh225F5QMaQWCtPHwdhUfCZ%2FLUQzgA2uL5jNRG4jdQ%3D%3D&mCTIbCubSFf XsDGW9IXnlg%3D%
3D=hFflUdN3100%3D&kCx1AnS9%2FpWZQ40DXFvdEw%3D%3D=hFflUdN3100%3D&uJovDxwdjMPoYv%2BAJvYtyA%3D%3D=ctNJFf55vVA%3D&FgPlIEJYlotS%2BYGo
Bi5olA%3D%3D=NHdURQburHA%3D&d9Qjj0ag1Pd993jsyOJqFvmyB7X0CSQK=ctNJFf55vVA%3D&WGewmoAfeNR9xqBux0r1Q8Za60lavYmz=ctNJFf55vVA%3D&WGew
moAfeNQ16B2MHuCpMRKZMwaG1PaO=ctNJFf55vVA%3D
[3] https://www.edp24.co.uk/motoring/norwich-city-centre-traffic-changes-what-they-mean-for-you-1-4328197
[4] https://www.edp24.co.uk/news/politics/norwich-city-centre-roadworks-1-5574005
[5] https://norfolk.citizenspace.com/consultation/golden-ball-street-and-westlegate/supporting_documents/Scheme%20detail%20final.pdf
[6]https://www.youtube.com/watch?v=eWECI7tJpgw
[7] http://www.edp24.co.uk/news/politics/drivers-to-face-diversions-because-norwich-s-carrow-road-bridge-must-shut-for-urgent-repairs-1-5620622
[8] http://www.edp24.co.uk/news/politics/norwich-s-carrow-bridge-to-close-for-urgent-repairs-and-council-bosses-warn-further-disruption-could-follow-1-5684437
[9] https://www.edp24.co.uk/news/opening-of-carrow-bride-cancelled-due-to-nesting-birds-1-5540828
[10] https://www.edp24.co.uk/news/politics/norwich-drivers-told-they-could-still-get-bus-gate-fines-despite-delay-in-camera-installation-1-5555188
[11] https://www.edp24.co.uk/motoring/st-crispins-road-norwich-subway-underpass-1-5562698
[12] http://www.edp24.co.uk/motoring/ketts-hill-norwich-reopens-ahead-schedule-sewer-collapse-1-5737971
[13] https://www.eveningnews24.co.uk/motoring/bus-diversions-ketts-hill-norwich-1-5677826 & SL video
General References:
https://www.norfolk.gov.uk/roads-and-transport/major-projects-and-improvement-plans/norwich/city-centre-improvements/improvement-projects/recently-completed
Google Street View; on-site documentation and OpenStreetMap.Norwich City FC Home Games
Home League Games Dispersing crowds and short closures do
2016: Tue 16 Aug, Sat 10 Sep, Tue 13 Sep, Sat appear to have an effect on the Inner Ring
24 Sep, Sat 15 Oct, Sat 22 Oct, Sat 5 Nov, Sat Road. An East Anglian derby match on 10
3 Dec, Tue 13 Dec, Fri 16 Dec, 2017: Mon 2 Feb 2019 led to widespread traffic issues
Jan, Sat 21 Jan, Sat 28 Jan, Sat 11 Feb, Tue 14 across much of the IRR in both directions,
Feb, Sun 26 Feb, Sat 11 Mar, Sat 18 Mar, Sat 8 peaking between 1400 and 1530.
Apr, Fri 14 Apr, Fri 21 Apr, Sun 7 May, Sun 13
Aug, Wed 16 Aug, Sat 9 Sep, Tue 12 Sep, Sat This does appear to be directly
23 Sep, Sat 14 Oct, Tue 31 Oct, Sat 18 Nov, Sat related to crowd numbers, as
25 Nov, Sat 9 Dec, Fri 22 Dec, 2018: Mon 1 we might expect: a Carabao Cup
Jan, Sat 20 Jan, Sat 3 Feb, Sun 18 Feb, Sat 24 match on 23 August 2016 had an
Feb, Tue 6 Mar, Sat 17 Mar, Fri 30 Mar, Sat 7 attendance of 10,510. The previous
Apr, Sat 14 Apr, Sat 28 Apr, Sat 11 Aug, Wed week’s league game against Bristol
22 Aug, Sat 25 Aug, Sat 15 Sep, Sat 29 Sep, City drew 26,297 (near capacity) and Above: Match days typically cause a ripple effect
Sat 6 Oct, Tue 23 Oct, Sat 27 Oct, Sat 10 Nov, had a much wider and stronger impact on across the IRR, particularly near the stadium. It is
Sat 1 Dec, Sat 8 Dec, Wed 26 Dec, Sat 29 the local road network. often possible to see the pre- and post-match increase
Dec, 2019: Fri 18 Jan, Sat 26 Jan, Sun 10 Feb, in delays, such as here on Carrow Bridge (travelling
south) on Sunday 13th August 2017. Effects can often
Sat 23 Feb, Fri 8 Mar, Wed 13 Mar. Before matches, roads approaching the be seen as far as Chapelfield and Barker St.
stadium can often see between 2 and 5
Carabao Cup Home Games times their usual journey time.
Tue 23 Aug 2016, Tue 8 Aug 2017, Tue 22
Aug 2017, Tue 14 Aug 2018. The road between King St and
Bracondale, for instance, has a
FA Cup Home Games typical journey time of approx. 50
Sat 7 Jan 2017, Sat 6 Jan 2018, Sat 5 Jan 2019. seconds (northbound; towards the
stadium).
England Under-21s Above: Thorpe Rd to Ketts Hill away from stadium
On match days, this can be anywhere after an East Anglia Derby on Sunday 10 Feb 2019.
Thu 6 Sep 2018 (1945 KO) between 200 and 250 seconds, with delays The peak shows a substantial slow-down for traffic
an hour or more before kick-off. between 1400 and 1530.
As matches at Norwich City Football Club
conclude, closures are applied to the local Where matches are played on weekdays
roads to provide safe passage for the (excluding bank holidays) there appears
departing crowds. to be just enough gap between rush hour
and pre-match traffic to avoid the two
Approx. 5 minutes before the end of the combining. Rush hour congestion around
match, the Inner Ring Road between the stadium typically falls away shortly
King Street and Clarence Road is closed. after 1800, so there is plenty of time for (for
This closure applies until the crowds have instance) a 1945 match start.
sufficiently dispersed, typically around 20
minutes later.
Below: Inner Ring Road (Koblenz Ave) adjacent to the
old Carrow Road and football stadium.(in centre of
view)
Sources:
https://www.norwich.gov.uk/matchday
https://cmis.norwich.gov.uk/Live/Document.ashx?czJKcaeAi5tUFL1DTL2UE4zNRBcoShgo=QZIO8k%2BaWXta4245RDyvPz2raqkv0jCtsUELEe6CUYc3noxA9adJaA%3D%3D
&rUzwRPf%2BZ3zd4E7Ikn8Lyw%3D%3D=pwRE6AGJFLDNlh225F5QMaQWCtPHwdhUfCZ%2FLUQzgA2uL5jNRG4jdQ%3D%3D&mCTIbCubSFf XsDGW9IXnlg%3D%3D=
hFflUdN3100%3D&kCx1AnS9%2FpWZQ40DXFvdEw%3D%3D=hFflUdN3100%3D&uJovDxwdjMPoYv%2BAJvYtyA%3D%3D=ctNJFf55vVA%3D&FgPlIEJYlotS%2BYGoBi5o
lA%3D%3D=NHdURQburHA%3D&d9Qjj0ag1Pd993jsyOJqFvmyB7X0CSQK=ctNJFf55vVA%3D&WGewmoAfeNR9xqBux0r1Q8Za60lavYmz=ctNJFf55vVA%3D&WGewmo
AfeNQ16B2MHuCpMRKZMwaG1PaO=ctNJFf55vVA%3DConclusions
This report covers a period of time from lights and stop/go boards. The kinds of
October 2016 to the end of December 2018, things that hold us up for a few hours then
and the data is still incoming. disappear, and are not newsworthy enough
to end up in online archives.
We have gathered a large amount of data
about the Inner Ring Road and - whilst There are sources of historical records like
providing an overview of over two years’ this, but they are prohibitively expensive.
worth of data - this report can only scratch
the surface of the nuances and pecularities Moving forward, whether traffic is
of Norwich’s changing road network. recorded using Google Maps or another
method, it might be wise to begin
The use of Google Maps is relatively novel collecting real-time roadworks information
- certainly for traffic analysis - and with it (which is readily available) and archiving
comes due caution. We cannot scrutinise this alongside the traffic data.
the methods used to collect the data; we
can only assume it is gathered in good faith With many of Norwich’s city centre
to best represent a driver’s view. changes already applied, we may well find
that the data becomes less interesting -
Furthermore, the data collected is not perhaps a good thing - as this would signify
readily comparable to traditional highways a settling of patterns, trends and driver
sources, where much more is learnt about habits, and accommodation of any new
traffic volumes & vehicle types. This systems in place.
is changing with the use of ANPR and
mobile devices, but to some extent it is still However, with traffic volumes constantly
“comparing apples and oranges.” changing, the introduction of the NDR &
the discussions about a Western Extension
Whilst major road changes have been ongoing, and countless reports about the
identifiable in the data, there are plenty changes in urban retail usage, it is unlikely
of occasions where slow-downs are not that things will stay as-is for very long.
readily explained. A sudden spike in
Grapes Hill journey time, or an unusually In that case, hopefully this project can
quiet period across Carrow Road Bridge. be used to demonstrate that a greater
breadth of sources, when used sensibly &
Undoubtedly these are the things we don’t proportionately, can bring value & insights
see from a general reporting perspective: a that we all need to bring about progress
broken down car; a family of ducks; faulty and positive change.
lights, and so on.
There are other factors that may shed
light on the causes of traffic congestion.
We know little retrospectively about Sven Latham
short-term roadworks, temporary traffic Noggin LtdProduced for Norwich Business Improvement District by Noggin Ltd Avalon House, Waltham Business Park, Swanmore SO32 2SA © 2019 All rights reserved.
You can also read