Tidal variability of nutrients in a coastal coral reef system influenced by groundwater - Biogeosciences
←
→
Page content transcription
If your browser does not render page correctly, please read the page content below
Biogeosciences, 15, 997–1009, 2018
https://doi.org/10.5194/bg-15-997-2018
© Author(s) 2018. This work is distributed under
the Creative Commons Attribution 3.0 License.

Tidal variability of nutrients in a coastal coral reef system
influenced by groundwater
Guizhi Wang1,2 , Shuling Wang1 , Zhangyong Wang1 , Wenping Jing1,† , Yi Xu1 , Zhouling Zhang1 , Ehui Tan1 , and
Minhan Dai1,2
1 StateKey Laboratory of Marine Environmental Science, Xiamen University, Xiamen, 361102, China
2 Collegeof Ocean and Earth Sciences, Xiamen University, Xiamen, 361102, China
† deceased

Correspondence: Guizhi Wang (gzhwang@xmu.edu.cn)

Received: 21 April 2017 – Discussion started: 8 May 2017
Revised: 3 December 2017 – Accepted: 15 January 2018 – Published: 20 February 2018

Abstract. To investigate variation in nitrite, nitrate, phos-         sion slopes of 4.60 (R 2 = 0.16) in the spring tide and 13.4
phate, and silicate in a spring–neap tide in a coral reef system      (R 2 = 0.75) in the neap tide, similar to the composition of
influenced by groundwater discharge, we carried out a time-           these nutrients in the water column, 5.43 (R 2 = 0.27) and
series observation of these nutrients and 228 Ra, a tracer            14.2 (R 2 = 0.76), respectively. This similarity indicates that
of groundwater discharge, in the Luhuitou fringing reef at            the composition of nutrients in the water column of the reef
Sanya Bay in the South China Sea. The maximum 228 Ra,                 system was closely related with biological processes during
45.3 dpm 100 L−1 , appeared at low tide and the minimum,              both tidal periods, but the biological influence appeared to
14.0 dpm 100 L−1 , appeared during a flood tide in the spring         be less dominant, as inferred from the less significant corre-
tide. The activity of 228 Ra was significantly correlated with        lations (R 2 = 0.16) during the spring tide when groundwater
water depth and salinity in the spring–neap tide, reflecting          discharge was more prominent. Thus, the variability of nutri-
the tidal-pumping feature of groundwater discharge. Con-              ents in the coral reef system was regulated mainly by biolog-
centrations of all nutrients exhibited strong diurnal variation,      ical uptake and release in a spring–neap tide and impacted by
with a maximum in the amplitude of the diel change for ni-            mixing of tidally driven groundwater and offshore seawater
trite, nitrate, phosphate, and silicate in the spring tide of 0.46,   during spring tide.
1.54, 0.12, and 2.68 µM, respectively. Nitrate and phosphate
were negatively correlated with water depth during the spring
tide but showed no correlation during the neap tide. Ni-
trite was positively correlated with water depth in the spring        1   Introduction
and neap tide due to mixing of nitrite-depleted groundwa-
ter and nitrite-rich offshore seawater. They were also signif-        Coral reefs are considered to be one of the most sensitive and
icantly correlated with salinity (R 2 ≥ 0.9 and P < 0.05) at          stressed ecosystems occupying the coastal zone (Ban et al.,
the ebb flow of the spring tide, negative for nitrate and phos-       2014). Groundwater input to coral reefs has been shown to
phate and positive for nitrite, indicating the mixing of nitrite-     be globally important and carry a significant amount of ter-
depleted, nitrate- and phosphate-rich less saline groundwater         restrially derived nutrients to the reef systems (D’Elia et al.,
and nitrite-rich, nitrate- and phosphate-depleted saline off-         1981; Paytan et al., 2006; Houk et al., 2013). Groundwa-
shore seawater. We quantified variation in oxidized nitrogen          ter discharge is usually enriched in N relative to P with an
(NOx ) and phosphate contributed by biological processes              N : P ratio higher than the Redfield ratio, 16 : 1 (Redfield,
based on deviations from mixing lines of these nutrients.             1960), because of more efficient immobilization of P than N
During both the spring and neap tide biologically contributed         in coastal aquifers (Slomp and Van Cappellen, 2004). Such
NOx and phosphate were significantly correlated with regres-          groundwater characterized by a high N : P ratio thus could
                                                                      have significant impacts on coastal reef ecosystems, consid-

Published by Copernicus Publications on behalf of the European Geosciences Union.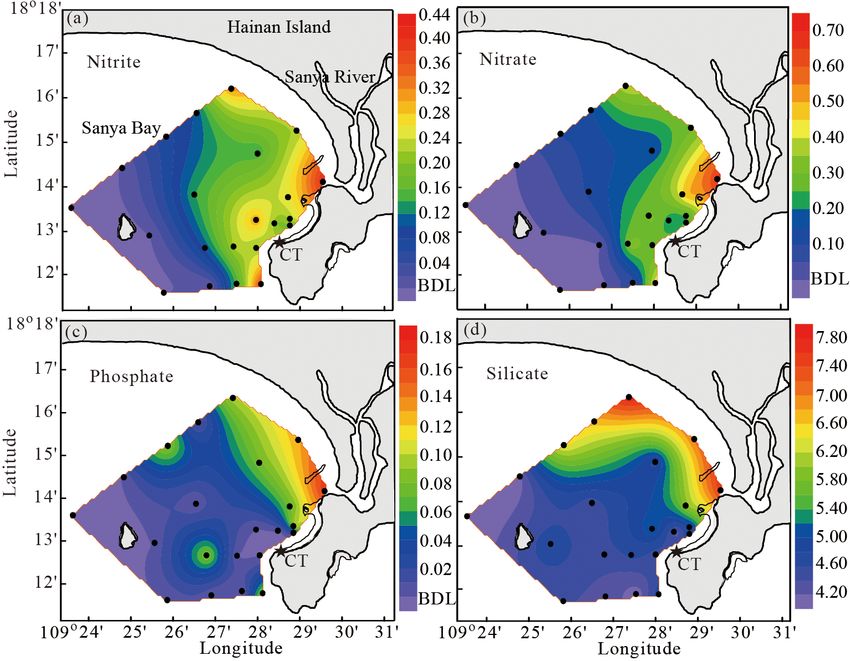
998                G. Wang et al.: Tidal variability of nutrients in a coastal coral reef system influenced by groundwater

ering that benthic marine plants are much more depleted in
P, with an N : P ratio of about 30 : 1 (Atkinson and Smith,
1983). Cuet et al. (2011) have found that the net commu-
nity production in a coral-dominated fringing reef at La Réu-
nion, France, is sustained by net uptake of new nitrogen from
groundwater and net uptake of phosphate from the ocean.
   Groundwater flux onto coral reefs was found to fluctuate
with the tidal cycle (Lewis, 1987; Santos et al., 2010). The
contribution of groundwater discharge to the nutrient budget
of adjacent marine waters of coral reefs varies greatly from
one site to another around the globe and at each site varies
from one tidal state to another (Paytan et al., 2006). How-
ever, there is no study to reveal variation in the composition
of nutrients from spring to neap tide in reef systems influ-
enced by groundwater. Therefore, questions are posed. (a) In
coral reef systems influenced by groundwater, how do the
abundance and composition of nutrients vary from spring to
neap tide? (b) What contributes to the tidal variation of nu-
trients in such a system?
   To address these questions, this study examined the nutri-
ent variability in a spring–neap tidal cycle in the Luhuitou
fringing reef in Sanya Bay, China, during a dry season.
Our previous study showed that tidally driven groundwa-
ter discharge affected the carbonate system in the Luhuitou
fringing reef (Wang et al., 2014). In this reef system,
groundwater discharge played a predominant role during the
spring tide, and biological activities (including photosynthe-
sis/respiration and calcification/dissolution) dominated dur-
ing the neap tide in regulating diurnal variation of the carbon-   Figure 1. Study area, sampling stations and salinity distribution (a)
ate parameters. Time-series observations of nutrients carried      and vertical profiles of salinity (b) in February 2012 in Sanya Bay,
out at the same time as for the carbonate parameters in this       Hainan Island (HI) in the South China Sea. HK represents Hong
reef system made this study possible. The naturally occurring      Kong. CT is the coastal reef time-series station. Salinity data were
radioactive radium isotope, 228 Ra, was utilized as a tracer of    reported in Wang et al. (2014).
groundwater discharge in this study.

                                                                   area. Surface salinity in Sanya Bay in our sampling period
2     Materials and methods                                        ranged from 33.60 to 33.89 (Wang et al., 2014). Irregular di-
                                                                   urnal tides prevail in Sanya Bay, with a mean tidal range of
2.1    Site description                                            0.90 m and the largest value of 2.14 m (Zhang, 2001). The
                                                                   Luhuitou fringing reef is a leeward coast with low wave en-
Sanya Bay is a tropical bay situated at the southern tip of        ergy in winter (Zhang, 2001). In summer coastal upwelling
Hainan Island, China, in the northern South China Sea un-          off the east of Hainan Island mainly induced by the south-
der the influence of the Southeast Asian monsoon (Fig. 1).         east monsoon may extend to this area (Wang et al., 2016).
Seasonal monsoons dominate Hainan Island, with northeast           The Holocene deposits of coral debris and biogenic car-
winds in November to March and southwest winds in May              bonate sands (secondary reef) form the surficial unconfined
to September. Rainfall ranges from 961 to 2439 mm yr−1 in          aquifer around the fringing reef (Zhao et al., 1983), making
1994–2011, with about 80 % precipitation occurring during          groundwater a diffuse source of nutrients for the reef sys-
May to October (Zhang et al., 2013). The coastal reef time-        tem. Macroalgae cover about 60 %, on average, of the bot-
series station CT is located at the Luhuitou fringing reef in      tom hard substrates in the Luhuitou fringing reef (Titlyanov
the southeast of Sanya Bay. There was no rain in the two           and Titlyanova, 2013). Living scleractinian corals were ob-
weeks before our sampling starting on 2 February 2012 and          served in the lower intertidal zone and subtidal zone with
during our 11-day-long sampling period based on data from          coverage of 5–40 % (Titlyanov and Titlyanova, 2013; Ti-
the nearby meteorological station in the Hainan Tropical Ma-       tlyanov et al., 2014, 2015). Cyanobacteria and Rhodophyta
rine Biology Research Station, Chinese Academy of Science.         prevailed in the upper intertidal zone, while Rhodophyta and
No surface runoff was present during these periods in this         Chlorophyta were the most abundant in the middle and lower

Biogeosciences, 15, 997–1009, 2018                                                         www.biogeosciences.net/15/997/2018/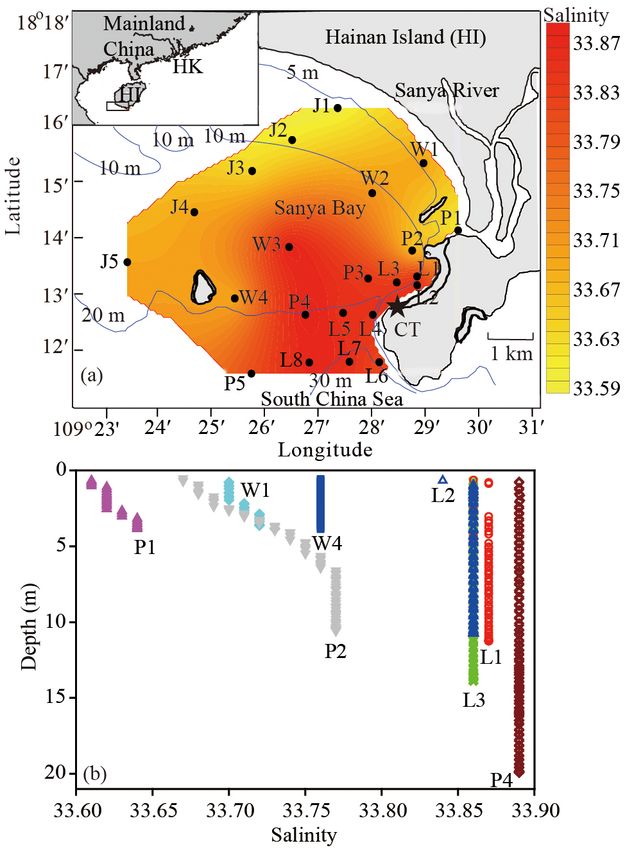
G. Wang et al.: Tidal variability of nutrients in a coastal coral reef system influenced by groundwater                            999

intertidal zones (Titlyanov et al., 2014). Rhodophyta domi-
nated the benthic macroalgal community, 54 % in the upper
subtidal zone (Titlyanov and Titlyanova, 2013). The number
of species in the marine flora has increased by 28 % from
1990 to 2010 with a displacement of slow-growing species
likely due to anthropogenic influences and coral bleaching
(Titlyanov et al., 2015). The mean coral cover has decreased
in the Luhuitou fringing reef from 90 % in the 1960s to 12 %
in 2009 (Zhao et al., 2012), likely owing to a combination of
regional anthropogenic impacts and climate change (Li et al.,
2012).                                                                                                      2
                                                                  Figure 2. Daily variance of water depth (σDepth ) and salinity
   To the north of the Luhuitou fringing reef, the Sanya River      2
flows into Sanya Bay, with an annual average discharge of         (σSalinity ) at the coastal reef station CT during 6–13 February 2012.
5.86 m3 s−1 (Wang et al., 2005). The river is fed mainly by
southwest monsoons from May to October. There is no dam
in the upstream to regulate the river. During our sampling pe-        Nutrient samples were filtered with 0.45 µm cellulose ac-
riod the Sanya River plume was confined in the northeast of       etate membranes and poisoned with 1–2 ‰ chloroform. One
the bay and the coastal reef station CT was outside the influ-    filtrate was preserved at 4 ◦ C for dissolved silicate deter-
ence of the Sanya River plume (Fig. 1) (Wang et al., 2014).       mination, and one was frozen and kept at −20 ◦ C for ni-
Investigations of nutrients, Chl a, and phytoplankton in the      trate, nitrite, and phosphate measurements. In the labora-
bay have been conducted seasonally for several years (Dong        tory, nutrients were measured with an AA3 Auto-Analyzer
et al., 2010; Wu et al., 2011, 2012b, c) and demonstrate that     (Bran-Luebbe, GmbH), following the same methods in Han
the inner bay is influenced by the discharge of the Sanya         et al. (2012). The analytical precision was better than 1 %
River with its relatively high nutrient levels, and the central   for nitrate and nitrite, 2 % for phosphate, and 2.8 % for
and outer bay are dominated by oceanic exchange with the          silicate. The detection limit was 0.04 µM for nitrate and
South China Sea (Wu et al., 2012a). Nutrients carried by sub-     nitrite, 0.08 µM for phosphate, and 0.16 µM for silicate.
marine groundwater discharge into Sanya Bay account for at        Blanks were directly set up as baselines during the mea-
least 79 % of the nutrients into the bay in our sampling pe-      surements and subtracted. Radium samples of 30 L seawa-
riod (Wang et al., submitted). The concentrations of nutri-       ter were passed through a 1 µm cartridge filter before they
ents in the saline groundwater near the reef and in the upper     were passed through an MnO2 -impregnated acrylic fiber (Mn
stream of the Sanya River estuary during our sampling pe-         fiber) column to extract dissolved radium (Rama and Moore,
riod were 1.66 ± 0.53 and 8.8 µM phosphate, 142 ± 14 and          1996). The Mn fibers were leached with 1 M solutions of hy-
36.6 µM oxidized nitrogen (NOx , including nitrate and ni-        droxylamine hydrochloride and HCl to release 226 Ra and
                                                                  228 Ra, which were then co-precipitated with BaSO and
trite), and 237 ± 2 and 271 µM silicate, respectively (Wang                                                              4
et al., 2018).                                                    measured in a germanium gamma detector (GCW4022, Can-
                                                                  berra) (Moore, 1984) with an error of less than 7 %.
2.2   Sampling and measurements
                                                                  2.3   Linear regression and contour plotting
The setup of the sampling platform at the time-series station
                                                                  To gain insight into factors affecting nutrients from spring
CT is provided in detail in Wang et al. (2014). Briefly, water
                                                                  to neap tide, linear regressions were conducted between wa-
was collected using a submersible pump, and depth and salin-
                                                                  ter depth, salinity, and 228 Ra activity, between water depth,
ity were measured with a conductivity–temperature–depth
                                                                  salinity, and nutrients’ concentration, and between biologi-
system (Citadel, RDI Co., USA) attached on a buoy. Discrete
                                                                  cally contributed nutrients during the spring and neap tide.
nutrient and radium samples were taken every 3 h during 6–
                                                                  A significance level of 0.05 was taken. The data were fit us-
13 February 2012, except on 7–8 February when the maxi-
                                                                  ing SigmaPlot (Systat Software, San Jose, California, USA;
mum tidal range of 1.4 m occurred (Wang et al., 2014), and
                                                                  https://systatsoftware.com/). In plotting contours in Sanya
the samples were collected every 2 h. A mapping cruise was
                                                                  Bay, Surfer 11 was utilized with kriging interpolation due to
conducted in Sanya Bay during 2–3 February 2012 (Fig. 1)
                                                                  its good linear unbiased prediction of the intermediate values
to evaluate the influence of the Sanya River and to con-
                                                                  in spatial analysis (Papritz and Stein, 2002).
strain the endmember of the offshore water. Nutrient samples
for nitrate, nitrite, phosphate, and silicate were collected in
Sanya Bay at surface and bottom depths using 5 L Niskin bot-
tles. Temperature and salinity were measured using a multi-
parameter sonde YSI 6600. The salinity was reported using
the Practical Salinity Scale.

www.biogeosciences.net/15/997/2018/                                                          Biogeosciences, 15, 997–1009, 2018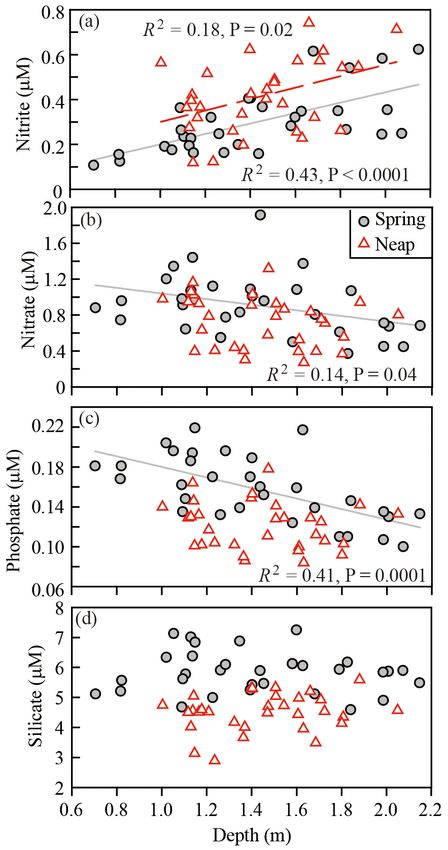
1000 G. Wang et al.: Tidal variability of nutrients in a coastal coral reef system influenced by groundwater
3 Results
3.1 Time-series observations of nutrients and radium
at the coastal coral reef station
Time-series observations of salinity, 226 Ra, and water depth
at station CT were reported in Wang et al. (2014), which
demonstrated that the water depth at station CT varied from
0.7 to 2.1 m and the salinity ranged from 33.43 to 33.67 dur-
ing 6–13 February 2012 (Table S1). The greatest tidal range
occurred on 7 February 2012 (Wang et al., 2014), the 16th of
the lunar month. To separate neap tide from spring tide days,
the daily variance of water depth and salinity were plotted
(Fig. 2). The daily variance of a variable was calculated as
n x 2 − ( x)2
P P
σ2 = , (1)
n(n − 1)
where x is the average of the variable in a day and n is the
number of samples of the variable in that day. A sharp de-
crease in the variance of salinity occurred on 10 February
2012 and the variance remained low (< 0.001) afterwards.
Thus, two distinctive groups stood out, with one group in the
period of 6–9 February 2012 having greater variance of water
depth and salinity and the other in the period of 10–13 Febru-
ary 2012 having less variance. Therefore, we took 6–9 Febru-
ary 2012 as the spring tide period and 10–13 February 2012
as the neap tide period in this work.
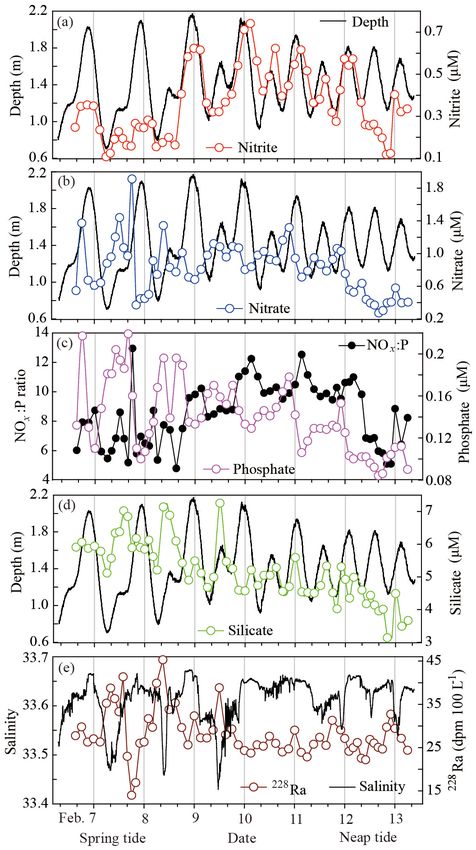
The concentration of nutrients varied with different pat-
terns from spring to neap tide (Fig. 3). Nitrite varied from
0.11 to 0.71 µM during the spring tide and from 0.12 to
0.74 µM in the neap tide, with the maximum diel variation of
0.46 µM present during the spring tide (Fig. 3a). The diurnal
variation was 0.24–0.46 µM during the spring tide and 0.34–
0.45 µM in the neap tide. Daily peaks of nitrite usually ap-
peared at high tide from the spring to neap tide. The concen-
tration was positively correlated with water depth (P < 0.05)
during both the spring and neap tide, but the correlation was
less significant during the neap tide (Fig. 4a). Nitrate and Figure 3. Time-series observations of nutrients and 228 Ra at sta-
phosphate, however, showed an opposite pattern. During the tion CT in the Luhuitou reef of Sanya Bay, China, during 6–
spring tide, nitrate and phosphate were negatively correlated 13 February 2012. (a) Nitrite, (b) nitrate, (c) phosphate and NOx : P
with water depth (P < 0.05) (Fig. 4b and c). They reached ratio, (d) silicate, and (e) 228 Ra. Lines connecting the symbols are
their peak concentrations of 1.91 and 0.22 µM, respectively, to show trends. Water depth and salinity were reported in Wang
et al. (2014).
in the late afternoon and their minima of 0.37 and 0.10 µM,
respectively, at night on 7 February 2012 (Fig. 3b and c). The
diurnal variation fell in the range of 0.44–1.54 µM for nitrate
and 0.04–0.12 µM for phosphate. During the neap tide, the
concentrations varied from 0.27 to 1.32 µM for nitrate and tide (Fig. 3c). Silicate showed a trend different from either
0.084 to 0.18 µM for phosphate, with less diurnal variation nitrite or nitrate and phosphate (Fig. 3d). It was not signif-
in the range of 0.35–0.52 µM for nitrate and 0.04–0.05 µM icantly correlated with water depth during either spring or
for phosphate. The correlation with water depth was not sig- neap tide (P > 0.2). The concentration of silicate, in gen-
nificant for both nutrients (P > 0.15). Nitrate is the domi- eral, decreased from spring to neap tide. During the spring
nant species (> 50 %) of NOx during the spring–neap tidal tide, the concentration of silicate fell in the range of 4.57–
period except at 02:00 LT on 12 February 2012 when the 7.25 µM. The daily peak concentration of silicate appeared
concentrations of nitrite and nitrate were almost equal. The almost at the daily lowest salinity. The diurnal variation in
NOx : P ratio varied from 4.78 to 12.9 in the spring–neap silicate was 1.91–2.68 µM. During the neap tide, however,
Biogeosciences, 15, 997–1009, 2018 www.biogeosciences.net/15/997/2018/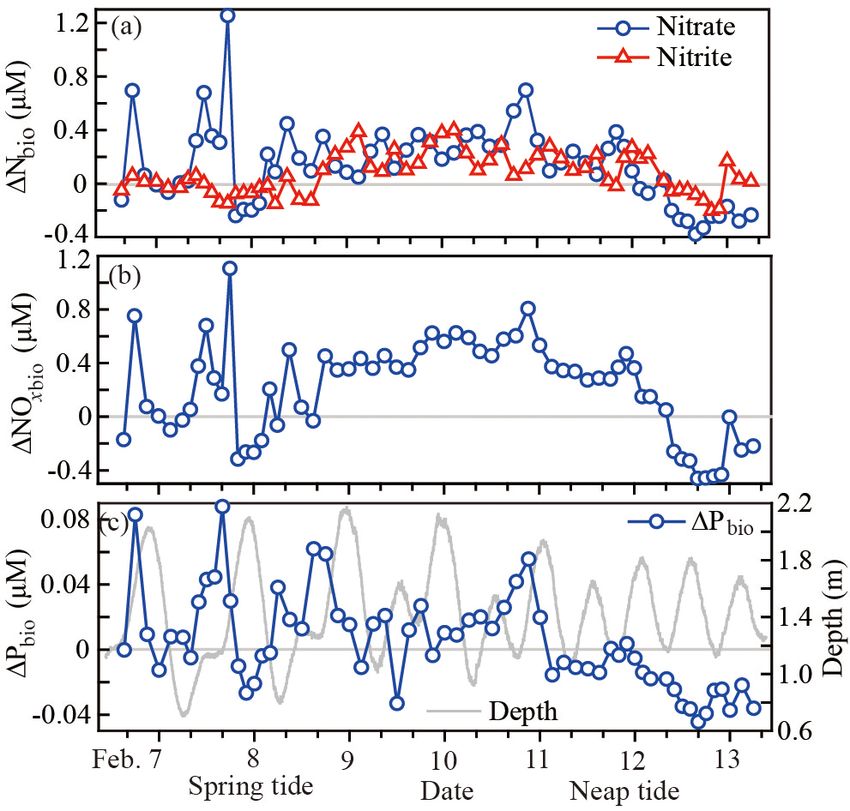
G. Wang et al.: Tidal variability of nutrients in a coastal coral reef system influenced by groundwater                            1001

                                                                        eral, decreased from the northeast coast, where the influence
                                                                        of the Sanya River plume is apparent in winter (Wang et al.,
                                                                        2014), to the south and west, where the South China Sea wa-
                                                                        ter intrudes (Fig. 6). At stations far offshore (stations J4-5
                                                                        and W3-4), the concentrations of nitrite, nitrate, and phos-
                                                                        phate were all below the detection limit and the concentration
                                                                        of silicate was about 4.00 µM. At other stations, the concen-
                                                                        tration of all the nutrients remained low, but was nonethe-
                                                                        less detectable. For example, the maximum concentrations
                                                                        of only 0.43 µM for nitrite, 0.70 µM for nitrate, 0.18 µM for
                                                                        phosphate, and 7.92 µM for silicate were recorded at station
                                                                        P1, the station closest to the Sanya River estuary. The small
                                                                        islands in Sanya Bay did not show apparent influence on the
                                                                        nutrients in the bay since nutrients were below their detection
                                                                        limits or remained low around these islands (Fig. 6). The wa-
                                                                        ter depth at these mapping stations was no less than 5 m and
                                                                        the concentration of nutrients at the bottom depth differed lit-
                                                                        tle from that at the surface at most of these offshore stations
                                                                        (Table 1). This vertical distribution confirms that the water
                                                                        in Sanya Bay is relatively homogenous in February (Wang
                                                                        et al., 2014). The NOx : P ratio was less than 7 in Sanya Bay,
                                                                        except at stations P2 and L6 where the NOx : P ratio was
                                                                        around 9.

                                                                        4     Discussion

                                                                        4.1    What affects tidal variation in nutrients at the reef
Figure 4. Concentrations of nutrients in the water column against              station CT?
water depth during the spring tide and neap tide at station CT in the
Luhuitou reef during 6–13 February 2012. (a) Nitrite, (b) nitrate,      The time-series observation of salinity at station CT suggests
(c) phosphate, and (d) silicate.                                        that more freshwater input into the reef system occurred dur-
                                                                        ing the ebb flow of the spring tide as inferred from lower
                                                                        salinity than during that of the neap tide (Wang et al., 2014).
silicate ranged from 2.89 to 5.59 µM and showed less diurnal            The distribution of salinity in Sanya Bay demonstrated that
variability, 1.44–2.09 µM.                                              the surface salinity was slightly lower in the northeast off the
   The diurnal variation in the activity of 228 Ra at sta-              Sanya River mouth than in southern Sanya Bay (Fig. 1a). At
tion CT was 16.5–27.4 dpm 100 L−1 (i.e., 2.75–4.56 Bq m−3 )             stations P1 and P2 the surface salinity was less than 33.70,
during the spring tide, the maximum of which appeared on                while at stations around station CT, i.e., stations L1, L2, L3,
7 February, and 5.31–10.6 dpm 100 L−1 around the neap tide              and P3, the surface salinity was greater than 33.80 (Table 1).
(Fig. 3e). The maximum 228 Ra, 45.3 dpm 100 L−1 , appeared              The vertical profiles of salinity at these stations also showed
at low tide on 8 February during the spring tide and the min-           a similar difference, with salinity below 33.80 throughout the
imum, 14.0 dpm 100 L−1 , appeared during the flood tide of              water column at river-influenced stations (Fig. 1b). This indi-
the spring tide on 7 February. The activity of 228 Ra was sig-          cates that the Sanya River plume affected the northeast of the
nificantly correlated with water depth in the spring–neap tidal         bay with little impact on station CT and that the only source
period (P = 0.002) (Fig. 5a). This pattern reflected the varia-         of freshwater at station CT in February would be groundwa-
tion in the groundwater discharge induced by tidal pumping              ter discharge (Wang et al., 2014) since in the two weeks be-
in this coral reef system (Wang et al., 2014), which is also ob-        fore our sampling and during our sampling period there were
served in other coastal regions (Burnett and Dulaiova, 2003;            no rainfall and consequent surface runoff in this area. The co-
Santos et al., 2010).                                                   incidence of the daily minimum salinity with the highest ac-
                                                                        tivity of 228 Ra during the ebb flow of the spring tide (Fig. 3e)
3.2   Distributions of nutrients in Sanya Bay                           and the significant correlation between the activity of 228 Ra
                                                                        and salinity during the spring–neap tidal period (P < 0.0001)
In Sanya Bay the highest concentration of nutrients appeared            (Fig. 5b) confirms that the tidally driven groundwater dis-
near the Sanya River estuary, and the concentration, in gen-            charge occurred at the coral reef station CT. Greater ground-

www.biogeosciences.net/15/997/2018/                                                              Biogeosciences, 15, 997–1009, 2018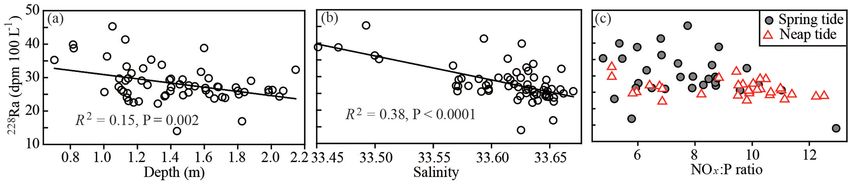
1002                G. Wang et al.: Tidal variability of nutrients in a coastal coral reef system influenced by groundwater

Figure 5. The activity of 228 Ra against (a) water depth, (b) salinity, and (c) the NOx : P ratio in the water column at station CT during
6–13 February 2012.

Figure 6. Surface distributions of nutrients in Sanya Bay in February 2012. (a) Nitrite, (b) nitrate, (c) phosphate, and (d) silicate. The units
are in µM. BDL refers to below the detection limit, which is 0.04 µM for nitrate and nitrite and 0.08 µM for phosphate.

water discharge appeared during the ebb flow in the spring                ing feature, higher NOx and phosphate would appear at low
tide than in the neap tide as indicated by the higher activity            tide. From Fig. 4, the daily maximum concentration of NOx ,
of 228 Ra, bringing more groundwater into the reef system.                phosphate, and silicate appeared in the daytime at relatively
   Under the influence of tidally driven groundwater dis-                 low tide, while the minimum appeared mostly at night at
charge, variation in nitrite, nitrate, phosphate, and silicate            high tide, indicating the mixing of tidally driven groundwater
during the spring tide followed a tidal pattern. Inferred from            and offshore seawater. During the neap tide, however, NOx
the significant correlation between nutrients and water depth             and phosphate showed less diurnal variation. The daily max-
during the spring tide (Fig. 4), the groundwater discharge was            imum concentration of NOx and phosphate appeared around
characterized by higher nitrate and phosphate and lower ni-               midnight, when a flood tide appeared. This pattern of daily
trite than the offshore seawater. Since nitrate dominated NOx             maximum in a flood tide at night reflected dominance of bi-
during the time-series observation (Fig. 3), groundwater dis-             ological processes because in a flood tide there were fewer
charge was characterized by higher NOx and phosphate than                 groundwater-associated nutrients and nutrients were released
the offshore seawater. Because groundwater discharge was                  the most at night by biological processes. This pattern is con-
greater at low tide than at high tide due to its tidal pump-              sistent with the time-series observation of dissolved oxygen

Biogeosciences, 15, 997–1009, 2018                                                                 www.biogeosciences.net/15/997/2018/
G. Wang et al.: Tidal variability of nutrients in a coastal coral reef system influenced by groundwater                                1003

Table 1. Sampling stations and data collected in Sanya Bay in February 2012.

        Station      Latitude       Longitude           Bottom      Sample    Temperature   Salinity   NO−2    NO−3    PO3−
                                                                                                                          4    SiO2−
                                                                                                                                  3
                     (◦ N)          (◦ E)             depth (m)   depth (m)         (◦ C)              (µM)    (µM)     (µM)    (µM)
        J1           18.2718        109.4565                 8          0.5         22.80     33.60    0.328   0.410   0.104   7.916
                                                                        6.5         22.74     33.60    0.298   0.343   0.098   7.485
        J2           18.2623        109.4423                 9          0.5         22.66     33.62    0.103   0.149   BDL     6.708
                                                                        8.0         22.64     33.63    0.124   0.162   BDL     6.531
        J3           18.2531        109.4298                12         0.5          22.70     33.64    0.073   0.104   0.090   6.472
                                                                      11.0          22.69     33.65    0.104   0.067   0.108   6.318
        J4           18.2409        109.4118                11         0.5          22.81     33.70    BDL     BDL     BDL     4.069
                                                                      12.4          22.81     33.70    BDL     BDL     BDL     4.095
        J5           18.2261        109.3909                15         0.5          22.90     33.70    BDL     BDL     BDL     4.058
                                                                      14.0          22.88     33.74    BDL     BDL     BDL     4.126
        W4           18.2154        109.4244                17         0.5          22.90     33.70    BDL     BDL     BDL     4.768
                                                                      17.5          22.73     33.75    BDL     BDL     BDL     4.760
        W3           18.2306        109.4413                16         0.5          22.97     33.89    0.136   0.112   BDL     4.476
                                                                      16.0          23.40     33.60    0.063   0.098   BDL     5.188
        W2           18.2466        109.4672                12          0.5         22.93     33.72    0.147   0.158   0.081   4.724
                                                                        9.5         22.76     33.73    0.075   0.127    BDL    5.179
        W1           18.2555        109.4832                 5          0.5         23.12     33.70    0.228   0.299   0.131   7.136
                                                                        3.0         22.92     33.73    0.228   0.234   0.102   6.317
        P3           18.2213        109.4660                16         0.5          22.75     33.84    0.300   0.309   BDL     5.172
                                                                      16.0          22.87     33.76    0.132   0.144   BDL     4.655
        P2           18.2296        109.4797                11         0.5          23.01     33.67    0.262   0.496   0.082   6.035
                                                                      11.0          22.90     33.77    0.206   0.204    BDL    4.569
        P1           18.2355        109.4940                 5          0.5         22.98     33.62    0.426   0.699   0.178   7.726
                                                                        2.8         22.97     33.64    0.350   0.525   0.157   7.671
        P4           18.2105        109.4464                12         0.5          22.71     33.89    0.108   0.002   0.081   4.519
                                                                      19.0          22.67     33.89    0.200   0.013   0.130   4.935
        P5           18.1931        109.4296                26         0.5          22.69     33.81    BDL     BDL     BDL     4.428
                                                                      26.0          22.74     33.87    0.054   0.076   BDL     4.522
        L8           18.1964        109.4476                25         0.5          22.78     33.88    BDL     BDL     BDL     4.282
                                                                      25.5          22.75     33.88    0.191   0.005   0.082   4.528
        L7           18.1966        109.4601                32         0.5          22.83     33.86    0.171   0.092   BDL     4.093
                                                                      30.7          22.78     33.87    0.077   0.081   BDL     4.400
        L6           18.1965        109.4694                23         0.5          22.79     33.82    0.420   0.516   0.097   4.859
                                                                      27.0          22.77     33.87    0.405   0.431   0.112   4.839
        L5           18.2111        109.4582                21         0.5          22.74     33.85    0.231   0.326   BDL     4.643
                                                                      18.0          22.79     33.86    0.355   0.392   0.097   4.480
        L4           18.2105        109.4674                20         0.5          22.76     33.85    0.219   0.248   BDL     4.484
                                                                      21.0          22.77     33.87    0.285   0.309   BDL     4.645
        L3           18.2201        109.4749                12         0.5          22.79     33.84    0.194   0.193   BDL     4.315
                                                                      12.8          22.79     33.86    0.202   0.183   BDL     4.444
        L2           18.2193        109.4812                11         0.5          22.81     33.85    0.192   0.309   BDL     5.006
                                                                      11.0          22.80     33.86    0.195   0.218   BDL     4.639
        L1           18.2219        109.4812                11         0.5          22.76     33.84    0.244   0.253   0.101   4.887
                                                                      11.0          22.81     33.87    0.353   0.235   0.107   5.252

      Note that BDL refers to below the detection limit.

www.biogeosciences.net/15/997/2018/                                                                     Biogeosciences, 15, 997–1009, 2018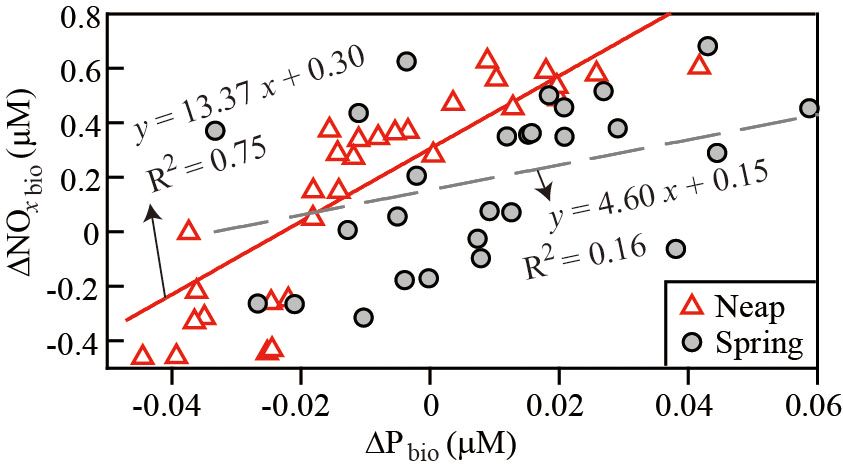
1004 G. Wang et al.: Tidal variability of nutrients in a coastal coral reef system influenced by groundwater
at this site (Wang et al., 2014). The daily minimum appeared look was taken at the behaviors of nitrite, nitrate, and phos-
for NOx and phosphate in the afternoon or between midnight phate with salinity during the falling and rising phases on
and dawn at high tide, reflecting the dominance of nutrient- February 7, the day with the greatest tidal range in the spring
depleted offshore seawater. Adsorption/desorption from par- tide period. Figure 8 shows that these nutrients behaved dif-
ticles might be a factor influencing the phosphate concen- ferently during the two phases. During the ebb flow, with
tration, as proposed for estuaries (e.g., Froelich et al., 1982; a fast falling speed as indicated by the sharp slope of water
van der Zee et al., 2007). At the reef station the salinity was depth (Fig. 3), nitrite, nitrate, and phosphate behaved con-
close to the seawater (> 33) and the water was clear (the total servatively; i.e., their concentrations were significantly cor-
suspended matter was low, about 15 mg L−1 ), which makes related with salinity (P < 0.05). Nitrite was positively corre-
adsorption/desorption negligible. The clear water, as well as lated with salinity (R 2 = 0.94), while nitrate and phosphate
low wave energy in the reef in winter (Zhang, 2001), also were negatively correlated with salinity (R 2 = 0.91 and 0.90,
limits the possibility of sediment resuspension being a source respectively) (Fig. 8). These conservative behaviors indicated
of radium and nutrients. mixing between the groundwater discharge and the offshore
Under the controls of tidally driven groundwater discharge seawater. During the flood tide, with a relatively slow speed
and biological processes, the composition of nutrients in the as indicated by a smaller slope of water depth (Fig. 3), how-
reef system also differed from the spring tide to the neap tide. ever, nitrite showed an apparent removal signal relative to the
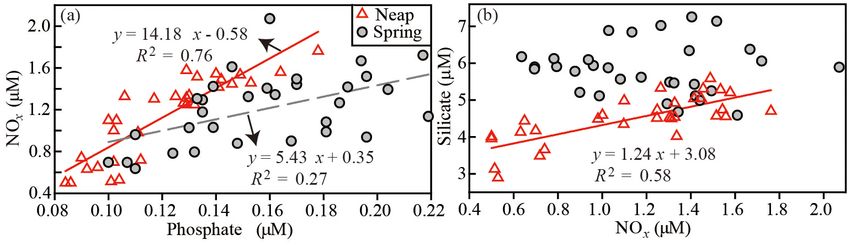
During the spring tide when groundwater discharge played conservative mixing line while additions of nitrate and phos-
a predominant role in regulating the concentration of nutri- phate appeared. This consumption of nitrite and generation
ents in the reef system, the concentration of NOx was pos- of nitrate and phosphate were due to biological processes in
itively correlated with the concentration of phosphate, with this period. Based on the conservative mixing lines shown
a regression slope of 5.43 and R 2 of 0.27 (Fig. 7a). The con- in Fig. 8, we could estimate nitrite, nitrate, and phosphate
centration of silicate was not significantly correlated with owing to mixing of the offshore seawater and groundwater
the concentration of NOx (Fig. 7b). During the neap tide discharge using the salinity measured at station CT (SCT ),
when groundwater discharge was less prominent, the cor- designated as NO2mix , NO3mix , and Pmix :
relation between the concentrations of NOx and phosphate
was more significant, with a regression slope of 14.2 and NO2mix = (1.37 ± 0.21) · SCT − (45.75 ± 6.88), (2)
R 2 of 0.76. The NOx : P ratio was closer to the Redfield ra- NO3mix = (−1.78 ± 0.32) · SCT + (60.50 ± 10.82), (3)
tio than during the spring tide. The concentration of silicate Pmix = (−0.36 ± 0.07) · SCT + (12.12 ± 2.27). (4)
showed significant correlation with the concentration of NOx
in the water column, with a regression slope of 1.24 and R 2 Two assumptions were made before setting up these equa-
of 0.58. Diatoms dominate the phytoplankton community in tions: (a) there was no other water mass flowing into the
Sanya Bay (Zhou et al., 2009). The elemental ratio of Si : N is reef system besides offshore seawater and groundwater, and
0.80 ± 0.35 for nanoplankton and 1.20 ± 0.37 for net plank- (b) mixing of offshore seawater and groundwater from spring
ton (Brzezinski, 1985). The similarity of the composition of to neap tide followed the relation derived from data on the
silicate and NOx in the water column to the elemental ratio day with the greatest tidal range. The differences between
of diatoms implies a biological control. Unfortunately, no in- the measured concentrations of nutrients and the nutrient
formation is available on particular reef primary producers concentrations resulting from mixing represented nutrients
and sponges that may take up/release silicate in this reef sys- contributed by biological processes, designated as 1NO2bio ,
tem to further the discussion. The activity of 228 Ra, however, 1NO3bio and 1Pbio :
was not significantly correlated with the NOx : P ratio in the
water column from spring to neap tide (P > 0.05) (Fig. 5c), 1NO2bio = NO2CT − NO2mix , (5)
indicating that the composition of nutrients in the water col- 1NO3bio = NO3CT − NO3mix , (6)
umn was not predominantly controlled by groundwater dis- 1Pbio = PCT − Pmix , (7)
charge. Therefore, we propose that biological processes pre-
dominantly controlled the composition of nutrients in the reef where the subscript “CT” represents the measured value at
system but that there was less of an impact in the spring tide station CT. The oxidized nitrogen contributed by biological
due to groundwater discharge. processes, 1NOxbio , is the sum of 1NO2bio and 1NO3bio .
Positive values represent regeneration and release of nutri-
4.2 The generation and consumption of NOx and ents in the water column, and negative values reflect uptake
phosphate at the reef station CT of nutrients by marine flora (including phytoplankton and
benthic flora in this system). Benthic release due to reminer-
N and P are the general limiting nutrients for the abundance alization of organic matter contributes to the positive values.
of phytoplankton in coastal ecosystems (Jickells et al., 1998). The nutrients contributed by biological processes showed
To quantify the contribution of biological processes to the the greatest diurnal variation in nitrate and phosphate on
variation in the NOx and phosphate at station CT, a closer 7 February 2012, which is in the spring tide, while the
Biogeosciences, 15, 997–1009, 2018 www.biogeosciences.net/15/997/2018/G. Wang et al.: Tidal variability of nutrients in a coastal coral reef system influenced by groundwater 1005
Figure 7. Concentrations of (a) NOx against phosphate and (b) silicate against NOx in the water column during the spring tide and neap tide
at station CT during 6–13 February 2012.
Figure 9. Variations of nutrients contributed by biological processes
in a spring–neap tide during 6–13 February 2012 at the coastal reef
station CT. (a) Nitrite and nitrate, (b) NOx , and (c) phosphate (P).
Figure 8. Behaviors of nutrients with salinity during the ebb flow Water depth was reported in Wang et al. (2014).
and flood tide of the spring tide at station CT. (a) Nitrite, (b) nitrate,
and (c) phosphate.
curred from 18:00 on 8 February to 08:00 on 12 February
2012 and 1NOxbio was negative afterwards on 12–13 Febru-
maximum of biologically contributed nitrite appeared on ary 2012, indicating net consumption (Fig. 9b). The biolog-
12 February 2012, which is in the neap tide (Fig. 9). Ni- ical contribution of phosphate had greater diurnal variation
trite contributed by biological processes ranged from −0.15 during the spring tide than during the neap tide (Fig. 9c).
to 0.39 µM during the spring tide and from −0.20 to 0.40 µM The greatest diel variation during the spring tide in 1Pbio ap-
during the neap tide (Fig. 9a). From 18:00 on 8 February peared on 7 February 2012 when 1Pbio varied from −0.027
to 18:00 on 11 February 2012, biologically contributed ni- to 0.088 µM, while during the neap tide the greatest varia-
trite was positive throughout the period, indicating produc- tion occurred on 10 February 2012 when 1Pbio ranged from
tion of nitrite. For nitrate it was produced throughout the pe- 0.009 to 0.056 µM. Net phosphate consumption occurred
riod from 04:00 on 8 February to midnight on 11 February throughout the period of 12–13 February 2012.
2012. During the spring tide biologically contributed nitrate The relationship between 1NOxbio and 1Pbio during the
varied from −0.24 to 1.25 µM and during the neap tide it fell spring tide differed from that during the neap tide. Note that
in the range of −0.38 to 0.70 µM. Net NOx production oc- NOx is not equivalent to dissolved inorganic nitrogen (DIN).
www.biogeosciences.net/15/997/2018/ Biogeosciences, 15, 997–1009, 20181006 G. Wang et al.: Tidal variability of nutrients in a coastal coral reef system influenced by groundwater
Figure 10. Relationship between biologically contributed NOx and
phosphate during the spring tide and neap tide at station CT in the
Figure 11. Uptake rate of NOx against the concentration of NOx
Luhuitou fringing reef in 6–13 February 2012.
in the water column at reef station CT in a spring–neap tide during
6–13 February 2012.
Ammonium data are not available in this study for us to
discuss the relationship between DIN and phosphate, which The uptake rate ranged from −9.04 to 19.1 mmol m−2 d−1 ,
limited our discussion to NOx and makes the picture of mi- which compares well with the sum of nitrate and nitrite fluxes
crobial processes that control dissolved inorganic nitrogen in over Ningaloo Reef, a fringing reef in Australia, −24 to
the coral reef system incomplete. However, tidal variation in 15 mmol m−2 d−1 (Wyatt et al., 2012). It is significantly cor-
ammonium is expected at this site and may have been re- related with the concentration of NOx in the water column
lated to the change in the relationship between 1NOxbio and (Fig. 11), with a slope of 14.5 and R 2 of 0.94 (P < 0.0001),
1Pbio . During the spring tide there was significant correla- indicating the mass-transfer limitation of NOx uptake. The
tion between 1NOxbio and 1Pbio , with a regression slope of slope (in m d−1 ) falls in the range of the typical uptake rate
4.60 and R 2 of 0.16 (Fig. 10). During the neap tide, however, coefficient for dissolved inorganic nitrogen reported in Falter
the correlation was much more significant with a regression et al. (2004). Corals may be capable of adaptive changes in
slope of 13.4 and R 2 of 0.75. The regression slope of the re- uptake kinetics depending on nutrient availability. However,
gression between biologically contributed NOxbio and phos- the rate of nitrogen acquisition appeared to be influenced on
phate was similar to that of the significant regression between a diel cycle in the coral reef system, presumably due to de-
NOxbio and phosphate in the water column, which was 5.43 pletion of photosynthetic products during the night.
during the spring tide and 14.18 during the neap tide. This
similarity indicates that the composition of nutrients in the 4.3 Seasonal and regional extrapolations
water column was closely related with biological processes
during both tidal periods, but the biological effect appeared This study was carried out in winter. Seasonal variation is
to be less evident during the spring tide as inferred from the present in the river discharge as inferred from precipitation
less significant correlations. The net release of nutrients dur- (Wang et al., 2005) and there might be an increase in the
ing the neap tide with a very Redfield-like ratio suggests that groundwater discharge and associated nutrient fluxes in sum-
the net nutrient fluxes in this system were likely to be domi- mer as in other coastal systems (e.g., Lewis, 1987; Costa
nated by the uptake and remineralization of plankton/oceanic et al., 2006; Kelly and Moran, 2002; Wang et al., 2015).
organic particles by benthic filter feeders as observed in other However, the relative changes in the groundwater discharge
reefs (e.g., Ayukai, 1995; Ribes et al., 2005; Southwell et al., and associated nutrient fluxes would be much smaller than
2008; Genin et al., 2009; Monismith et al., 2010). The net those of the river. The tidally driven feature of the ground-
uptake of nitrate and phosphate was mainly done by reef pri- water discharge in this reef system might make our conclu-
mary producers. Thus, the composition of nutrients in the sions applicable to other seasons. But it is likely that what
water column seemed to be directly related with biological we observed in a dry season might be different from what
contributions from the spring to neap tide. The biological in- would happen in a wet season due to the involvement of other
fluence was less dominant during the spring tide, most likely forces, e.g., upwelling in summer (Wu et al., 2012b; Wang
due to groundwater discharge. This confirms our proposal et al., 2016), which merits further studies.
that biological processes predominantly controlled the com- In relatively oligotrophic coastal systems with coral reefs,
position of nutrients in the reef system but that there was less such groundwater-associated nutrient fluxes may sustain the
of an impact due to groundwater discharge. reef community production (Cuet et al., 2011), result in
Successive uptake rates of NOx were approximated by the increases in diversity and occurrence of algae and sponge
depth integration of the biologically contributed NOx divided where relatively low salinity is present (Houk and Starmer,
by the sampling time interval from the spring to neap tide. 2010), or induce the proliferation of diatom and cyanobac-
Biogeosciences, 15, 997–1009, 2018 www.biogeosciences.net/15/997/2018/G. Wang et al.: Tidal variability of nutrients in a coastal coral reef system influenced by groundwater 1007
teria (Blanco et al., 2011). In addition, groundwater tidally and NOx during the neap tide when groundwater discharge
driven into nearshore ecosystems was found to be negatively was less prominent was comparable to the elemental ratio
correlated with seagrass habitat conditions (Houk et al., of diatoms. The release/consumption ratio of NOx : P by bi-
2013). Nutrient loads via groundwater discharge may af- ological processes followed a Redfield-like ratio during the
fect the community structure to move towards macroalgal neap tide but was about one-third as much during the spring
blooms via bottom-up control (Lapointe, 1997) and likely tide. Whether this change in the biological release/uptake ra-
play a role in the displacement of slow-growing benthic flora tio of NOx : P is associated with a change in the community
with fast-growing species observed in Sanya Bay in the last structure needs further study.
two decades (Titlyanov et al., 2015). Future changes in these
fluxes, likely caused by climate change and human activities,
might make the situation worse and need to be monitored in Data availability. All the original data used in this work are pro-
reef protection programs and be considered in assessing the vided either in Table 1 in the main text or in Table S1 in the Supple-
environmental health of coral reef systems, especially in re- ment.
gions with expected higher inputs of anthropogenic nutrients
into the groundwater.
The Supplement related to this article is available online
at https://doi.org/10.5194/bg-15-997-2018-supplement.
5 Conclusions
The variability of nutrients in a spring–neap tidal cycle in
a coral reef system in winter was revealed for the first time
under the synergistic control of tidally driven groundwater Author contributions. GW and MD wrote the main text of the
discharge and biological processes. The activity of 228 Ra was manuscript. GW, SW, ZW, WJ, YX, and ZZ collected samples in
significantly correlated with water depth and salinity, indicat- the field and measured the parameters. GW analyzed the data and
ing tidally driven groundwater discharge at this site. Nitrate did the calculations. ET drew some of the figures. WJ contributed
and phosphate were negatively correlated with salinity at the in the project design and implementation, but deceased before paper
ebb flow of the spring tide, indicating that groundwater dis- submission. We regard her approval to this work as implicit.
charge was enriched in nitrate and phosphate. Nitrate, phos-
phate, and silicate in the water column showed greater diur-
nal variation during the spring tide than during the neap tide, Competing interests. The authors declare that they have no conflict
of interest.
while the diel change in the concentration of nitrite demon-
strated no consistent pattern. The nutrient composition in the
water column seemed to differ between the spring tide and
Acknowledgements. We thank the crew of the ship QiongLinGao
neap tide but was similar to their biological uptake/release 02706 and Junde Dong for arranging local logistic support and
in either tidal period for oxidized nitrogen (NOx ) and phos- providing rainfall data. We appreciate the constructive comments
phate. This similarity indicates that variation in nutrients in from James Falter, Ramabadran Rengarajan, and one anonymous
the water column in the reef system was mainly regulated reviewer that have greatly improved the manuscript. This study
by biological processes. However, correlations between NOx was funded by MOST (2015CB954001) and the National Natural
and phosphate in the water column and between biologically Science Foundation of China (41576074). John Hodgkiss is
contributed NOx and phosphate were less significant during thanked for his assistance with English.
the spring tide when groundwater discharge was more promi-
nent. The concentration of silicate in the water column was Edited by: S.W.A. Naqvi
significantly correlated with that of NOx during the neap tide, Reviewed by: Ramabadran Rengarajan and one anonymous referee
but they were not significantly correlated during the spring
tide. This indicates that the composition of nutrients in the
water column was also affected by tidally driven groundwa-
ter discharge, especially during the spring tide. Therefore, References
biological processes predominantly controlled the composi-
Atkinson, M. J. and Smith, S. V.: C-N-P ratios of benthic marine
tion of nutrients in the reef system but that there was less of
plants, Limnol. Oceanogr., 28, 568–574, 1983.
an impact in the spring tide due to groundwater discharge. Ayukai, T.: Retention of phytoplankton and planktonic microbes on
The stoichiometric relationship of NOx and phosphate coral-reefs within the great-barrier-reef, australia, Coral Reefs,
from the spring to neap tide in this reef system is important 14, 141–147, 1995.
in understanding how biological processes predominantly af- Ban, S. S., Graham, N. A., and Connolly, S. R.: Evidence for multi-
fected these nutrients’ variation under the influence of tidally ple stressor interactions and effects on coral reefs, Glob. Change
driven groundwater discharge. The composition of silicate Biol., 20, 681–697, 2014.
www.biogeosciences.net/15/997/2018/ Biogeosciences, 15, 997–1009, 20181008 G. Wang et al.: Tidal variability of nutrients in a coastal coral reef system influenced by groundwater Blanco, A. C., Watanabe, A., Nadaoka, K., Motooka, S., Her- at Luhuitou fringing reef, Sanya Bay, China, Aquat. Ecosyst. rera, E. C., and Yamamoto, T.: Estimation of nearshore ground- Health, 15, 227–233, 2012. water discharge and its potential effects on a fringing coral reef, Monismith, S. G., Davis, K. A., Shellenbarger, G. G., Hench, J. L., Mar. Pollut. Bull., 62, 770–785, 2011. Nidzieko, N. J., Santoro, A. E., Reidenbach, M. A., Ros- Brzezinski, M. A.: The Si-C-N ratio of marine diatoms – interspe- man, J. H., Holtzman, R., Martens, C. S., Lindquist, N. L., South- cific variability and the effect of some environmental variables, well, M. W., and Genin, A. : Flow effects on benthic grazing J. Phycol., 21, 347–357, 1985. on phytoplankton by a Caribbean reef, Limnol. Oceanogr., 55, Burnett, W. C. and Dulaiova, H.: Estimating the dynamics of 1881–1892, 2010. groundwater input into the coastal zone via continuous radon- Moore, W. S.: Radium isotope measurements using germanium de- 222 measurements, J. Environ. Radioactiv., 69, 21–35, 2003. tectors, Nucl. Instrum. Methods, 223, 407–411, 1984. Costa Jr., O. S., Attrill, M. J., and Nimmo, M.: Seasonal and spa- Papritz, A. and Stein, A.: Spatial prediction by linear kriging, tial controls on the delivery of excess nutrients to nearshore and in: Spatial Statistics for Remote Sensing, Remote Sensing offshore coral reefs of Brazil, J. Marine Syst., 60, 63–74, 2006. and Digital Image Processing, Vol. 1, edited by: Stein, A., Cuet, P., Atkinson, M. J., Blanchot, J., Casareto, B. E., Cordier, E., Van der Meer, F., and Gorte, B., Springer, Dordrecht, Falter, J., Frouin, P., Fujimura, H., Pierret, C., Susuki, Y., and https://doi.org/10.1007/0-306-47647-9_6, 2002. Tourrand, C.: CNP budgets of a coral-dominated fringing reef at Paytan, A., Shellenbarger, G. G., Street, J. H., Gonneea, M. E., La Réunion, France: coupling of oceanic phosphate and ground- Davis, K., Young, M. B., and Moore, W. S.: Submarine ground- water nitrate, Coral Reefs, 30, 45–55, 2011. water discharge: an important source of new inorganic nitrogen D’Elia, C. F., Webb, K. L., and Porter, J. W.: Nitrate-rich ground- to coral reef ecosystems, Limnol. Oceanogr., 51, 343–348, 2006. water inputs to Discovery Bay, Jamaica: a significant source of Rama and Moore, W. S.: Using the radium quartet for evaluating N to local coral reefs, B. Mar. Sci., 31, 903–910, 1981. groundwater input and water exchange in salt marshes, Geochim. Dong, J.-D., Zhang, Y.-Y., Wang, Y. S., Wu, M.-L., Zhang, S., and Cosmochim. Ac., 60, 4645–4652, 1996. Cai, C.-H.: Chemometry use in the evaluation of the sanya bay Redfield, A. C.: The biological control of chemical factors in the water quality, Braz. J. Oceanogr., 58, 339–352, 2010. environment, Sci. Prog., 11, 150–170, 1960. Falter, J. L., Atkinson, M. J., and Merrifield, M. A.: Mass-transfer Ribes, M., Coma, R., Atkinson, M. J., and Kinzie, R. A.: Sponges limitation of nutrient uptake by a wave-dominated reef flat com- and ascidians control removal of particulate organic nitrogen munity, Limnol. Oceanogr., 49, 1820–1831, 2004. from coral reef water, Limnol. Oceanogr., 50, 1480–1489, 2005. Froelich, P. N., Bender, M. L., and Luedtke, N. A.: The marine phos- Santos, I. R., Erler, D., Tait, D., and Eyre, B. D.: Breathing of phorus cycle, Am. J. Sci., 282, 474–511, 1982. a coral cay: tracing tidally driven seawater recirculation in per- Genin, A., Monismith, S. G., Reidenbach, M. A., Yahel, G., and meable coral reef sediments, J. Geophys. Res., 115, C12010, Koseff, J. R.: Intense benthic grazing of phytoplankton in a coral https://doi.org/10.1029/2010JC006510, 2010. reef, Limnol. Oceanogr., 54, 938–951, 2009. Slomp, C. P. and Van Cappellen, P.: Nutrient inputs to the coastal Han, A. Q., Dai, M. H., Kao, S. J., Gan, J. P., Li, Q., Wang, L. F., ocean through submarine groundwater discharge: controls and Zhai, W. D., and Wang, L.: Nutrient dynamics and biological potential impact, J. Hydrol., 295, 64–86, 2004. consumption in a large continental shelf system under the in- Southwell, M. W., Weisz, J. B., Martens, C. S., and Lindquist, N.: In fluence of both a river plume and coastal upwelling, Limnol. situ fluxes of dissolved inorganic nitrogen from the sponge com- Oceanogr., 57, 486–502, 2012. munity on Conch Reef, Key Largo, Florida, Limnol. Oceanogr., Houk, P. and Starmer, J.: Constraints on the diversity and distribu- 53, 986–996, 2008. tion of coral-reef assemblages in the volcanic Northern Mariana Titlyanov, E. A. and Titlyanova, T. V.: Changes in the species com- Islands, Coral Reefs, 29, 59–70, 2010. position of benthic macroalgal communities of the upper subtidal Houk, P., Golbuu, Y., Gorong, B., Gorong, T., and Fillmed, C.: Wa- zone on a coral reef in Sanya Bay (Hainan Island, China) during tershed discharge patterns, secondary consumer abundances, and 2009–2012, Russ. J. Mar. Biol., 39, 413–419, 2013. seagrass habitat condition in Yap, Micronesia, Mar. Pollut. Bull., Titlyanov, E. A., Titlyanova, T. V., Li, X., Hansen, G. I., and 71, 209–215, 2013. Huang, H.: Seasonal changes in the intertidal algal communities Jickells, T. D.: Nutrient biogeochemistry of the coastal zone, Sci- of Sanya Bay (Hainan Island, China), J. Mar. Biol. Assoc. UK, ence, 281, 217–222, 1998. 94, 879–893, 2014. Kelly, R. P. and Moran, S. B.: Seasonal changes in groundwater Titlyanov, E. A., Titlyanova, T. V., Belous, O. S., and Kalita, T. L.: input to a well-mixed estuary estimated using radium isotopes Inventory change (1990s–2010s) in the marine flora of Sanya and implications for coastal nutrient budgets, Limnol. Oceanogr., Bay (Hainan Island, China), J. Mar. Biol. Assoc. UK, 95, 461– 47, 1796–1807, 2002. 470, 2015. Lapointe, B. E.: Nutrient thresholds for bottom-up control of van der Zee, C., Roevros, N., and Chou, L.: Phosphorus speciation, macroalgal blooms on coral reefs in Jamaica and southeast transformation and retention in the Scheldt estuary (Belgium/the Florida, Limnol. Oceanogr., 42, 1119–1131, 1997. Netherlands) from the freshwater tidal limits to the North Sea, Lewis, J. B.: Measurements of groundwater seepage flux onto Mar. Chem., 106, 76–91, 2007. a coral reef: spatial and temporal variations, Limnol. Oceanogr., Wang, G., Jing, W., Wang, S., Xu, Y., Wang, Z., Zhang, Z., Li, Q., 32, 1165–1169, 1987. and Dai, M.: Coastal acidification induced by tidal-driven sub- Li, X., Liu, S., Huang, H., Huang, L., Jing, Z., and Zhang, C.: marine groundwater discharge in a coastal coral reef system, En- Coral bleaching caused by an abnormal water temperature rise viron. Sci. Technol., 48, 13069–13075, 2014. Biogeosciences, 15, 997–1009, 2018 www.biogeosciences.net/15/997/2018/
G. Wang et al.: Tidal variability of nutrients in a coastal coral reef system influenced by groundwater                                1009

Wang, G., Wang, Z., Zhai, W., Moore, W. S., Li, Q., Yan, X., Qi, D.,    Wu, M.-L., Zhang, Y.-Y., Long, L.-J., Zhang, S., Wang, Y.-S.,
  and Jiang, Y.: Net subterranean estuarine export fluxes of dis-         Ling, J., and Dong, J.-D.: Identification of coastal water quality,
  solved inorganic C, N, P, Si, and total alkalinity into the Jiulong     including heavy metals, in the South China Sea, Pol. J. Environ.
  River estuary, China, Geochim. Cosmochim. Ac., 149, 103–114,            Stud., 21, 1445–1552, 2012b.
  2015.                                                                 Wyatt, A. S. J., Falter, J. L., Lowe, R. J., Humphries, S., and
Wang, G., Wang, S., and Wang, Z.: Significance of sub-                    Waite, A. M.: Oceanographic forcing of nutrient uptake and re-
  marine groundwater discharge in nutrients budget in                     lease over a fringing coral reef, Limnol. Oceanogr., 57, 401–419,
  tropical Sanya Bay, China, Sustainability, 10, 380,                     2012.
  https://doi.org/10.3390/su10020380, 2018.                             Zhang, J., Wang, D. R., Jennerjahn, T., and Dsikowitzky, L.: Land–
Wang, H., Dong, J., Wang, Y., Chen, G., and Zhang, Y.: Variations         sea interactions at the east coast of Hainan Island, South China
  of nutrient contents and their transportation estimate at Sanya         Sea: a synthesis, Cont. Shelf Res., 57, 132–142, 2013.
  Bay, J. Tropical Oceanogr., 25, 90–95, 2005.                          Zhang, Q.: On biogeomorphology of Luhuitou fringing reef of
Wang, Y., Jing, Z., and Qi, Y.: Coastal upwelling off eastern Hainan      Sanya city, Hainan Island, China, Chinese Sci Bull., 46, 97–101,
  Island observed in the summer of 2013, Chinese J. Tropical              2001.
  Oceanogr., 35, 40–49, 2016.                                           Zhao, M., Yu, K., Zhang, Q., Shi, Q., and Price, G. J.: Long-term
Wu, M.-L., Zhang, Y.-Y., Dong, J.-D., Wang, Y.-S., and Cai, C.-H.:        decline of a fringing coral reef in the northern South China Sea,
  Identification of coastal water quality by self-organizing map in       J. Coastal Res., 28, 1088–1099, 2012.
  Sanya Bay, South China Sea, Aquat. Ecosyst. Health, 14, 291–          Zhao, X., Zhang, J., and Li, G.: Development of the Holocene coral
  297, 2011.                                                              reefs along the southern coast of Hainan Island, Sci. Geol. Sinica,
Wu, M.-L., Ling, J., Long, L.-J., Zhang, S., Zhang, Y.-Y., Wang, Y.-      2, 150–160, 1983.
  S., and Dong, J.-D.: Influence of human activity and monsoon          Zhou, W., Li, T., Cai, C., Huang, L., Wang, H., Xu, J., Dong, J., and
  dynamics on spatial and temporal hydrochemistry in tropical             Zhang, S.: Spatial and temporal dynamics of phytoplankton and
  coastal waters (Sanya Bay, South China Sea), Chem. Ecol., 28,           bacterioplankton biomass in Sanya Bay, northern South China
  375–390, 2012c.                                                         Sea, J. Environ. Sci., 21, 595–603, 2009.
Wu, M.-L., Zhang, Y.-Y., Dong, J.-D., Cai, C.-H., Wang, Y.-S.,
  Long, L.-J., and Zhang, S.: Monsoon-driven dynamics of en-
  vironmental factors and phytoplankton in tropical Sanya Bay,
  South China Sea, Oceanol. Hydrobiol. St., 41, 57–66, 2012a.

www.biogeosciences.net/15/997/2018/                                                               Biogeosciences, 15, 997–1009, 2018
You can also read


