Proposed Organic Waste Composting and Pelletising/Pelleting Facility on Portion 13 of the Farm Boschkop 543 JR, Bronkhorstspruit, City of Tshwane ...
←
→
Page content transcription
If your browser does not render page correctly, please read the page content below
Proposed Organic Waste Composting and
Pelletising/Pelleting Facility on Portion 13 of the Farm
 Boschkop 543 JR, Bronkhorstspruit, City of Tshwane
                                                DWS (2016) risk assessment

                                                                   April 2021
                                                                    Drafted by
                                                          Limosella Consulting Pty Ltd
                                                            Reg No: 2014/023293/07
                                                        Email: antoinette@limosella.co.za
                                                              Cell: +27 83 4545 454
                                                               www.limosella.co.za

                                                                  Prepared for:
                                                              IQS Holdings (Pty) Ltd
                                                             Postal: P.O. Box 72216,
                                                         Lynnwood Ridge, Pretoria, 0040

                                                                  COPYRIGHT WARNING
 Copyright in all text and other matter, including the manner of presentation, is the exclusive property of the author. It is a criminal offence to reproduce
and/or use, without written consent, any matter, technical procedure and/or technique contained in this document. Criminal and civil proceedings will be
             taken as a matter of strict routine against any person and/or institution infringing the copyright of the author and/or proprietors.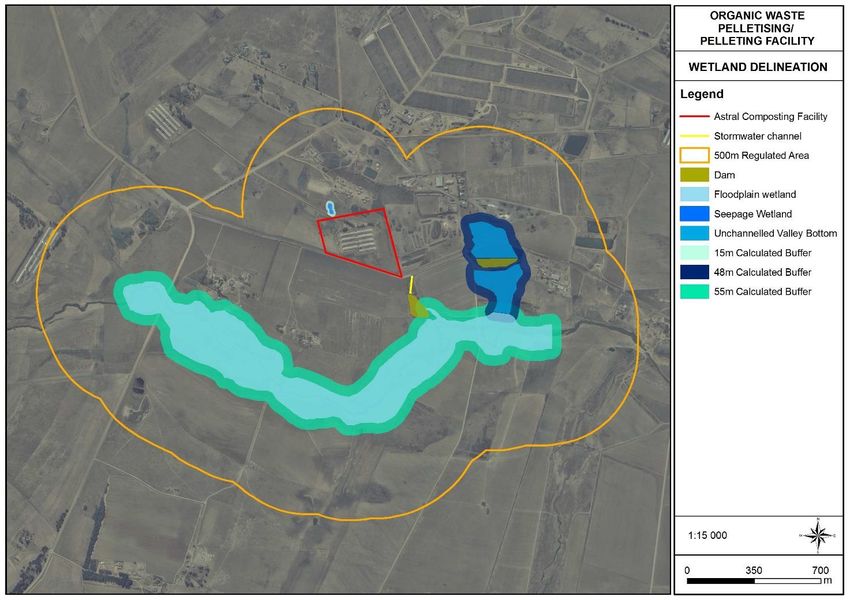
Proposed Organic Waste Composting and Pelletising/Pelleting Facility on Portion 13 of the Farm Boschkop
                             543 JR, Bronkhorstspruit, City of Tshwane                                     April 2021

        Declaration of Independence

        I, Antoinette Bootsma, in my capacity as a specialist consultant, hereby declare that I -

          • Act as an independent consultant;

          • Do not have any financial interest in the undertaking of the activity, other than remuneration
            for the work performed in terms of the National Environmental Management Act, 1998 (Act 107
            of 1998);

          • Undertake to disclose, to the competent authority, any material information that has or may
            have the potential to influence the decision of the competent authority or the objectivity of any
            report, plan or document required in terms of the National Environmental Management Act,
            1998 (Act 107 of 1998);

          • As a registered member of the South African Council for Natural Scientific Professions, will
            undertake my profession in accordance with the Code of Conduct of the Council, as well as any
            other societies to which I am a member; and

          • Based on information provided to me by the project proponent, and in addition to information
            obtained during the course of this study, have presented the results and conclusion within the
            associated document to the best of my professional judgement.

                ________________________                                              2021.04.12

               Antoinette Bootsma (PrSciNat)                                             Date

                        Ecologist/Botanist

                 SACNASP Reg. No. 400222-09

Indemnity

This report is based on survey and assessment techniques which are limited by time and budgetary
constraints relevant to the type and level of investigation undertaken. The findings, results, observations,
conclusions and recommendations given in this report are based on the author’s best scientific and
professional knowledge as well as available information at the time of study. Therefore, the author reserves
the right to modify aspects of the report including the recommendations if and when new information may
become available from ongoing research or further work in this field, or pertaining to this investigation.

Although the author exercises due care and diligence in rendering services and preparing documents, she
accepts no liability, and the client, by receiving this document, indemnifies the author against all actions,
claims, demands, losses, liabilities, costs, damages and expenses arising from or in connection with services
rendered, directly or indirectly by the author and by the use of this document.

                                                              2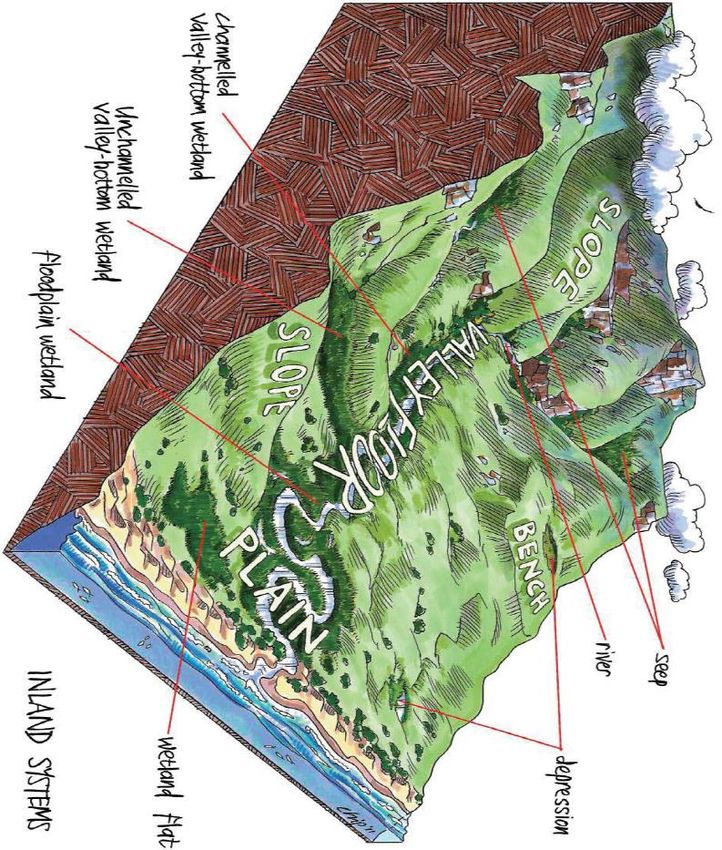
Proposed Organic Waste Composting and Pelletising/Pelleting Facility on Portion 13 of the Farm Boschkop
                            543 JR, Bronkhorstspruit, City of Tshwane                                          April 2021

Document and Quality Control:

 Project name: Proposed Organic Waste Composting and Pelletising/Pelleting Facility on Portion
              13 of the Farm Boschkop 543 JR, Bronkhorstspruit, City of Tshwane
                                           Responsible
      Nature of Signoff                                             Role/Responsibility                   Qualifications
                                            Person

                                                                                                 MSc Cum Laude, Unisa,
                                            Antoinette                 Senior Wetland
             Author                                                                              Environmental Science
                                            Bootsma                      Specialist
                                                                                                 Pr.Sci.Nat (400222/09)

                                              Rudi                                                   BSc Hons, Unisa
     Technical Reviewer                                              Wetland Specialist
                                        Bezuidenhoudt                                              Pr.Sci.Nat (008867)

                                                                          Electronic
     Document number                       Checked by:                                                        Date
                                                                         Signature:

                                            Antoinette
           Specialist                                                                                      2021.04.14
                                            Bootsma

         Client review

                                            Antoinette
         Final Report                                                                                      2021.04.20
                                            Bootsma

                                                             3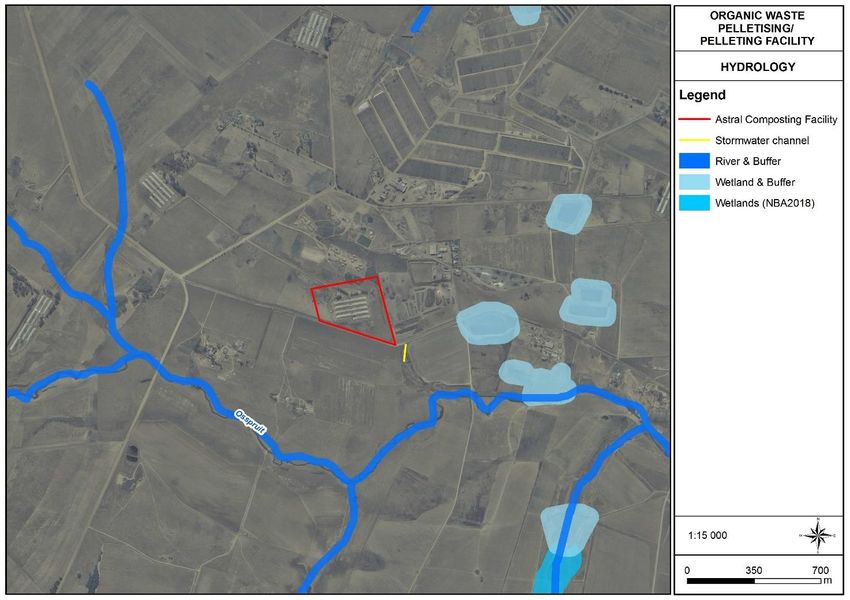
Proposed Organic Waste Composting and Pelletising/Pelleting Facility on Portion 13 of the Farm Boschkop
                             543 JR, Bronkhorstspruit, City of Tshwane                                                                       April 2021

       Table of Contents

  1            INTRODUCTION .................................................................................................................................. 6

   Assumptions and limitations .......................................................................................................................... 8

  2            METHODOLOGY .................................................................................................................................. 8

  3            DESCRIPTION OF ENVIRONMENT AND WATERCOURSES AFFECTED................................................ 10

         3.1       Delineated Watercourses............................................................................................................. 11

         3.2       Wetland Integrity and Function ................................................................................................... 14

         3.2.1         Present Ecological Status (PES) ................................................................................................ 14

         3.2.2         Ecosystem Services (ES) ........................................................................................................... 15

         3.2.3         Ecological Importance and Sensitivity (EIS) ............................................................................. 19

         3.2.4         Recommended Ecological Category (REC) ............................................................................... 19

   Recommended Ecological Category (REC) ................................................................................................... 19

         3.3       Summary of Findings .................................................................................................................... 19

  4            EXPECTED IMPACTS .......................................................................................................................... 22

  5            CONCLUSION .................................................................................................................................... 24

  I.           REFERENCES...................................................................................................................................... 25

  II.          APPENDIX A: Detailed methodology ................................................................................................ 26

   Watercourse Delineation ............................................................................................................................. 26

   Watercourse Classification .......................................................................................................................... 29

   Wetland Functionality, Status and Sensitivity ............................................................................................. 30

         Present Ecological Status (PES) – WET-Health ......................................................................................... 31

         Ecosystem Services .................................................................................................................................. 34

         Ecological Importance and Sensitivity (EIS) ............................................................................................. 35

         Recommended Ecological Category (REC) ............................................................................................... 37

  III.         APPENDIX B: Abbreviated Curriculum Vitae of the author .............................................................. 37

       Tables

Table 1: An extract from DWS (2016) indicating the risk scores and classes as well as the implication for the
appropriate authorization process .................................................................................................................... 9
                                                                                4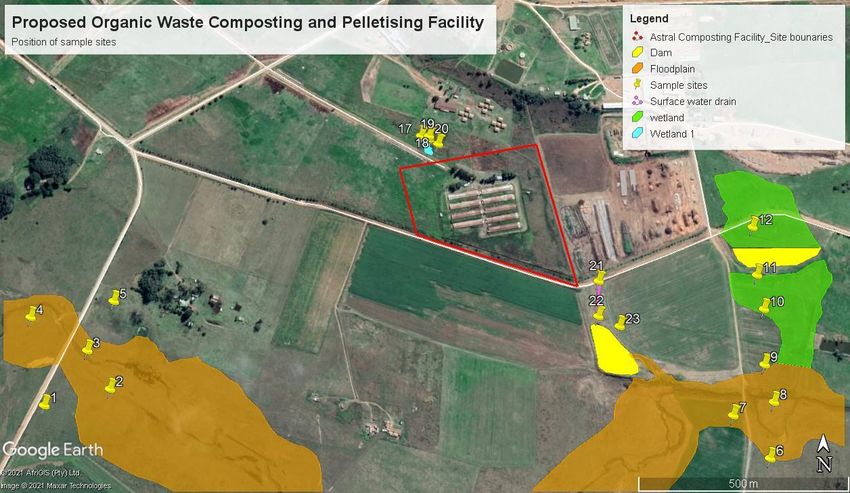
Proposed Organic Waste Composting and Pelletising/Pelleting Facility on Portion 13 of the Farm Boschkop
                              543 JR, Bronkhorstspruit, City of Tshwane                                                                                April 2021

Table 2: A summary of relevant site information obtained from a review of available spatial data .............. 10
Table 3: Summary of the results of the WetHealth (Version 2) assessment conducted for the floodplain
associated with the Osspruit............................................................................................................................ 14
Table 4: Summary of the results of the WetHealth (Version 2) assessment conducted for the Unchannelled
Valley Bottom................................................................................................................................................... 15
Table 5: Summary of the results of the WetHealth (Version 2) assessment conducted for the Seepage wetland
.......................................................................................................................................................................... 15
Table 6: Results and brief discussion of the Ecosystem Services provided by the Floodplain wetland .......... 16
Table 7: Results and brief discussion of the Ecosystem Services provided by the Valley Bottom wetland .... 17
Table 8: Results and brief discussion of the Ecosystem Services provided by the Seepage wetland ............. 18
Table 9: Summary of the ecosystem services scores to derive the EIS score .................................................. 19
Table 10: Summary of the ecosystem services scores to derive the EIS score ................................................ 19
Table 11: Summary of results for the wetland unit discussed......................................................................... 20
Table 12: The severity score derived from the DWS (2016) risk assessment matrix for the proposed organic
waste composting and pelletising facility ........................................................................................................ 23
Table 13: Wetland Types and descriptions ...................................................................................................... 29
Table 14: The three levels of assessment to cater for application of the WET-Health Version 2 Tool across
different spatial scales and for different purposes (Adapted from Macfarlane et al. 2020). ......................... 32
Table 15: Health categories used by WET-Health for describing the integrity of wetlands (Macfarlane et al,
2020) ................................................................................................................................................................ 33
Table 16: Trajectory class, change scores and symbols used to evaluate Trajectory of Change to wetland
health (Macfarlane et al, 2020) ....................................................................................................................... 33
Table 17: Integrating the scores for ecosystem supply and demand into an overall importance score. ........ 34
Table 18: Categories used for reporting the overall importance of ecosystem services. ............................... 35
Table 19: Environmental Importance and Sensitivity rating scale used for the estimation of EIS scores (DWAF,
1999) ................................................................................................................................................................ 36
Table 20: Generic Matrix for the determination of REC and RMO for water resources ................................. 37

     FIGURES
Figure 1: Locality of the study site ..................................................................................................................... 6
Figure 2: Regional hydrology relative to the study site ..................................................................................... 7
Figure 3: Delineated wetland with the DWS regulated area and calculated buffer zones relative to the study
site .................................................................................................................................................................... 12
Figure 4: The elevation profile of the site and upslope wetland ..................................................................... 13
Figure 5: The stormwater outlet and farm dam that receives runoff from the property adjacent to the study
site .................................................................................................................................................................... 13
Figure 6: Location of sample sites .................................................................................................................... 26
Figure 7: Typical cross section of a wetland (Ollis, 2013) ................................................................................ 27
Figure 8. Terrain units (DWAF, 2005)............................................................................................................... 28
Figure 9: Wetland Units based on hydrogeomorphic types (Ollis et al. 2013) ................................................ 28

                                                                                     5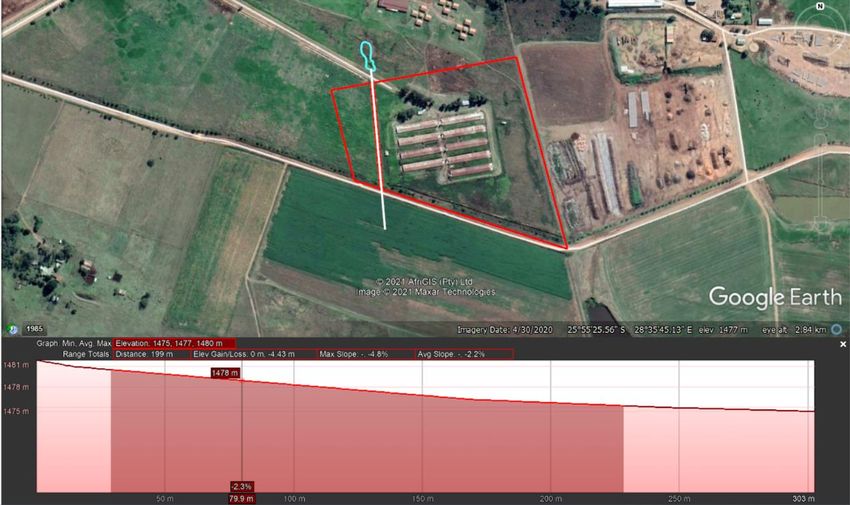
Proposed Organic Waste Composting and Pelletising/Pelleting Facility on Portion 13 of the Farm Boschkop
                             543 JR, Bronkhorstspruit, City of Tshwane                                     April 2021

     1 INTRODUCTION
Limosella Consulting was appointed by IQS Holdings (Pty) Ltd to undertake a wetland and/or riparian delineation
and functional assessment to inform authorization for the proposed establishment of an organic waste composting
and pelletising/pelleting facility. The site earmarked for the facility is located on Portion 13 of the Farm Boschkop
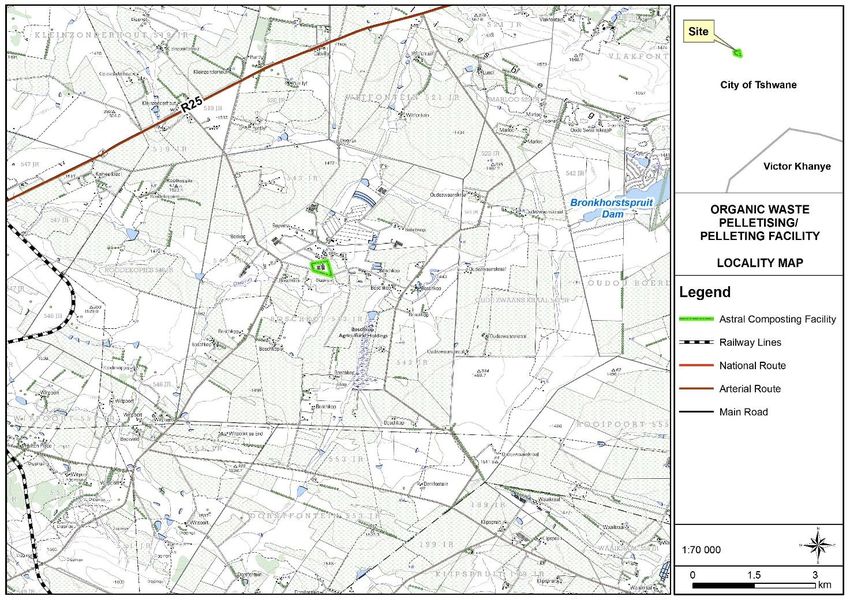
543 JR, southwest of Bronkhorstspruit, Gauteng Province. (Figure 1). This site forms part of the larger poultry farm
which is still active and has several chicken sheds. The chicken shed on the portion of the farm discussed in this
report is redundant but will remain in use (with necessary refurbishing) to house a pelletising/pelleting facility with
or without storage. The specialist input presented in this report is aimed at informing the licensing process of the
Department of Water and Sanitation (DWS).

Fieldwork was conducted in November 2020.

Figure 1: Locality of the study site

The site is situated in Quaternary Catchments C20C. In this catchment, the precipitation rate is lower than the
evaporation rate with a Mean Annual Precipitation (MAP) to Potential Evapotranspiration (PET) of 0.34. The
Median Annual Simulated Runoff (mm) is 47.9. Consequently, watercourses in these areas are sensitive to changes
in regional hydrology, particularly where their catchment becomes transformed and the water available to sustain
them becomes redirected.

                                                              6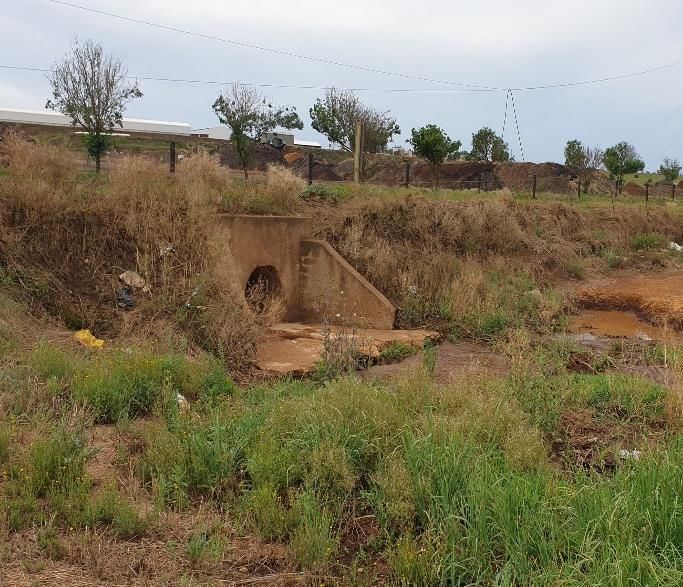
Proposed Organic Waste Composting and Pelletising/Pelleting Facility on Portion 13 of the Farm Boschkop
                             543 JR, Bronkhorstspruit, City of Tshwane                                     April 2021

Major rivers in this catchment include the Elands-, Wilge-, Steelpoort-, Olifants and Letaba Rivers. The Osspruit lies
within 500m (closest point is 330m) to the south of the site (Figure 2). This river drains to the east into the
Bronkhorstspruit Dam which feeds the Bronhkorspruit River which drains into the Wilge River. The Wilge River
confluences with the Olifants River. The wetland vegetation of the area is classified as Mesic Highveld Grassland
Group 3 (Driver et al, 2011).

Figure 2: Regional hydrology relative to the study site

The followings section is taken verbatim from the Section 21(c) and (i) Risk-based Assessment and Authorisation
document (hereafter referred to as DWS, 2016):

In terms of section 22 of the National Water Act (36 of 1998)(NWA) a person may only use water if it is
permissible under Schedule 1, a continuation of an ELU, a GA, a licence or the requirement for a licence has
been dispensed with under section 22(3). There are 11 different types of water uses contemplated in section
21, but the purpose of this Risk- Based Water Use Authorisation Guideline is to deal with section 21(c) and (i)
water uses only.

Water use in terms of section 21(c) and (i) of the NWA is:

    •   (c) impeding or diverting the flow of water in a watercourse; and
    •   (i) altering the bed, banks, course or characteristics of a watercourse.

However, unlike some water uses referred to in section 21, e.g. (a) and (b) which are consumptive and whose
impacts are usually clearly evident, easier to manage and quantifiable, section 21(c) and (i) water uses are
                                                     7
Proposed Organic Waste Composting and Pelletising/Pelleting Facility on Portion 13 of the Farm Boschkop
                             543 JR, Bronkhorstspruit, City of Tshwane                                     April 2021

non-consumptive and their impacts more difficult to detect and manage. They are also generally difficult to
clearly quantify. However, if left undetected these impacts can significantly change various attributes and
characteristics of a watercourse, and water resources, especially if left unmanaged and uncontrolled. Thus,
the risks posed by section 21(c) and (i) water uses on watercourses and water resources are an important
consideration during the authorisation of these water uses.

Assumptions and limitations
    •    This document is based on information as received by RQS Holdings (Pty) Ltd.
    •    The document takes into account likely impacts that can arise during the construction of the new
         structures including offices, services and upgraded access rods. However, some unique impacts may
         arise that must be recorded during monitoring and appropriate corrective actions taken.
    •    This report recognises that construction includes:
         -    Refurbishment of poultry sheds to accommodate the organic waste composting and
              pelletisng/pelleting facility;
         -    Site preparation for new infrastructure including compacting and levelling, infill and earthworks;
         -    Stormwater management during construction;
         -    Operation of an organic waste composting and pelletising/pelleting facility including
              management of polluted runoff and
         -    Maintenance.

     2            METHODOLOGY
Risk-based management has value in providing an indication of the potential for delegating certain categories
of water use “risks” to DWS regional offices (RO) or Catchment Management Agencies (CMA). Risk categories
obtained through this assessment serve as a guideline to establish the appropriate channel of authorisation
of these water uses.

The DWS has therefore developed a risk assessment matrix to assist in quantifying expected impacts. The
scores obtained in this assessment are useful in evaluating how the proposed activities should be authorised.

The formula used to derive a risk score is as follows:
RISK = CONSEQUENCE x LIKELIHOOD

CONSEQUENCE = SEVERITY + SPATIAL SCALE + DURATION

LIKELIHOOD = FREQUENCY OF THE ACTIVITY + FREQUENCY OF THE IMPACT +LEGAL ISSUES + DETECTION

Table 1 below provides a description of the classes into which scores are sorted, and their implication for
authorisation.

                                                              8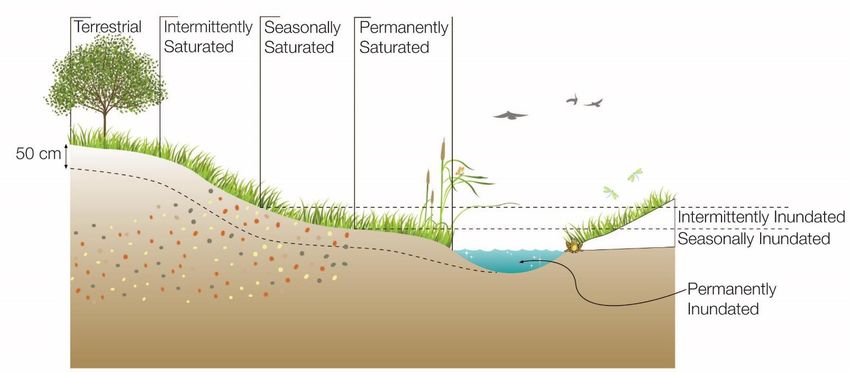
Proposed Organic Waste Composting and Pelletising/Pelleting Facility on Portion 13 of the Farm Boschkop
                             543 JR, Bronkhorstspruit, City of Tshwane                                     April 2021

Table 1: An extract from DWS (2016) indicating the risk scores and classes as well as the implication
for the appropriate authorization process

                                                              9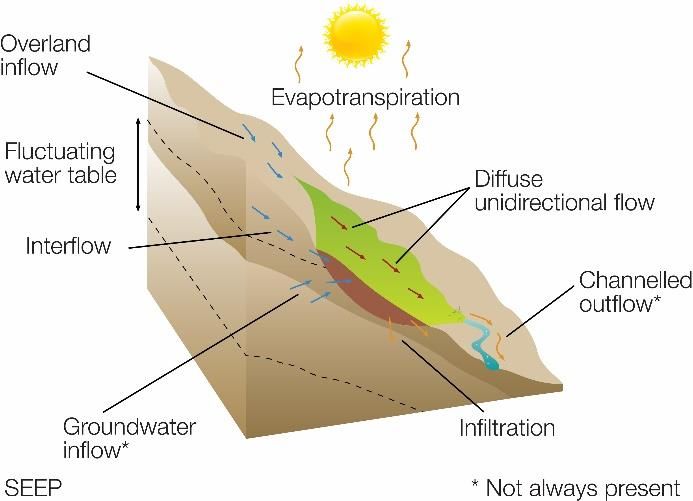
Proposed Organic Waste Composting and Pelletising/Pelleting Facility on Portion 13 of the Farm Boschkop
                             543 JR, Bronkhorstspruit, City of Tshwane                                     April 2021

     3            DESCRIPTION OF ENVIRONMENT AND WATERCOURSES AFFECTED
The study site lies in a rural agricultural setting with livestock operations, grazing and farm dams prevalent
in the region. Table 2 below provide s a summary of the relevant results of the literature review of available
information on regional biophysical characteristics.

Table 2: A summary of relevant site information obtained from a review of available spatial data
                            General Description (Mucina & Rutherford, 2006)

 GPS Coordinates                             25°55'21.33"S and 28°35'35.50"E

 Topography                                  Extensive sloping plains and a series of ridges

 Geology                                     Quartzite ridges of the Witwatersrand Supergroup and Pretoria Group

                                             Strongly seasonal summer rainfall, warm temperate region with very dry
 Climate
                                             winters, MAP: 654mm

 Broad Vegetation Units                      Rand Highveld Grassland, GM 11

 Conservation Status                         Endangered

                   Hydrology, National Freshwater Ecosystem Priority Area (NFEPA) (2011) Figure 2

                                             The Osspruit lies within 500m (closest point is 330 m) to the south of the
                                             site. This river drains to the east into the Bronkhorstspruit Dam which
 Important Rivers (CDSM, 1996)
                                             feeds the Bronhkorspruit River which drains into the Wilge River. The
                                             Wilge River confluences with the Olifants River.

 Quaternary Catchment                        B20C

 WMA (Government Gazette, 16                 Water Management Area 2, Olifants. Major rivers in this WMA include the
 September 2016)                             Elands-, Wilge-, Steelpoort-, Olifants and Letaba Rivers.

                                             Reach 1170 of the Osspruit River is listed as follows:

 DWAF (2014)                                       •    Present Ecological Status (PES): D - Moderate
                                                   •    Ecological Integrity (EI): High
                                                   •    Ecosystem Services (ES): High
 DEA Screening Tool                          The site and the 500m DWS regulated area is classified as Low sensitivity
 https://screening.environment.gov.za        in terms of the Aquatic Biodiversity Theme

 Wetland Ecosystem Type                      Mesic Highveld Grassland Group 4

                                                  •    Several artificial wetlands are shown to the north and east of the
 NFEPA Wetlands                                        site. They correspond to farm dams and WWTW with Rank 6
                                                       status which refers to wetlands with no know biodiversity
                                                       importance

                                                             10
Proposed Organic Waste Composting and Pelletising/Pelleting Facility on Portion 13 of the Farm Boschkop
543 JR, Bronkhorstspruit, City of Tshwane April 2021
• The reach of the Osspruit south of the site is listed in the NFEPA
NFEPA Rivers
dataset as having a Present Ecological Status (PES) of C:
Moderately Modified.
3.1 Delineated Watercourses
Soil and vegetation samples confirmed the presence of four wetland systems within 500m of the site (the
position of sample sites is presented in Appendix A). The extent of the wetlands and their associated
calculated buffer zones are shown in Figure 3. The Osspruit was classified as a floodplain wetland rather than
a riparian area due to the presence of cut-off meanders in a wide depositional valley, a feature characteristic
of floodplain wetlands (Ollis et al, 2013).
A small wetland (722 m2 or 0.1 Ha) dominated by Phragmites australis reeds and Imperata cylindrica grass
lies along the northern site boundary. It is possible that this wetland is artificial. Until such time as this
wetland can be shown to be driven by, for example, outflow from French drains, it is assumed to be natural
and is classified as a seepage wetland in this assessment. This wetland lies upslope from the site and is
unlikely to be affected by activities on the site. (Figure 4).
A moist area draining from the south eastern corner of the site into a farm dam was confirmed as an artificial
system with no wetland indicators. This stormwater drain conveys runoff from an adjacent property into a
farm dam (Figure 5). An unchanneled valley bottom wetland lies approximately 378m to the east of the site.
This wetland includes an artificial farm dam and drains into the Osspruit to the south.
Calculated buffer zones following the method set out in MacFarlane et al (2015) are as follows:
• Floodplain wetland – 55m
• Unchannelled Valley Bottom – 48m
• Seepage wetland – 15m
11Proposed Organic Waste Composting and Pelletising/Pelleting Facility on Portion 13 of the Farm Boschkop
543 JR, Bronkhorstspruit, City of Tshwane April 2021
Extent of
delineation
Figure 3: Delineated wetland with the DWS regulated area and calculated buffer zones relative to the
study site
12Proposed Organic Waste Composting and Pelletising/Pelleting Facility on Portion 13 of the Farm Boschkop
543 JR, Bronkhorstspruit, City of Tshwane April 2021
Figure 4: The elevation profile of the site and upslope wetland
Figure 5: The stormwater outlet and farm dam that receives runoff from the property adjacent to the
study site
13Proposed Organic Waste Composting and Pelletising/Pelleting Facility on Portion 13 of the Farm Boschkop
543 JR, Bronkhorstspruit, City of Tshwane April 2021
3.2 Wetland Integrity and Function
3.2.1 Present Ecological Status (PES)
In this section the results of the WET-Health (Version 2) assessment are presented following Macfarlane et al.
(2020). Primary impacts to the integrity of the wetlands associated with this site include an agricultural
catchment with impoundments and transformation of indigenous vegetation to pastures and fields. This
landuse is associated with changes to runoff, chemical and fertilisers and changed sediment balances.
The overall wetland health score for the floodplain wetland aggregates the scores for the four modules,
namely hydrology, geomorphology, water quality and vegetation (Table 2). The trajectory of change serves as
a prediction of the future status of the floodplain wetland. The PES scores for the seepage and unchanneled
valley bottom wetlands are shown in Tables 4 and 5.
A summary of the scores of each HGM unit is as follows:
• Floodplain wetland – C, Moderately modified. A moderate change in ecosystem processes and loss
of natural habitats has taken place but the natural habitat remains predominantly intact.
• Unchannelled valley bottom wetland – F, critically modified. The modifications have reached a critical
level and the ecosystem processes have been modified completely with an almost complete loss of
natural habitat and biota (Macfarlane et al. 2020).
• Seepage wetland - C, Moderately modified. A moderate change in ecosystem processes and loss of
natural habitats has taken place but the natural habitat remains predominantly intact.
Table 3: Summary of the results of the WetHealth (Version 2) assessment conducted for the floodplain associated with
the Osspruit.
HGM type Floodplain wetland
Wetland area (Ha) 48.6 Ha
PES Assessment Hydrology Geomorphology Water Quality Vegetation
Impact Score 3.3 2.8 4.7 4.2
PES Score (%) 67% 72% 53% 58%
Ecological Category C C D D
Trajectory of change ↓ → ↓ ↓
Confidence (revised results) Medium Medium Medium Medium
Combined Impact Score 3.7
Combined PES Score (%) 63%
Combined Ecological Category C
Hectare Equivalents 30.6 Ha
14Proposed Organic Waste Composting and Pelletising/Pelleting Facility on Portion 13 of the Farm Boschkop
543 JR, Bronkhorstspruit, City of Tshwane April 2021
Table 4: Summary of the results of the WetHealth (Version 2) assessment conducted for the Unchannelled Valley Bottom
HGM type Channelled VB wetland not laterally maintained
Wetland area (Ha) 7.7 Ha
PES Assessment Hydrology Geomorphology Water Quality Vegetation
Impact Score 8.0 4.0 6.6 10.0
PES Score (%) 20% 60% 34% 0%
Ecological Category E D E F
Trajectory of change ↓ ↓ ↓ →
Confidence (revised results) Medium Medium Medium Medium
Combined Impact Score 7.4
Combined PES Score (%) 26%
Combined Ecological Category E
Hectare Equivalents 2.0 Ha
Table 5: Summary of the results of the WetHealth (Version 2) assessment conducted for the Seepage wetland
HGM type Seep
Wetland area (Ha) 0.1 Ha
PES Assessment Hydrology Geomorphology Water Quality Vegetation
Impact Score 4.5 3.0 1.6 6.0
PES Score (%) 55% 70% 84% 40%
Ecological Category D C B E
Trajectory of change → → ↓ ↓
Confidence (revised results) Low Medium Medium Medium
Combined Impact Score 3.9
Combined PES Score (%) 61%
Combined Ecological Category C
Hectare Equivalents 0.1 Ha
3.2.2 Ecosystem Services (ES)
The ecosystem services provided by the wetlands are listed in Tables 6 to 8 below. The most important
ecosystem services provided by the floodplain and valley bottom wetland reflect the agricultural setting
include moderate to high scores for assimilation of phosphates and nitrated, trapping of sediment and
supporting biodiversity as well as providing cultivated foods (Kotze et al., 2020).
15Proposed Organic Waste Composting and Pelletising/Pelleting Facility on Portion 13 of the Farm Boschkop
543 JR, Bronkhorstspruit, City of Tshwane April 2021
Table 6: Results and brief discussion of the Ecosystem Services provided by the Floodplain wetland
Present State
Importance
ECOSYSTEM SERVICE Supply Demand Importance
Score
Flood attenuation 0.8 0.0 0.0 Very Low
REGULATING AND SUPPORTING SERVICES
Stream flow regulation 1.3 1.3 0.4 Very Low
Sediment trapping 2.8 2.0 2.3 Moderate
Erosion control 0.8 1.0 0.0 Very Low
Phosphate assimilation 2.8 2.0 2.3 Moderately High
Nitrate assimilation 2.5 2.0 2.0 Moderate
Toxicant assimilation 2.8 1.0 1.8 Moderate
Carbon storage 1.4 0.0 0.0 Very Low
Biodiversity maintenance 3.1 2.0 2.6 Moderately High
Water for human use 1.5 3.0 1.5 Moderately Low
PROVISIONING
SERVICES
Harvestable resources 2.5 0.0 1.0 Low
Food for livestock 2.0 1.3 1.2 Low
Cultivated foods 2.5 3.0 2.5 Moderately High
Tourism and Recreation 0.1 0.0 0.0 Very Low
CULTURAL
SERVICES
Education and Research 0.3 0.0 0.0 Very Low
Cultural and Spiritual 1.0 0.0 0.0 Very Low
16Proposed Organic Waste Composting and Pelletising/Pelleting Facility on Portion 13 of the Farm Boschkop
543 JR, Bronkhorstspruit, City of Tshwane April 2021
Table 7: Results and brief discussion of the Ecosystem Services provided by the Valley Bottom wetland
Present State
Importance
ECOSYSTEM SERVICE Supply Demand Importance
Score
Flood attenuation 0.3 0.0 0.0 Very Low
REGULATING AND SUPPORTING SERVICES
Stream flow regulation 0.5 0.0 0.0 Very Low
Sediment trapping 2.4 2.0 1.9 Moderate
Erosion control 0.3 0.7 0.0 Very Low
Phosphate assimilation 2.5 2.0 2.0 Moderate
Nitrate assimilation 2.1 2.0 1.6 Moderately Low
Toxicant assimilation 2.4 1.0 1.4 Moderately Low
Carbon storage 0.5 0.0 0.0 Very Low
Biodiversity maintenance 0.9 0.0 0.0 Very Low
Water for human use 1.0 2.0 0.5 Very Low
PROVISIONING
SERVICES
Harvestable resources 0.0 0.0 0.0 Very Low
Food for livestock 1.0 0.7 0.0 Very Low
Cultivated foods 3.0 0.7 1.8 Moderate
Tourism and Recreation 0.3 0.0 0.0 Very Low
CULTURAL
SERVICES
Education and Research 0.1 0.0 0.0 Very Low
Cultural and Spiritual 1.0 0.0 0.0 Very Low
17Proposed Organic Waste Composting and Pelletising/Pelleting Facility on Portion 13 of the Farm Boschkop
543 JR, Bronkhorstspruit, City of Tshwane April 2021
Table 8: Results and brief discussion of the Ecosystem Services provided by the Seepage wetland
Present State
Importance
ECOSYSTEM SERVICE Supply Demand Importance
Score
Flood attenuation 0.0 0.0 0.0 Very Low
REGULATING AND SUPPORTING SERVICES
Stream flow regulation 0.0 0.0 0.0 Very Low
Sediment trapping 0.8 0.0 0.0 Very Low
Erosion control 0.3 0.0 0.0 Very Low
Phosphate assimilation 0.8 0.0 0.0 Very Low
Nitrate assimilation 0.7 0.0 0.0 Very Low
Toxicant assimilation 0.8 0.0 0.0 Very Low
Carbon storage 1.1 0.0 0.0 Very Low
Biodiversity maintenance 0.3 0.0 0.0 Very Low
Water for human use 0.0 0.0 0.0 Very Low
PROVISIONING
SERVICES
Harvestable resources 0.0 0.0 0.0 Very Low
Food for livestock 0.0 0.0 0.0 Very Low
Cultivated foods 3.0 0.0 1.5 Moderately Low
Tourism and Recreation 0.0 0.0 0.0 Very Low
CULTURAL
SERVICES
Education and Research 0.0 0.0 0.0 Very Low
Cultural and Spiritual 0.0 0.0 0.0 Very Low
18Proposed Organic Waste Composting and Pelletising/Pelleting Facility on Portion 13 of the Farm Boschkop
543 JR, Bronkhorstspruit, City of Tshwane April 2021
3.2.3 Ecological Importance and Sensitivity (EIS)
Integrating the ecosystem service scores tabulated above to determine the ecological importance (EI)
category for the three wetland HGM units as proposed in Kotze et al., (2020) are reflected in Table 9 below.
Table 9: Summary of the ecosystem services scores to derive the EIS score
Ecosystem service group Floodplain Valley bottom Seep
Biodiversity maintenance 2.3 0 0
importance
Regulating services importance 1.2 0.6 0.4
Provisioning and cultural 0 0 0
services importance
EIS score 1.2 - Moderate 0.2 – Low/Marginal 0.1 – Low/Marginal
3.2.4 Recommended Ecological Category (REC)
Following Macfarlane et al. (2013) the REC is set at between C and D. A summary of the REC scores is
presented in Table 10 below. The development should aim to attain the recommended ecological category
by local improvement to the wetlands.
Table 10: Summary of the ecosystem services scores to derive the EIS score
Wetland Recommended Ecological Category (REC)
Floodplain (Osspruit) C
Valley Bottom D (lower scores are not considered sustainable)
Seep C
3.3 Summary of Findings
Table 11 provides a summary of the results recorded for the three wetland units in proximity to the proposed
facility.
19Proposed Organic Waste Composting and Pelletising/Pelleting Facility on Portion 13 of the Farm Boschkop
543 JR, Bronkhorstspruit, City of Tshwane April 2021
Table 11: Summary of results for the wetland unit discussed
Present Ecological Status (PES/EC) – WET-Health Macfarlane et al.,
(2020). – C, Moderately modified. A moderate change in ecosystem
processes and loss of natural habitats has taken place but the natural
habitat remains predominantly intact.
WetEcoServices (Kotze et al., 2020). Highest scores were obtained
for the services Phosphate assimilation, Biodiversity Maintenance,
Cultivate Foods – Moderately High
Floodplain (Osspruit) Ecological Importance and Sensitivity (derived from the ES scores) –
1.2, Moderate. Wetlands in this category are considered to be
ecologically important and sensitive on a provincial or local scale. The
biodiversity of these wetlands is not usually sensitive to flow and
habitat modifications. They play a small role in moderating the
quantity and quality of water in major rivers
Classification (SANBI, 2013)
Recommended Ecological Category (REC) Macfarlane et al., (2015) –
C
Calculated (Macfarlane et al., 2015) – 55m
Present Ecological Status (PES/EC) – WET-Health Macfarlane et al.,
(2020). – F, Critically modified. The modifications have reached a
critical level and the ecosystem processes have been modified
completely with an almost complete loss of natural habitat and biota
WetEcoServices (Kotze et al., 2020). Highest scores were achieved
for the services Sediment Control, Phosphate Assimilation, Cultivated
Foods, Moderate
Unchannelled Valley Ecological Importance and Sensitivity (derived from the ES
Bottom scores) - 0.2, Low/Marginal. Watercourses that fall in this category
are not ecologically important and sensitive at any scale. The
biodiversity of these watercourses is ubiquitous and not sensitive to
flow and habitat modifications. They play an insignificant role in
moderating the quantity and quality of water in major rivers (DWAF,
1999).
Recommended Ecological Category (REC) Macfarlane et al., (2015) –
D
Calculated (Macfarlane et al., 2015) – 48m
20Proposed Organic Waste Composting and Pelletising/Pelleting Facility on Portion 13 of the Farm Boschkop
543 JR, Bronkhorstspruit, City of Tshwane April 2021
Present Ecological Status (PES/EC) – WET-Health Macfarlane et al.,
(2020). – C, Moderately modified. A moderate change in ecosystem
processes and loss of natural habitats has taken place but the natural
habitat remains predominantly intact.
WetEcoServices (Kotze et al., 2020). Highest scores were achieved
for the service Cultivated Foods, (Moderately Low.
Ecological Importance and Sensitivity (derived from the ES
Seep
scores) – 0.1, Low/Marginal. Low/Marginal. Watercourses that
fall in this category are not ecologically important and sensitive at any
scale. The biodiversity of these watercourses is ubiquitous and not
sensitive to flow and habitat modifications. They play an insignificant
role in moderating the quantity and quality of water in major rivers
(DWAF, 1999).
Recommended Ecological Category (REC) Macfarlane et al., (2015)
–C
Calculated (Macfarlane et al., 2015) – 15m
21Proposed Organic Waste Composting and Pelletising/Pelleting Facility on Portion 13 of the Farm Boschkop
543 JR, Bronkhorstspruit, City of Tshwane April 2021
4 EXPECTED IMPACTS
An extract from the Risk Matrix spreadsheet presented in Table 12 below shows that the expected risk score
for the proposed organic waste composting and pelletising/pelleting facility. Expected impacts include the
potential release of polluted waste material in stormwater runoff that enter the downslope Osspruit. Current
stormwater infrastructure on the site (historically a poultry farm) includes trenches that drain to the south-
eastern section of the site. A formal stormwater management plan specific to the management of polluted
stormwater should be formulated based on empirical calculations of runoff generated by the proposed
composting facility. Since the effect of unintended spills from the proposed facility will significantly impact
on water quality in the Osspruit, the risk score falls in the Medium category and authorisation should proceed
through a Water Use Licence from the DWS.
22Proposed Organic Waste Composting and Pelletising/Pelleting Facility on Portion 13 of the Farm Boschkop
543 JR, Bronkhorstspruit, City of Tshwane April 2021
Table 12: The severity score derived from the DWS (2016) risk assessment matrix for the proposed organic waste composting and pelletising/pelleting facility
23Proposed Organic Waste Composting and Pelletising/Pelleting Facility on Portion 13 of the Farm Boschkop
543 JR, Bronkhorstspruit, City of Tshwane April 2021
5 CONCLUSION
Three wetlands occur in proximity to the proposed organic waste composting and pelletising/pelleting facility
although the wetlands and their calculated buffer zones do not encroach onto the site. Most likely to be
impacted is the Osspruit which lies approximately 258m south and downslope from the south-eastern corner
of the site. Natural slope and therefore drainage of stormwater runoff is also to the south-eastern corner of
the site.
Expected impacts include the potential release of polluted waste material in stormwater runoff that enters
the downslope Osspruit. Current stormwater infrastructure on the site (historically a poultry farm) includes
trenches that drain to the south-eastern section of the site. A formal stormwater management plan specific
to the management of polluted stormwater should be formulated based on empirical calculations of runoff
generated by the proposed composting facility. Since the effect of unintended spills from the proposed
facility will significantly impact on water quality in the Osspruit, the risk score falls in the Medium category
and authorisation should proceed through a Water Use Licence from the DWS.
Recommended mitigation measures include the following, amongst others:
• Design effective stormwater systems based on empirical calculations of runoff to ensure that no
pollutants enter the downslope watercourse during the operational phase;
• Ensure effective stormwater management and pollution control
• Standard best practice mitigation measures should be implemented during the construction phase;
• Measures should be put in place to prevent spills by for example constructing sumps or drains which
can contain any spills in order for contaminated water to be isolated from the watercourse and
removed from the site for appropriate disposal;
• Any spills should be cleared to ensure no release occurs into the watercourse;
• Independent water quality monitoring should be undertaken throughout the life of the operation;
24Proposed Organic Waste Composting and Pelletising/Pelleting Facility on Portion 13 of the Farm Boschkop
543 JR, Bronkhorstspruit, City of Tshwane April 2021
I. REFERENCES
Department of Water Affairs and Forestry (2008). Updated Manual for the identification and delineation of
wetlands and riparian areas. Department of Water affairs and Forestry. Pretoria. South Africa Second
Edition. September 2008.
Department of Water Affairs and Sanitation (2016) Risk-based Water Use Authorisation Approach and
Delegation Protocol for Section 21(c) and (i), Edition 02
Kotze, D., Macfarlane, D. & Edwards, R. (2020). WET-EcoServices (Version 2): A technique for rapidly
assessing ecosystem services supplied by wetlands and riparian areas. Final Report. WRC Project
K5/2737
Macfarlane D.M., Teixeira-Leite A., Goodman P., Bate G and Colvin C. (2015) Report on the Development of
a Method and Model for Buffer Zone Determination. Water Research Commission project K5/1789. The
Institute of Natural Resources and its Associates
Macfarlane, D.M., Ollis, D.J. & Kotze, D.C. (2020). WET-Health (Version 2.0): A Refined suite of tools for
assessing the present ecological state of wetland ecosystems – Technical Guide. WRC Report No. TT
820/20.
25Proposed Organic Waste Composting and Pelletising/Pelleting Facility on Portion 13 of the Farm Boschkop
543 JR, Bronkhorstspruit, City of Tshwane April 2021
II. APPENDIX A: Detailed methodology
Watercourse Delineation
The delineation of the watercourses presented in this report is based on both desktop delineation and
groundtruthing.
Desktop Delineation
A desktop assessment was conducted with wetland or riparian units potentially affected by the proposed
activities identified using a range of tools, including:
• 1: 50 000 topographical maps;
• S A Water Resources;
• Recent, relevant aerial and satellite imagery, including Google Earth.
All areas suspected of being wetland or riparian habitat based on the visual signatures on the digital base
maps were mapped using google earth.
Ground Truthing
General observation as well as detailed soil and vegetation sampling was undertaken at 20 sample sites as
shown in Figure 6 below.
Figure 6: Location of sample sites
26Proposed Organic Waste Composting and Pelletising/Pelleting Facility on Portion 13 of the Farm Boschkop
543 JR, Bronkhorstspruit, City of Tshwane April 2021
Wetlands were identified based on one or more of the following characteristic attributes (DWAF, 2005)
(Figure 7):
• The Terrain Unit Indicator helps to identify those parts of the landscape where wetlands are more
likely to occur;
• The presence of plants adapted to or tolerant of saturated soils (hydrophytes);
• Wetland (hydromorphic) soils that display characteristics resulting from prolonged saturation; and
• A high water table that results in saturation at or near the surface, leading to anaerobic conditions
developing within 50cm of the soil surface.
Figure 7: Typical cross section of a wetland (Ollis, 2013)
The Terrain Unit Indicator
The terrain unit indicator (Figure 8) is an important guide for identifying the parts of the landscape where
wetlands might possibly occur. Some wetlands occur on slopes higher up in the catchment where
groundwater discharge is taking place through seeps. An area with soil wetness and/or vegetation indicators,
but not displaying any of the topographical indicators should therefore not be excluded from being classified
as a wetland. The type of wetland which occurs on a specific topographical area in the landscape is described
using the Hydrogeomorphic classification which separates wetlands into ‘HGM’ units. The classification of
Ollis, et al. (2013) is used, where wetlands are classified on Level 4 as either Rivers, Floodplain wetlands,
Valley-bottom wetlands, Depressions, Seeps, or Flats (Figure 9).
27Proposed Organic Waste Composting and Pelletising/Pelleting Facility on Portion 13 of the Farm Boschkop
543 JR, Bronkhorstspruit, City of Tshwane April 2021
Figure 8. Terrain units (DWAF, 2005).
Figure 9: Wetland Units based on hydrogeomorphic types (Ollis et al. 2013)
28Proposed Organic Waste Composting and Pelletising/Pelleting Facility on Portion 13 of the Farm Boschkop
543 JR, Bronkhorstspruit, City of Tshwane April 2021
Watercourse Classification
The classification system developed for the National Wetlands Inventory is based on the principles of the
hydro-geomorphic (HGM) approach to wetland classification (SANBI, 2013). The current wetland study
follows the same approach by classifying wetlands in terms of a functional unit in line with a level three
category recognised in the classification system proposed in SANBI (2013). HGM units take into consideration
factors that determine the nature of water movement into, through and out of the wetland system. In general
HGM units encompass three key elements (Kotze et al, 2020):
• Geomorphic setting - This refers to the landform, its position in the landscape and how it evolved
(e.g. through the deposition of river borne sediment);
• Water source - There are usually several sources, although their relative contributions will vary
amongst wetlands, including precipitation, groundwater flow, stream flow, etc.; and
• Hydrodynamics - This refers to how water moves through the wetland.
The classification of wetland areas found within the study site and/or within 500 m of the study site (adapted
from Brinson, 1993; Kotze, 1999, Marneweck and Batchelor, 2002 and DWAF, 2005) are as follows (Table 13):
Table 13: Wetland Types and descriptions
Wetland Type: Description:
Meandering Floodplain Linear fluvial, net depositional valley bottom
surfaces which have a meandering channel
which develop upstream of a local (e.g.
resistant dyke or key point) base level, or close
to the mouth of the river (upstream of the
ultimate base level, the sea). The meandering
channel flows within an unconfined
depositional valley, and ox-bows or cut-off
meanders evidence of meandering – are usually
visible at the 1:10 000 scale (i.e. observable
from 1:10 000 orthomaps).
The floodplain surface usually slopes away from
the channel margins due to preferential
sediment deposition along the channel edges
and areas closest to the channel. This can result
in the formation of backwater swamps at the
edges of the floodplain margins.
29Proposed Organic Waste Composting and Pelletising/Pelleting Facility on Portion 13 of the Farm Boschkop
543 JR, Bronkhorstspruit, City of Tshwane April 2021
Wetland Type: Description:
Valley bottom without a channel
Linear fluvial, net depositional valley bottom
surfaces which do not have a channel. The
valley floor is a depositional environment
composed of fluvial or colluvial deposited
sediment. These systems tend to be found in
the upper catchment areas, or at tributary
junctions where the sediment from the
tributary smothers the main drainage line.
Seepage Wetlands Seepage wetlands are the most common type
of wetland (in number), but probably also the
most overlooked. These wetlands can be
located on the mid- and footslopes of hillsides;
either as isolated systems or connected to
downslope valley bottom weltands. They may
also occur fringing depressional pans. Seepages
occur where springs are decanting into the soil
profile near the surface, causing hydric
conditions to develop; or where through flow in
the soil profile is forced close to the surface due
to impervious layers (such as plinthite layers; or
where large outcrops of impervious rock force
subsurface water to the surface).
Wetland Functionality, Status and Sensitivity
Wetland functionality is defined as a measure of the deviation of wetland structure and function from its
natural reference condition. The natural reference condition is based on a theoretical undisturbed state
extrapolated from an understanding of undisturbed regional vegetation and hydrological conditions. In the
current assessment the hydrological, water quality, geomorphological and vegetation integrity was assessed
for the wetland unit associated with the study site, to provide a Present Ecological Status (PES) score
(Macfarlane et al., 2020) and an Environmental Importance and Sensitivity category (EIS) (Kotze et al, 2020).
These impacts are based on evidence observed during the field survey and land use changes visible on aerial
imagery including historical images.
The allocations of scores in the functional and integrity assessment are subjective and are thus vulnerable to
the interpretation of the specialist. Collection of empirical data is precluded at this level of investigation due
30Proposed Organic Waste Composting and Pelletising/Pelleting Facility on Portion 13 of the Farm Boschkop
543 JR, Bronkhorstspruit, City of Tshwane April 2021
to project constraints including time and budget. Water quality values, species richness and abundance
indices, surface and groundwater volumes, amongst others, should ideally be used rather than a subjective
scoring system such as is presented here.
The functional assessment methodologies presented below take into consideration subjective recorded
impacts to determine the scores attributed to each functional Hydrogeomorphic (HGM) wetland unit. The
aspect of wetland functionality and integrity that are predominantly addressed include hydrological and
geomorphological function (subjective observations) and the integrity of the biodiversity component (mainly
based on the theoretical intactness of natural vegetation) as directed by the assessment methodology.
In the current study the wetland was assessed using, WET-Health (Macfarlane et al., 2020), EIS and
WetEcoServices, (Kotze et al., 2020).
Present Ecological Status (PES) – WET-Health
A summary of the four components of the WET-Health (2.0) namely Hydrological; Geomorphological, water
quality and Vegetation Health assessment for the wetlands found on site is described in Table 14. For this
assessment, WET-Health Version 2.0 was used. This method builds on the WET-Health Version 1.0
(Macfarlane et al. 2008) and Wetland-IHI (DWAF 2007) Tool, offering a refined and more robust suite of tools
(Macfarlane et al. 2020). The WET-Health Version 2 considers four components to assess the PES of wetland
ecosystems. Geology, climate and topographic position determines the ecological setting of a wetland. Three
core interrelated drivers broadly influence all wetlands, namely Hydrology, Geomorphology and Water
Quality (i.e. physico-chemical attributes). Wetland biology, and more specifically vegetation, responds to the
changes in these drivers and to the surrounding environment. A level 2 assessment was used for the wetlands
recorded on the study site.
31Proposed Organic Waste Composting and Pelletising/Pelleting Facility on Portion 13 of the Farm Boschkop
543 JR, Bronkhorstspruit, City of Tshwane April 2021
Table 14: The three levels of assessment to cater for application of the WET-Health Version 2 Tool
across different spatial scales and for different purposes (Adapted from Macfarlane et al. 2020).
Level of
Spatial Scale Description
Assessment
• Entirely desktop-based and only uses pre-existing
landcover data.
• Landcover types within a buffer / “pseudo catchment”
Level 1A Desktop-based, low resolution around a wetland is used to determine the impacts on
the wetland arising from the upslope catchment.
• Impacts arising from within individual wetlands are
inferred from landcover types occurring within
desktop-delineated wetlands.
• Largely desktop-based using pre-existing landcover
data but makes a few finer distinctions than Level 1A in
terms of landcover types and usually requires "heads-
up" interpretation of the best available aerial imagery
in order to do so.
• Upslope catchment of each wetland can be individually
Level 1B Desktop-based, high resolution delineated at this level, and landcover in this area is
used as a proxy of the impacts on a wetland arising
from its upslope catchment.
• Impacts arising from within individual wetlands are
inferred from landcover types occurring within
desktop-delineated wetlands.
• In terms of water quality PES, the option is provided to
factor in point-source pollution inputs in a Level 1B
assessment.
• Strongly informed by desktop landcover mapping;
refined by assessing a range of catchment and wetland-
related indicators known to affect wetland condition.
• Impacts arising from the upslope catchment of a
wetland are inferred from landcover mapping but are
refined based on additional information.
• Landcover types occurring within the wetland are used
as the starting point for assessing human impacts
Level 2 Rapid field-based assessment arising from within the wetland but are refined through
the assessment of additional indicators as part of a
rapid field-based assessment. This involves sub-dividing
the wetland into relatively homogenous “disturbance
units” and assessing a suite of site-based wetland
questions that provide a more direct assessment of
change.
• Determination of water quality PES in a Level 2
assessment requires the identification and
characterisation of point-source pollution inputs.
32Proposed Organic Waste Composting and Pelletising/Pelleting Facility on Portion 13 of the Farm Boschkop
543 JR, Bronkhorstspruit, City of Tshwane April 2021
A summary of the change class, description and symbols used to evaluate wetland health are summarised in
Table 15. The trajectory of change is summarised in Table 16.
Table 15: Health categories used by WET-Health for describing the integrity of wetlands (Macfarlane
et al, 2020)
Ecological
Description Impact Score PES Score (%)
Category
A 0 to 0.9 90-00
Unmodified, natural
Largely Natural with few modifications. A slight change in
B 1.0 to 1.9 80-89
ecosystem processes is discernible and a small loss of natural
habitats and biota may have taken place.
Moderately Modified. A moderate change in ecosystem
C 2.0 to 3.9 60-79
processes and loss of natural habitats has taken place, but the
natural habitat remains predominantly intact.
D Largely Modified. A large change in ecosystem processes and loss 4.0 to 5.9 40-59
of natural habitat and biota has occurred.
Seriously Modified. The change in ecosystem processes and loss
E 6.0 to 7.9 20-39
of natural habitat and biota is great, but some remaining natural
habitat features are still recognizable.
Critical Modification. The modifications have reached a critical
F level and the ecosystem processes have been modified 8.0 to 10 0-19
completely with an almost complete loss of natural habitat and
biota.
Table 16: Trajectory class, change scores and symbols used to evaluate Trajectory of Change to wetland
health (Macfarlane et al, 2020)
Change Class Description Symbol
Likely to improve substantially over the next ↑↑
Improve markedly
5 years
Likely to improve slightly over the next 5 ↑
Improve
years
→
Remain stable Likely to remain stable over the next 5 years
Likely to deteriorate slightly over the next 5 ↓
Deteriorate slightly
years
↓↓
Deteriorate markedly Likely to deteriorate substantially
33Proposed Organic Waste Composting and Pelletising/Pelleting Facility on Portion 13 of the Farm Boschkop
543 JR, Bronkhorstspruit, City of Tshwane April 2021
Ecosystem Services
The Department of Water and Sanitation authorisations related to wetlands are regulated by Government
Notice 267 published in the Government Gazette 40713 of 24 March 2017 regarding Section 21(c) and (i).
Page 196 of this notice provides a detailed terms of reference for wetland assessment reports and includes
the requirement that the ecological integrity and function of wetlands be addressed.
WET-EcoServices Version 2 (Kotze, et al 2020) includes 16 different ecosystem services, which were
selected for their specific relevance to the South African situation:
• Flood attenuation
• Streamflow regulation
• Sediment trapping
• Phosphate assimilation
• Nitrate assimilation
• Toxicant assimilation
• Erosion control
• Carbon storage
• Biodiversity maintenance
• Provision of water for human use
• Provision of harvestable resources
• Food for livestock
• Provision of cultivated foods
• Cultural and spiritual experience
• Tourism and recreation
• Education and research
Table 17 and Table 18 describe the categories for integrating scores for supply and demand of ecosystem
services and their overall importance.
Table 17: Integrating the scores for ecosystem supply and demand into an overall importance score.
Integrating scores for supply & demand to obtain an overall importance score
Supply
Very Low Low Moderate High Very High
Demand 0 1 2 3 4
Very Low 0 0.0 0.0 0.5 1.5 2.5
Low 1 0.0 0.0 1.0 2.0 3.0
Moderate 2 0.0 0.5 1.5 2.5 3.5
High 3 0.0 1.0 2.0 3.0 4.0
Very High 4 0.5 1.5 2.5 3.5 4.0
34You can also read


