The performance of CERES-Barley and CERES-Wheat under various soil conditions and tillage practices in Central Europe
←
→
Page content transcription
If your browser does not render page correctly, please read the page content below
The performance of CERES-Barley and CERES-Wheat under
various soil conditions and tillage practices in Central Europe
         P. Hlavinka, M. Trnka, J. Eitzinger, V. Smutný, S. Thaler, Z. Žalud, P. Rischbeck and J. Křen

      Das Verhalten der Ertragsmodelle CERES-Barley und CERES-Wheat
       bei verschiedenen Böden und unterschiedlicher Bodenbearbeitung
                               in Mitteleuropa

1 Introduction                                                    tural potential within selected regions (AGGARWAL, 2000)
                                                                  or for crop yield forecasting (VAN DIEPEN, 1992; PERDIGÃO
Crop growth models have been used since the 1960s and are         and SUPPIT, 1999). Crop models can also provide useful es-
regarded as important tools of interdisciplinary research.        timates of the costs and benefits of agricultural practices,
They were designed as system algorithms on various bases          such as the sowing date, nitrogen fertilization time and
and have been widely used, e.g., for assessing the agricul-       amount, etc. (e.g., RINALDI, 2004). If weather data, based

                                                Zusammenfassung
  Wachstums- und Ertragsmodelle für Nutzpflanzen sind anerkannte Hilfsmittel zur Abschätzung des Pflanzenpro-
  duktionspotentials, zur Bestimmung des Klimawandeleinflusses und zur Analyse von Anpassungsmaßnahmen in der
  landwirtschaftlichen Pflanzenproduktion. Änderungen in der Produktionstechnik und in der Bodenbearbeitung zur
  Steigerung der Wasserversorgung der Nutzpflanzen gehören in diesem Zusammenhang zu den wichtigsten Anpas-
  sungsmaßnahmen in trockenen Regionen. Das Hauptziel dieser Studie war es, das Verhalten der validierten CERES
  (Crop-Environment Resource Synthesis) Wachstums- und Ertragsmodelle für Weizen und Gerste (CERES-Wheat
  und CERES-Barley) hinsichtlich des simulierten Ertrages und Bodenwassergehaltes mit konventioneller Bodenbear-
  beitung (Pflug) und Minimalbodenbearbeitung an zwei Standorten in Österreich und Tschechien im Vergleich zu
  Feldexperimenten zu testen. Zusätzlich wurden unter Einbeziehung von zwei weiteren Versuchstandorten verschie-
  dene Stickstoffdüngungsstufen mitberücksichtigt. Insbesondere auf Böden ohne Grundwassereinfluss wurden Ertrag,
  Korngewicht, Blüh- und Reifezeitpunkt zufriedenstellend simuliert (der mittlere Fehler (rMBE) lag beim simulierten
  Ertrag im Bereich von –19,6 % bis 13,4 %, beim Korngewicht zwischen 5,4 % bis 13,0 %, beim Blühzeitpunkt zwi-
  schen 0,8 % bis 3,0 % und beim Reifezeitpunkt zwischen –3,3 % bis 2,0 %). Die Biomasseakkumulation wurde an
  allen Standorten sehr gut simuliert (der Index der Simulationseffizienz lag zwischen 0,92 und 0,83). Beim Boden-
  wassergehalt lag rMBE zwischen –28,5 % und 0 % und die mittlere quadratische Abweichung (rRMSE) zwischen
  9,0 % und 31,2 % auf allen Standorten. Hier ist eine größere Schwankungsbreite erkennbar, der sich aus dem ver-
  einfachten Bodenwassersimulationsansatz der CERES-Modelle ergibt und die eine zufriedenstellende Funktionalität
  auf die eher frei dränenden Böden beschränkt. Zusammenfassend zeigen die Ergebnisse standortabhängige (bzw. bo-
  denspezifische) Unterschiede hinsichtlich des Einflusses unterschiedlicher Bodenbearbeitung, wobei zur Bewertung
  von Anpassungsmaßnahmen hinsichtlich der Bodenbearbeitung aber standortabhängige Unsicherheiten auftreten.
  Bezüglich der Bodenwasserhaushaltsmessungen und -simulationen lässt sich ableiten dass Minimalbodenbearbeitung
  auf den leichteren Böden (sandiger Lehm bzw. Löß des Marchfeldes) die Bodenwasserspeicherung durch dichtere La-
  gerung erhöht, während auf tonigen, dicht lagernden Böden (Fluvisol in Žabčice) eine Bodenlockerung durch den
  Pflug eine höhere Wasserspeicherung ermöglicht als Minimalbodenbearbeitung (allerdings nur unter Berücksichti-
  gung der kurzfristigen mechanischen Wirkung).
  Schlagworte: Minimalbodenbearbeitung, Pflügen, Anpassung an den Klimawandel.

Die Bodenkultur                                               5                                                  61 (1) 2010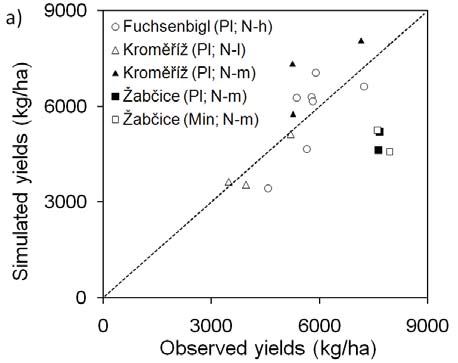
P. Hlavinka, M. Trnka, J. Eitzinger, V. Smutný, S. Thaler, Z. Žalud, P. Rischbeck and J. Křen

                                                              Summary
  Crop growth models are regarded as particularly useful tools for assessing plant production potentials, estimating the
  impact of climate change and analyzing the available adaptation options in agricultural crop production. Changes in
  management practices and tillage techniques that save water in the soil are among most frequently proposed adapta-
  tion measures in semi-arid areas. The main objective of the submitted study was to evaluate ability of two CERES
  (crop-environment resource synthesis) models (CERES-Barley and CERES-Wheat) to mimic the yields and soil water
  course under conventional (with ploughing) and minimum (without ploughing) tillage practices at two different
  locations (in the Czech Republic and Austria). Moreover, the behavior of the models under various management
  approaches (e.g., the fertilization level) and soil and climatic conditions within four sites in Central Europe was
  evaluated. Winter wheat and spring barley, the most important European cereal crops, were included. The yield level
  was successfully estimated (especially for soils without groundwater impact to the rooting zone) and the relative mean
  bias error (rMBE) varied from –19.6 % to 13.4 %. Consequently, the rMBE for the estimated seed weight varied from
  5.4 % to 13.0 %, the time of flowering from 0.8 % to 3.0 % and the time of maturity from –3.3 % to 2.0 %. The
  soil water dynamics were also simulated and the rMBE varied from –28.5 % to 0.0 % and the relative root mean square
  error (rRMSE) varied from 9.0 % to 31.2 % in all of the experiments. The above ground biomass accumulation was
  estimated quite well with a simulation efficiency index from 0.92 to 0.83. On the basis of achieved results it could be
  concluded that tested models provided reasonable estimates of included parameters but they could be used for analy-
  sis of adaptation measures (such as tillage approach) only with certain caution. From the soil water measurements and
  simulations, it could be concluded that minimum tillage leads to an increase of the soil water on the Chernozem of
  Raasdorf. On the other side, ploughing seems to provide slightly larger soil water reserves on the fluvisol of Žabčice
  compared to the applied reduced soil cultivation (where potential long term effects are still not established), probably
  as a consequence of the higher soil compaction in minimum tillage on clay soil.
  Key words: Minimum tillage, ploughing, climate change adaptation.

on future climate scenarios, are available, then growth mod-             (with ploughing) and minimum tillage (without plough-
els can be employed for a climate change impact assessment               ing) approaches could be considered as an acceptable clas-
(e.g., WOLF et al., 1996; ALEXANDROV and HOGGENBOOM,                     sification for the contemporary soil tillage approaches. Fur-
2000; IZAURRALDE et al., 2003). In spite of their rather                 thermore, the minimum tillage approach includes many
complex structure, these models represent only a simplified              variants with different depths, intensities and methods of
version of reality.                                                      loosening (e.g., shallow loosening or direct sowing without
   According to recent studies, Central Europe will most                 antecedent tillage). Minimum tillage methods have been
likely be confronted with more arid conditions as a conse-               intensively investigated worldwide since 1960. The research
quence of the changing climate (e.g., HLAVINKA et al.,                   is oriented mainly towards the effects on the soil properties,
2007; DUBROVSKÝ et al., 2009). To mitigate the negative ef-              crop development or economic aspects (SIJTSMA et al.,
fects of drought within plant production (QUIRING and PA-                1998). Generally, minimum tillage leads to the conserva-
PAKRYIAKOU, 2003; TRNKA et al., 2007; HLAVINKA et al.,                   tion of soil moisture (e.g., CANTERO-MARTINEZ et al.,
2009), appropriate adaptation measures, such as plant-                   2007; ŠÍP et al., 2009) due to the residues of the previous
breeding, irrigation or different crop rotation schemes, will            crop on the surface (mulch), higher occurrence of capillary
have to be taken. The increasing probability of drought                  pores and retention capacity. Moreover the tillage influ-
within the growing season has been one of the major con-                 ences soil biological activity, bulk density, soil compaction,
cerns of the farming community in Central Europe during                  soil temperature and erosion.
the last decade, so more suitable soil tillage and production               The monitoring of key canopy parameters in the early de-
methods have been a focus of research. In particular, the ef-            velopmental stages could also be useful. If the status of the
fects of soil cultivation on the soil water balance and crop             crop is closely monitored, then an appropriate management
growth are critical under increasing drought conditions.                 response can be taken (fertilization and/or irrigation oper-
   According to H LA et al. (2008), the conventional tillage             ation) and the adverse effects of weather conditions due to

Die Bodenkultur                                                      6                                                    61 (1) 2010
The performance of CERES-Barley and CERES-Wheat under various soil conditions and tillage practices in Central Europe
the lack in the key yield formation factors within each crop 2 Methodology
could be reduced. Even though field experiments are an in-
dispensable research tool, crop models could be used to test The performance of two CERES models, namely CERES-
some of the scenarios at a much lower cost. Barley (OTTER-NACKE et al., 1991) and CERES-Wheat
The main aim of this study was to evaluate the ability of (GODWIN et al., 1989), was examined in this study. They
two CERES (crop-environment resource synthesis) mod- are regarded as appropriate and widely used tools for the
els (CERES-Barley and CERES-Wheat) to estimate the simulation of the yield components, water balance, and
grain yield under different tillage techniques (the conven- other parameters within the crop-soil-atmosphere system
tional approach with ploughing versus minimum tillage (e.g., JONES et al., 2003; EITZINGER et al., 2004). The eval-
without ploughing) and management (fertilization level) uated models are from the process-oriented variety of crop
at selected locations in Central Europe. The ability of the models and operate within a DSSAT v4.0 framework (De-
models to mimic the tillage effects on soil water dynamics cision Support System for Agrotechnology Transfer). To
(as the underlying cause for the growth/yield) was also an- run the simulation successfully, the models require infor-
alyzed. Moreover, selected parameters of key importance, mation about the experiment itself (initial soil conditions,
such as the seed weight, time of flowering and maturity, sowing details, fertilizers used, irrigation, organic residues,
were modeled and measured across a range of sites. Atten- etc.), the daily weather (maximum and minimum temper-
tion was also paid to the above-ground biomass dynamics ature, solar radiation and precipitation, at least), the soil
estimates that have not been tested thus far for selected re- (chemical and physical properties for determined layers,
gional conditions and cultivars of winter wheat and spring etc.) and the cultivar specification (RINALDI, 2004). The
barley. models have a detailed soil water balance module and have
Figure 1: The location of four experimental sites included in the evaluation of the CERES-Barley and CERES-Wheat models. The altitude of
the analyzed territories is also shown in the picture (darker grey indicates higher altitudes).
Abbildung 1: Die Standorte der Feldexperimente zur Evaluierung des CERES-Wheat-/CERES-Barley-Modells. Die Seehöhe der jeweiligen Regio-
nen ist durch die Graustufen gekennzeichnet (dunkler bedeutet größere Seehöhe).
Die Bodenkultur 7 61 (1) 2010P. Hlavinka, M. Trnka, J. Eitzinger, V. Smutný, S. Thaler, Z. Žalud, P. Rischbeck and J. Křen
been previously used for Central European conditions (e.g., the rooting zone. The average temperature is 9.2 °C and the
EITZINGER et al., 2004). More details about CERES mod- average precipitation is 480 mm. The spring barley yields,
els construction and functioning could be found in litera- the time of flowering and maturity and the soil water
ture e.g. within JONES and KINIRY (1986), RITCHIE et al. content under two tillage regimes (with ploughing and
(1998) or TSUJI et al. (1998) (Figure 1). minimum tillage) from 2004 to 2005 were measured and
The experimental data used for the evaluation of the modeled. Fuchsenbigl (lat. 48.32°, long. 17.00°, elev. 149 m
models were derived from four experimental sites in the a.s.l.) is located in the Marchfeld region, which is one of the
Czech Republic and Austria (see Figure 1), where the field major field crop production areas in Austria. This region, lo-
trials were located. The overall climate of the area included cated in the northeastern part of the country, is influenced
in the study is influenced by the penetration and mingling by a semi-arid climate. The annual average temperature is
of ocean and continental effects. It is characterized by pre- around 9.8 °C, and the annual precipitation average is
vailing westerly and northwesterly winds, intensive cyclon- 550 mm. The soil type in the area of Fuchsenbigl is classi-
al activity causing frequent alterations of air masses and fied as Calcic chernozem. Explicitly, it is described as cher-
comparatively high precipitation. Kroměříž (lat. 49.30°, nozem on fine calcareous sediments over gravel and sand.
long. 17.38°, elev. 204 m above sea level (a.s.l.)) is located The soil type at this site is a loamy sand and sandy silt loam
in the fertile region in the middle of Moravia. For this area, with a very deep groundwater table (> 6 m), which is typical
the deep soil is typically based on huge loess. The soil type of the Marchfeld region (EITZINGER et al., 2003). The upper
is chernozem with a 155 cm effective soil depth. The aver- soil layer has a thickness of around 150 cm above the C-hori-
age annual temperature is 8.6 °C and the average precipita- zon of sand and gravel. The data (yields, time of flowering
tion is 599 mm. The winter wheat and spring barley field and maturity) for winter wheat from 1989 to 2005 (except
experiments (each with two fertilization levels) during three 2000) and for spring barley during the period from 1989 to
years (2005–2007) were included within the modeling 1995 were used within the study. Raasdorf (48.23°, long.
study. During these experiments, the yields, the weight of 16.55°, elev. 156 m a.s.l.) is also located within Marchfeld
one thousand seeds (TGW), the time of maturity and flow- region, approximately 13 kilometers northwest from Fuch-
ering and the above-ground biomass dynamics were ob- senbigl. The soil is Chernozem with 150 cm of effective
served and consequently simulated by the CERES-Wheat depth. The yields and soil water course within winter wheat
and CERES-Barley models. Žabčice (lat. 49.02°, long. cultivated by conventional and minimum tillage during the
16.62°, 179 m a.s.l.) is located within southern Moravia. year 2002 were included. An overview of the field trial peri-
There is heavy soil, namely Gley Fluvisol, with a 105 cm ef- ods, cultivated plants, and tillage and fertilizer levels is pro-
fective soil depth and an occasional rise of groundwater to vided in Table 1, where the examined parameters are listed.
Table 1: An overview of the experiments and measured parameters included within the study (Abbreviations: WW – winter wheat, SB – spring
barley, Pl – ploughing, Min – minimum tillage, N-l – low-nitrogen fertilization, N-m – medium-nitrogen fert., N-h – higher-nitrogen
fert., MAT – maturity date, FLOW – flowering date, TGW – weight of one thousand seeds)
Tabelle 1: Übersicht der in der Studie verwendeten Feldexperimente und gemessenen Parameter (Abkürzungen: WW – Winterweizen, SB – Som-
mergerste, Pl – Pflugbearbeitung, Min –Minimalbodenbearbeitung, N-1 – geringe N-Düngung, N-m – mittlere N-Düngung, N-h – hohe
N-Düngung, MAT – Reifedatum, FLOW – Blühzeitpunkt, TGW – Tausendkorngewicht)
Experiment duration
Observed
Locality: Soil: Crop: Tech:
1989
1990
1991
1992
1993
1994
1995
1996
1997
1998
1999
2000
2001
2002
2003
2004
2005
2006
2007
characteristics
Calcic WW Pl; N-h
Fuchsenbigl Yields, MAT, FLOW
chernozem SB Pl; N-h
WW Pl; N-h
Raasdorf Chernozem Soil water, Yields
WW Min; N-h
Gley SB Pl; N-m Soil water, Yields,
Žab
Žabčice
ice
Fluvisoil SB Min; N-m MAT, FLOW
WW Pl; N-m
WW Pl; N-h Soil water, Yields,
Kroměříž
Kromíž Chernozem MAT, FLOW,
SB Pl; N-l biomass, TGW
SB Pl; N-m
Die Bodenkultur 8 61 (1) 2010The performance of CERES-Barley and CERES-Wheat under various soil conditions and tillage practices in Central Europe
There were two basic tillage approaches within the exper- TRNKA et al. (2004 b) applied an analogous procedure for the
iments: i) field trials under conventional tillage with medi- CERES-Wheat calibration and evaluation. In this case, the
um-depth ploughing (depth 0.18–0.24 m), abbreviated as winter wheat was represented by the cultivar Hana. The
“Pl”, and ii) the minimum tillage approach, marked as evaluation database originated from a range of field experi-
“Min”. Minimum tillage in Raasdorf was carried out by the ments throughout the Czech Republic and the model was
direct sowing into non-prepared soil; in Žabčice, it was able to explain over 53 % of the yield variability and 65 % of
characterized by the soil loosening of up to 15 cm depth the inter-seasonal variability of observed phenological stages.
(without ploughing) performed within experimental plots In 71 out of 83 seasons, the difference between the simulat-
continuously from the year 2003. Three basic fertilization ed and observed grain yields was smaller than 20 %.
levels were utilized throughout the experiments: “N-l” was RISCHBECK (2007) calibrated the winter wheat cultivar
a very low or zero nitrogen application, “N-m” was a medi- “Capo” and spring barley cultivar “Magda” using pheno-
um nitrogen application within the range of 40–60 kg/ha, logical and yield data series from the Fuchsenbigl experi-
and “N-h” was a higher nitrogen application within the mental site. The difference between the simulated and
range of 120–160 kg/ha. observed dates of anthesis and physiological maturity of
To determine the above-ground biomass accumulation, winter wheat for the calibration varied between 0 to 4 d.
the plants (the portion above ground) from a square of The simulated grain yields mostly agreed with the measured
0.5 ⫻ 0.5 m were cut and dried (a heat air oven with a tem- data (R² = 0.61; RMSE = 591 kg ha–1) and the deviation in
perature of 80 °C was used up to a constant weight) at the the annual yield predictions was below 20 %. The spring
Kroměříž experimental site. Consequently, the dry materi- barley was calibrated in the same way. The difference be-
al was weighed and recalculated for the corresponding area. tween the simulated and observed anthesis as well as phys-
The above-ground biomass was measured several times iological maturity varied between 0 and 7 d; the simulated
(four times for the winter wheat and three times for the yield was within 20 % of the measured values for each year
spring barley) per vegetation season. (R² = 0.57; RMSE = 623 kg ha–1).
The soil water content was measured continuously by The different tillage approaches were defined by modifying
time domain reflectometry (TDR) probes at 0.2 m, 0.4 m the soil properties (water contents at field capacity and wilt-
and 0.6 m depth intervals in Raasdorf and at depths of ing point, bulk density and root weighting factor) in the
0.1 m, 0.3 m and 0.5 m in Žabčice. upper layers (CASTRIGNANÒ et al., 1997; OSUNBITAN et al.,
All of the CERES-Wheat and CERES-Barley runs as- 2005) based on measurements or estimations. The relative
sumed a 350 ppm concentration of CO2 in the atmosphere. changes of water contents at wilting point and field capacity
For the analyses within Kroměříž and Žabčice, the model for minimum tillage (against ploughing) used as input for
cultivars “Akcent” (spring barley) and “Hana” (Winter models are listed in Table 2. The mentioned parameters were
wheat) were adopted as calibrated by TRNKA et al. defined within the CERES-Wheat and CERES-Barley soil
(2004 a, b). The winter wheat cultivar “Capo” and spring files. In addition, these models use the hydraulic conductivi-
barley cultivar “Magda” were used within the Austrian ex- ty for each defined layer as input. Unfortunately this para-
periments as calibrated by RISCHBECK (2007).
The cultivar Akcent for CERES-Barley model was pro- Table 2: The relative changes (in %) of water contents at wilting point
perly calibrated and successfully verified by TRNKA et al. (WP) and field capacity (FC) for minimum tillage (against
ploughing) used as input for CERES models
(2004 a) for the conditions in Central Europe. Within these Tabelle 2: Der relative Unterschied (in %) der Bodenwassergehalte am
processes the basic observed characteristics (about the crop Welkepunkt (WP) und an der Feldkapazität (FK) der Mini-
canopies) were used (e.g., key phenological stages, grain dry malbodenbearbeitungsvariante zur Pflugvariante als Eingabe-
matter, weight of a single kernel, number of productive tillers parameter in die CERES-Modelle
and N content at maturity), while a range of others (e.g., LAI Žabčice 2004 Žabčice 2005 Raasdorf 2002
(Leaf Area Index), above-ground biomass or soil moisture dy- Depth in cm WP FC WP FC WP FC
namics) were not included in the evaluation process. The 0–30 –9.3 +1.4 –7.0 +3.0 +22.7 +25.5
study showed that the model performed quite well and was 30–90 –0.9 +2.7 +8.4 +7.9 0.0 +15.1
able to explain 83 % of the experimental yield variability. The 90–105
estimated time of flowering and maturity were also verified (90–150 0.0 0.0 0.0 0.0 0.0 0.0
for Raasdorf )
and 80 % of their inter-seasonal variability was explained.
Die Bodenkultur 9 61 (1) 2010P. Hlavinka, M. Trnka, J. Eitzinger, V. Smutný, S. Thaler, Z. Žalud, P. Rischbeck and J. Křen
meter wasn’t measured within the included experiments so it
was defined as unknown. Moreover, the tillage depths (0.22 m
for ploughing and 0.15 m for soil loosening) were defined in
the CERES-Wheat and CERES-Barley experimental setup.
The chisel plow setting was used within the simulations (both
for ploughing and soil loosening) because no effect of the
various tillage implements proposed by CERES models with-
in simulated variables (e.g. actual evapotranspiration, soil
moisture or biomass accumulation) was detected.
All of the evaluated parameters were examined with the
help of descriptive statistics and by using Pearson correlation
coefficients (r). The root mean square error (RMSE) as a
parameter of random error and mean bias error (MBE) as an
indicator of systematic error (DAVIES and MCKAY 1989) were
employed. Its relative values (rMBE and rRMSE in %) were
determined as the ratio of the appropriate value of the MBE
or RMSE and the mean of measured parameter during the
given time period. Within the biomass accumulation and soil
water content simulations, the modeling efficiency index
(MEI) according to WILMOT (1982) was used. This index
results in a number between 0 and 1 (higher values indicate
a better fit between the model and field observations). The
MEI refers to the accuracy of predictions, where accuracy is
regarded as the degree to which model predictions approach
the magnitude of their observed counterparts.
3 Results and Discussion
3.1 Grain yield, time of flowering and maturity,
above-ground biomass
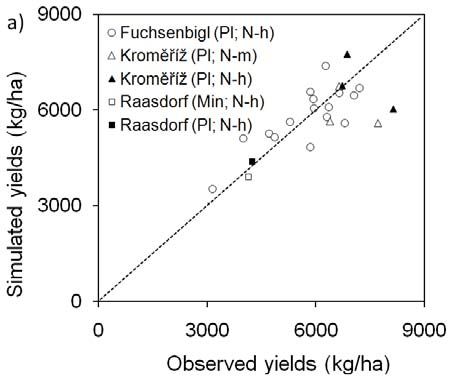
Generally the yields of spring barley were simulated success-
fully and the results of the CERES-Barley reflected the dif-
ferences across the stations and years well (see Figure 2a). The
rMBE varied from –19.6 % to 37.0 % and the rRMSE var-
ied from 6.3 % to 37.5 % (see Figure 7, 8). There was a slight
overestimation within the Kroměříž station (when a medium
amount of nitrogen was used as fertilizer). This is in agree-
ment with the widely accepted fact that crop models do not
account for a range of some stress factors (e.g., lodging, pest
and diseases) and they generally overestimate the production.
The highest bias was obtained for Žabčice, where the model
significantly underestimated the real spring barley yields Figure 2: The evaluation of the CERES-Barley model’s ability to
(both for experiments with ploughing and minimum tillage). simulate the (a) yields, (b) time of flowering and (c)
maturity. The dotted line expresses the 1:1 trend.
This could be explained by the occasional presence of Abbildung 2: Evaluierung des CERES-Barley-Modells hinsichtlich si-
groundwater in the rooting zone during vegetation, which mulierter (a) Erträge, (b) Blühzeitpunkte und (c) Reife-
mitigated water stress and was not considered by the model. zeitpunkte. Die punktierte Linie zeigt das 1:1-Verhältnis.
Die Bodenkultur 10 61 (1) 2010The performance of CERES-Barley and CERES-Wheat under various soil conditions and tillage practices in Central Europe
The CERES-Wheat provided rather reliable estimates of
the grain yields through all of the included experiments
(rMBE varied from –3.0 % to 13.4 % and the rRMSE var-
ied from 3.0 % to 18.8 %), as presented within Figure 3a.
There was a higher scatter and a slight tendency to under-
estimate the production at Kroměříž (especially within
N-m fertilization level). The CERES-Wheat also success-
fully reproduced the winter wheat yields after the different
tillage used at Raasdorf during the year 2002. The higher
yield was measured after ploughing (4,243 kg/ha) against
the yield after the minimum tillage (4,139 kg/ha).
The same trend was reproduced by the tested model
(4,371 kg/ha after ploughing and 3,890 kg/ha after mini-
mum tillage).
On the other hand, the CERES-Barley model was not
able to reproduce the yield differences of the spring barley
after different tillage at Žabčice. The observed yield after
minimum tillage (7,940 kg/ha) was higher than the yield
measured after ploughing (7,630 kg/ha) during 2004
and a slightly higher yield was observed after ploughing
(7,670 kg/ha) compared to the yield measured after
the minimum tillage (7,620 kg/ha) during 2005. The
CERES-Barley model did not reproduce these trends
within the analyzed years (for more detail see Figure 2a
and Table 3). This could be caused by the minimal differ-
ences in the properties of soil after the ploughing and min-
imum tillage.
The dates of flowering and maturity were modeled with
very satisfactory results for both plants (see Figure 2b–c
and Figure 3b–c) within all the experiments of studied (the
rMBE varied from –3.3 % to 3.0 % and the rRMSE var-
ied from 1.3 % to 6 %). This high accuracy of the CERES-
Wheat and CERES-Barley models has already been estab-
lished by previous works (e.g., TRNKA et al. 2004 a, b).
Consequently, the above-ground biomass measurements
were compared with the CERES-Wheat and CERES-Bar-
ley estimates that have not been tested so far for selected re-
gional conditions and cultivars. Both models provided very
satisfactory results through the various fertilization levels,
as is apparent from Figure 4a–d. The MEI in all cases var-
ied from 0.92 to 0.83 and the r varied from 0.97 to 0.99.
The rMBE varied from –22.4 % to 11.7 % and rRMSE
varied from 20.3 % to 35.9 %. The relatively large bias in
Figure 3: The validation of the CERES-Wheat model’s ability to si- terms of the rRMSE parameter is a consequence of its con-
mulate the (a) yields, (b) time of flowering and (c) matu- struction in connection with amplitude of evaluated para-
rity. The dotted line expresses the 1:1 trend.
Abbildung 3: Evaluierung des CERES-Wheat-Modells hinsichtlich si- meter.
mulierter (a) Erträge, (b) Blühzeitpunkte und (c) Reife-
zeitpunkte. Die punktierte Linie zeigt das 1:1-Verhältnis.
Die Bodenkultur 11 61 (1) 2010P. Hlavinka, M. Trnka, J. Eitzinger, V. Smutný, S. Thaler, Z. Žalud, P. Rischbeck and J. Křen
Figure 4: The evaluation of the CERES-Wheat and CERES-Barley models’ ability to simulate the above-ground biomass of winter wheat (a, b)
and spring barley (c, d) in Kroměříž where medium (a, d), high (b) and low (c) nitrogen fertilization levels were used. The above-gro-
und biomass was analyzed three or four times during the vegetation season. The results for the years 2005, 2006 and 2007 are distin-
guished within the chart. The dotted line expresses the 1:1 trend.
Abbildung 4: Evaluierung des CERES-Wheat-/CERES-Barley-Modells hinsichtlich simulierter überirdischer Trockenmasse bei Winterweizen (a,b)
und Sommergerste (c, d) in Kroměříž unter Berücksichtigung von mittlerer (a,d), hoher (b) und geringer (c) N-Düngung. Die ober-
irdische Trockenmasse wurde drei- bis viermal in der Vegetationsperiode erhoben. Die Ergebnisse der Jahre 2005, 2006 und 2007 sind
in der Abbildung unterschiedlich dargestellt. Die punktierte Linie zeigt das 1:1-Verhältnis.
3.2 Simulation of soil water content rRMSE = 9.87 %). EITZINGER et al. (2004), however, re-
vealed a higher accuracy for this particular crop model with
The evaluation of the soil water content estimates was con- the rRMSE for the spring barley ranging between 0.71 %
ducted at Žabčice (during 2004 and 2005) and within the and 4.67 %. The results for the winter wheat at Raasdorf
Raasdorf station (during 2002), where TDR (Time Do- (cultivated during the 2002) showed a much higher level of
main Reflectometry) measurements were taken under the systematic bias (plough: MEI = 0.51, rMBE = –28.54 %,
conventional and minimum tillage. The modeled and mea- rRMSE = 31.20 %; minimum tillage MEI = 0.11, rMBE =
sured day-by-day soil water contents within the upper soil –17.12 %, rRMSE = 23.30 %). Also, the temporal vari-
layers are depicted in Figures 5a–b and Figure 6. The inves- ability between the ploughing and sowing into non-pre-
tigated soil layers experienced substantial variation in time, pared soil could play some role there. EITZINGER et al.
but the models were able to cope with it fairly well at (2004) also achieved considerably worse results for the win-
Žabčice (plough: MEI = 0.90, rMBE = –1.64 %, rRMSE = ter wheat than for the spring barley. Compared to the men-
9.03 %; minimum tillage: MEI = 0.88, rMBE = –0.02 %, tioned work, the model presented within the current study
Die Bodenkultur 12 61 (1) 2010The performance of CERES-Barley and CERES-Wheat under various soil conditions and tillage practices in Central Europe
did not show a tendency to underestimate the soil water
content of the top layers. Differences in the case of the win-
ter wheat simulations can be explained by significant varia-
tions in simulating the rooting depth, which is influenced
by the root-weighting factor defined by user for each soil
layer (ranking from 0 to 1 and characterizing the suitabili-
ty for root growth), the default crop-specific coefficients
and the actual soil water distribution. The results could be
improved mainly by more detailed input data, especially re-
garding the soil structure and permeability, rooting depth
and by the proper parameterization of the potential evapo- Figure 6: The comparison of the ploughing (Pl) and minimum
transpiration for the given conditions. There are also the (Min) tillage approaches within the Raasdorf field trials
on the basis of the volumetric soil moisture under winter
general limits of the CERES-Wheat and CERES-Barley wheat cover during the year 2002
models connected with the cascading principle, which cal- Abbildung 6: Vergleich der Pflug- (Pl) und Minimalbodenbearbeitungs-
culates the soil water flux as long as the field capacity is sur- variante (Min) der Feldexperimente in Raasdorf hinsicht-
passed and no flux is possible when the soil water content is lich der gemessenen und simulierten Bodenwassergehalte
(%Vol.) bei Winterweizen im Jahr der Ernte 2002
below the field capacity. Moreover, the used models suppose
the absolutely homogenous properties through the defined
layers and capillary rise is neglected. From Figure 5 it is apparent that slight differences between
ploughing and minimum tillage at Žabčice are hardly dis-
tinguishable by the employed model. According to the
Wilcoxon test (α = 0.01), there was no statistically signifi-
cant difference between the measured soil water course
under ploughing and minimum tillage during the year
2004, but there was a significant difference during 2005.
Also, the simulated soil water (after ploughing and mini-
mum tillage) did not differ significantly in 2004 but did dif-
fer during 2005. The soil water content with ploughing in
Žabčice was equal to or even slightly higher (mainly in
2005) than that observed with minimum tillage. This could
be explained by the lower water infiltration in the upper soil
layers in the minimum tillage treatment due to soil com-
paction on clay soil, by higher plant water uptake or by
cracks bypassing the water flow of the upper soil layer. Gen-
erally, small differences could also be caused by only a slight
disparity within the soil properties as a consequence of the
short period with the unchanged minimum tillage at the ex-
perimental plots (from 2003). Some of the soil properties
(e.g., organic matter changes, soil-moisture constants or
worm activity) could be considerably altered as long-term
effects of such cultivation. Some of the deviation within the
Figure 5: A comparison of the ploughing (Pl) and minimum (Min) soil moisture measurements could be connected with the
tillage approaches within the Žabčice field trials on the
basis of the volumetric soil moisture under spring barley
TDR probes, which are sensitive to soil cracks (which often
during the years (a) 2004 and (b) 2005 take place within the heavy Grey Fluvisoil at Žabčice). The
Abbildung 5: Vergleich der Pflug- (Pl) und Minimalbodenbearbei- Raasdorf TDR measurements provided results with statisti-
tungsvariante (Min) der Feldexperimente in Žabčice hin- cally significant differences (according to Wilcoxon and =
sichtlich der gemessenen und simulierten Bodenwasser-
gehalte (%Vol.) bei Sommergerste in (a) 2004 und (b) 0.01) between the experiments and the higher soil water
2005 content was observed after the minimum tillage. Although
Die Bodenkultur 13 61 (1) 2010P. Hlavinka, M. Trnka, J. Eitzinger, V. Smutný, S. Thaler, Z. Žalud, P. Rischbeck and J. Křen
Table 3: The water balance components according to the CERES-Wheat and CERES-Barley models for the different tillage methods and sites.
Moreover, the measured and estimated yields after ploughing and minimum tillage are listed.
Tabelle 3: Simulierte Wasserbilanzkomponenten des CERES-Wheat-/CERES-Barley-Modells für die unterschiedlichen Bodenbearbeitungsvarian-
ten und Standorte. Zusätzlich sind die gemessenen und simulierten Erträge der Varianten angegeben.
Žabčice Raasdorf
Plough 2004 Mini 2004 Plough 2005 Mini 2005 Plough 2002 Mini 2002
Start of water balance analysis 2004/082 2004/082 2005/089 2005/089 2001/273 2001/273
End of water balance analysis 2004/204 2004/204 2005/200 2005/200 2002/201 2002/201
Water content at the beginning (mm) 325.7 335.4 452.7 461.0 296.7 305.7
Water content at the end (mm) 286.4 276.5 342.8 353.2 319.3 328.9
Precipitation (mm) 205.7 205.7 254.7 254.7 388.9 388.9
Drainage (mm) 0.0 0.0 0.0 0.0 0.0 0.0
Runoff (mm) 6.8 8.9 5.5 4.4 14.25 21.0
Soil Evaporation (mm) 125.9 103.2 112.2 104.4 173.1 170.9
Transpiration (mm) 112.3 152.5 246.9 253.7 178.9 173.9
Potential ET (mm) 453.6 448.8 438.9 438.5 489.8 490.8
Measured yield (kg/ha) 7630 7940 7670 7620 4243 4139
Estimated yield (kg/ha) 4622 4568 5208 5237 4371 3890
the CERES-Wheat model estimated a lower amplitude and four various tillage treatments for silty-clay soil in Southern
lower soil water depletion (see Figure 6), it reasonably re- Italy, but on the other hand, the simulated plant extractable
produced the main trends. Also, the estimated soil water soil water did not differ significantly for the conventional
course statistically differed for both of the investigated mould board ploughing and minimum tillage. Conse-
tillage approaches. quently, minimum tillage was recommended for the inves-
The detailed overview of the simulated soil water balance tigated environment, since it allows greater savings in time,
components and yields (observed and estimated) within energy and human work, without causing appreciable loss-
different tillage at Žabčice and Raasdorf stations is listed es in the yield there. Within the cited study, the soil water
within Table 3. An overview of all of the results achieved content was successfully modeled for both of the men-
within the current study is presented in Figures 7 and 8. tioned treatments, while the r2 varied from 0.98 to 0.99 and
The simulations (using CERES-Wheat) executed by the regression slope varied from 0.86 to 0.93.
CASTRIGNANÒ et al. (1997) show some differences among
Figure 7: The detailed comparison between the model estimates and reality based on a set of crop parameters. The rMBE parameter was used
for the model simulation assessment, and the grey cells represent the locality-parameter combinations that were not analyzed. (Ab-
breviations: WW – winter wheat, SB – spring barley, Pl – ploughing, Min – minimum tillage, N-l – low-nitrogen fertilization, N-m
– medium-nitrogen fert., N-h – higher-nitrogen fert., MAT – maturity date, FLOW – flowering date, TGW – weight of one thou-
sand seeds)
Abbildung 7: Detaillierter Vergleich verschiedener simulierter Parameter der verschiedenen Varianten hinsichtlich ihrer Abweichungen zu den ge-
messenen Werten. Angegeben ist der statistische Parameter rMBE (mittlerer Fehler), die Kombinationen der grauen Zellen wurden
nicht analysiert. (Abkürzungen: WW – Winterweizen, SB – Sommergerste, Pl – Pflugbearbeitung, Min – Minimalbodenbearbeitung,
N-1 – geringe N-Düngung, N-m – mittlere N-Düngung, N-h – hohe N-Düngung, MAT – Reifedatum, FLOW – Blühzeitpunkt,
TGW – Tausendkorngewicht)
Die Bodenkultur 14 61 (1) 2010The performance of CERES-Barley and CERES-Wheat under various soil conditions and tillage practices in Central Europe
Figure 8: The detailed comparison between the model estimates and reality based on a set of crop parameters. The rRMSE parameter was used
for the model simulation assessment, and the grey cells represent the locality-parameter combinations, which were not analyzed. (Ab-
breviations: WW – winter wheat, SB – spring barley, Pl – ploughing, Min – minimum tillage, N-l – low-nitrogen fertilization, N-m
– medium-nitrogen fert., N-h – higher-nitrogen fert., MAT – maturity date, FLOW – flowering date, TGW – weight of one thou-
sand seeds)
Abbildung 8: Detaillierter Vergleich verschiedener simulierter Parameter der verschiedenen Varianten hinsichtlich ihrer Abweichungen zu den
gemessenen Werten. Angegeben ist der statistische Parameter rRMSE (mittlere quadratische Abweichung), die Kombinationen der
grauen Zellen wurden nicht analysiert. (Abkürzungen: WW – Winterweizen, SB – Sommergerste, Pl – Pflugbearbeitung, Min – Mi-
nimalbodenbearbeitung, N-1 – geringe N-Düngung, N-m – mittlere N-Düngung, N-h – hohe N-Düngung, MAT – Reifedatum,
FLOW – Blühzeitpunkt, TGW – Tausendkorngewicht)
4 Conclusions was observed lower yield of spring barley after ploughing in
2004 and almost identical yields (for both tillage approach-
The results of the present study confirmed that the CERES- es) in 2005. For example CASTRIGNANÓ et al. (1997) re-
Barley and CERES-Wheat models are able to provide rela- vealed that soil water content did not differ significantly
tively reliable estimates of the development, yields, above after the mould board ploughing and minimum tillage
ground biomass accumulation and soil water dynamics within silty-clay soil in Southern Italy and recommended
across a range of different conditions (stations with differ- minimum tillage for investigated conditions because it
ent soils and climate). allows saving in time, energy and human work.
The ability of the CERES-Wheat and CERES-Barley These results suggest that both models can be used only
models to distinguish different tillage (ploughing vs. with caution to estimate the effect of adaptation measures
minimum tillage) was also assessed. The different tillage such as tillage intensity and to optimize the crop produc-
approaches were identified (within mentioned models) tion under the current and future climate conditions.
through the tillage date and depth, changed bulk density,
field capacity, wilting point and root-weighting factor of the
upper layers. The submodel of soil water provided good re- Acknowledgements
sults within the Žabčice locality (MEI = 0.90–0.88), but it
was difficult to pick up the small differences between the The experimental data on the different soil tillage tech-
conventional and minimum tillage. In Raasdorf, the soil niques were set up and evaluated with the support of the
water content was simulated with a lower accuracy (MEI = National Agency for Agricultural Research (project no:
0.51 to 0.11), but the model detected the magnitude and 1G46055, “Possibilities of limiting the drought impact by
trends of the differences between the tillage techniques well. optimizing management practices in some field crops” ). The
From the results of the soil water measurements and simu- modeling of soil water dynamics was supported by Grant
lations, it could be concluded that minimum tillage leads to Agency of the Czech Republic (project no: 521/09/P479).
an increase of the soil water that is available to the plant in The study was conducted with the support of Research plan
Raasdorf. Ploughing, however, seems to provide slightly no. MSM6215648905, “Biological and technological as-
larger soil water reserves on the fluvisol of Žabčice (where pects of sustainability of controlled ecosystems and their
potential long term effects are still not established), proba- adaptability to climate change” financed by the Ministry of
bly as a consequence of the higher soil compaction in min- Education, Youth and Sports of the Czech Republic.
imum tillage on clay soil. Despite of mentioned results there
Die Bodenkultur 15 61 (1) 2010P. Hlavinka, M. Trnka, J. Eitzinger, V. Smutný, S. Thaler, Z. Žalud, P. Rischbeck and J. Křen
References HLAVINKA, P., M. TRNKA, L. BARTOŠOVÁ, J. BÁLEK, E.
POKORNÝ, P. KAPLER, M. DUBROVSKÝ, M. SVOBODA, J.
AGGARWAL, P.K. (2000): Application of systems simulation EITZINGER, M. MOŽNÝ (2007): Modelling of the Soil
for understanding and increasing yield potential of wheat Moisture and Temperature Regimes in central Europe
and rice. Ph.D. Thesis, Wageningen Agriculture Univer- and Central US 7th Annual meeting of European Mete-
sity, The Netherlands, 176. orological Society and 8th European Conference on
ALEXANDROV, V., HOOGENBOOM, G. (2000): The impact Applied Climatology, Escorial 1–5th October 2007.
of climate variability and change on crop yield in Bul- H LA, J., P. PROCHÁZKOVÁ (Eds.) (2008): Minimalizace
garia. Agric. For. Meteorol. 104: 315–327. zpracování p dy. Profi Press, Prague, ISBN 978-80-
CANTERO-MARTINEZ, C., ANGAS, P., J. LAMPURLANES 86726-28-1, p. 248.
(2007): Long-term yield and water use efficiency under IZAURRALDE, R.C., N.J. ROSENBERG, R.A. BROWN, A.M.
various tillage systems in Mediterranean rainfed con- THOMSON (2003): Integrated assessment of Hadley Cen-
ditions. Annals of Applied Biology 150: 293–305. ter (HadCM2) climate change impacts on agricultural
CASTRIGNANÒ, A., R. COLLUCI, D. DE GIORGIO, V. RIZZO, productivity and irrigation water supply in the conter-
M. STELLUTI (1997): Tillage effects on plant extractable minous United States Part II Regional agricultural pro-
soil water in a silty clay vertisol in Southern Italy. Soil & duction in 2030 and 2095. Agric. For. Meteorol. 117:
Tillage Research 40: 227–237. 97–122.
DIEPEN VAN, C.A. (1992): An Agrometeorological model to JONES, J.W., G. HOOGENBOOM, C.H. PORTER, K.J.
monitor the crop state on a regional scale in the European BOOTE, W.D. BATCHELOR, L.A. HUNT, P.W. WILKENS,
Community: Concept implementation and first opera- U. SINGH, A.J. GIJSMAN, J.T. RITCHIE (2003): The
tional outputs. In Proceedings of the Conference on DSSAT cropping system model. Europ. J. Agronomy 18:
Application of Remote Sensing to Agricultural Statistics, 235–265.
Belgirate, Italy: 269–277. JONES, C.A., N. KINIRY (1986): CERES-Maize, A Simula-
DAVIES, J.A., D.C. MCKAY (1989): Evaluation of selected tion Model of Maize Growth and Development, Texas
models for estimating solar radiation on horizontal sur- A&M University Press, College Station, TX.
faces. Solar Energy 43: 153–168. OSUNBITAN, J.A., D.J. OYEDELE, K.O. ADEKALU (2005):
DUBROVSKÝ, M., M. SVOBODA, M. TRNKA, M. HAYES, D. Tillage effects on bulk density, hydraulic conductivity
WIHITE, D., Z. ŽALUD, P. HLAVINKA (2009): Application and strength of a loamysand soil in southwestern Nigeria.
of Relative Drought Indices to Assess Climate Change Soil & Tillage Research 82: 57–64.
Impact on Drought Conditions in Czechia, Theoretical OTTER-NACKE, S., J.T. RITCHIE, D.C. GODWIN, U. SINGH
and Applied Climatology 96: 155–171. (1991): A user’s guide to CERES Barley – V210 Inter-
EITZINGER, J., M. STASTNÁ, Z. ŽALUD, M. DUBROVSKY national Fertilizer Development Center Simulation
(2003): A simulation study of the effect of soil water manual IFDC-SM-3, p. 87.
balance and water stress on winter wheat production PERDIGÃO, V., I. SUPPIT (Eds.) (1999): An Early Crop Yield
under different climate change scenarios. Agricultural Estimation Method for Finnish Conditions: The crop
Water Management 61: 195–217. growth monitoring system of the Joint Research Centre
EITZINGER, J., M. TRNKA, J. HÖSCH, Z. ŽALUD, M. with and without Remotely Sensed and other Additional
DUBROVSKÝ (2004): Comparison of CERES, WOFOST Input data. EUR-18975 EN 1999, p. 144.
and SWAP models in simulating soil water content dur- QUIRING, S.M., T.N. PAPAKRYIAKOU (2003): An evaluation
ing growing season under different soil conditions. Eco- of agricultural drought indices for the Canadian prairies.
logical Modelling 171: 223–246. Agriculture and Forest Meteorology 118: 49–62.
GODWIN, D.C., J.T. RITCHIE, U. SINGH, L. HUNT (1989): RINALDI, M. (2004): Water availability at sowing and
A User´s Guide to CERES Wheat-v2.10. International nitrogen management of durum wheat: a seasonal analy-
Fertilizer Development Center, Muscle Schoals, Al. sis with the CERES-Wheat model. Field Crops Research
HLAVINKA, P., M. TRNKA, D. SEMERÁDOVÁ, M. DUBROVSKÝ, 89: 27–37.
Z. ŽALUD, M. MOŽNÝ (2009): Effect of drought on yield RISCHBECK, P.M. (2007): Der Einfluss von Klimaände-
variability of key crops in Czech Republic. Agricultural and rung, Bodenbearbeitung und Saattermin auf den Wasser-
forest meteorology 149: 431–442. haus halt und das Ertragspotential von Getreide im
Die Bodenkultur 16 61 (1) 2010The performance of CERES-Barley and CERES-Wheat under various soil conditions and tillage practices in Central Europe Marchfeld. PhD Thesis, University of Natural Resources Adress of Authors and Applied Life Sciences, Vienna, Austria. RITCHIE, J.T., U. SINGH, D.C. GODWIN, W.T. BOWEN Ing. Petr Hlavinka, Ph.D., Ing. Mgr. Miroslav Trnka, (1998): Cereal growth development and yield. In Under- Ph.D., Ing. Vladimír Smutný, Ph.D., Prof. Ing. Zdeněk standing Options for Agricultural Production, G.Y. Tsuji, Žalud, Ph.D., Prof. Ing. Jan K en, CSc., Institute of G. Hoogenboom, P.K. Thorton, Eds.; Kluwer Academic Agrosystems and Bioclimatology, Mendel University of Publishers: Dodrecht, The Netherlands, p. 325. Agriculture and Forestry, Brno, Czech Republic SIJTSMA, C.H., A.J. CAMPBELL, N.B. MCLAUGHLIN, M.R. Ao. Univ.-Prof. Dipl.-Ing. Dr. Josef Eitzinger, Mag. Sabi- CARTER (1998): Comparative tillage costs for crop rota- na Thaler, Dipl.-Ing. Rischbeck Pablo, Ph.D., Institute of tions utilizing minimum tillage on a farm scale. Soil and Meteorology of the Department of Water, Atmosphere and Tillage Research 49: 223–231. Environment, University of Natural Resources and Applied ŠÍP, V., P. R ŽEK, J. CHRPOVÁ, R. VAVERA, H. KUSÁ (2009): Life Sciences (BOKU), Vienna, Austria The effect of tillage practice, input level and environment on the grain yield of winter wheat in the Czech republic. Field Crop Research 113: 131–137. Corresponding author TRNKA, M., M. DUBROVSKÝ, Z. ŽALUD (2004a): Climate change impacts and adaptation strategies in spring barley Petr Hlavinka, e-mail: phlavinka@centrum.cz production in the Czech Republic. Climatic Change 64: 227–255. Eingelangt am 26. Februar 2009 TRNKA, M., M. DUBROVSKÝ, D. SEMERÁDOVÁ, Z. ŽALUD Angenommen am 28. Januar 2010 (2004b): Projections of uncertainties in climate change scenarios into expected winter wheat yields. Theoretical and Applied Climatology 77: 229–249. TRNKA, M., P. HLAVINKA, D. SEMERÁDOVÁ, M. DUBROVS- KÝ, Z. ŽALUD, M. MOŽNÝ (2007): Agricultural drought and spring barley yields in the Czech Republic. Plant Soil and Environment 53: 306–316. TSUJI, G.Y., G. HOGENBOOM, P.K. THORTON (Eds.) (1998): Understanding Options for Agricultural Production. Kluwer Academic Publishers, Dordrecht, The Nether- lands. WILMOT, C.J. (1982): Some comments on the evaluation of model performance. Bull. Am. Meteorol. Soc. 64: 1309–1313. WOLF, J., L.G. EVANS, M.A. SEMENOV, H. ECKERSTEN, A. IGLESIAS (1996). Comparison of wheat simulation mod- els under climate change I Model calibration and sensi- tivity analyses. Climate Research 7: 253–270. Die Bodenkultur 17 61 (1) 2010
You can also read


