Summer 2019 Forecast Accuracy Update - Review of the 2018 Electricity Statement of Opportunities Forecasts - AEMO
←
→
Page content transcription
If your browser does not render page correctly, please read the page content below

Summer 2019 Forecast Accuracy
                       Update
                                    June 2019

   Review of the 2018 Electricity Statement of
                     Opportunities Forecasts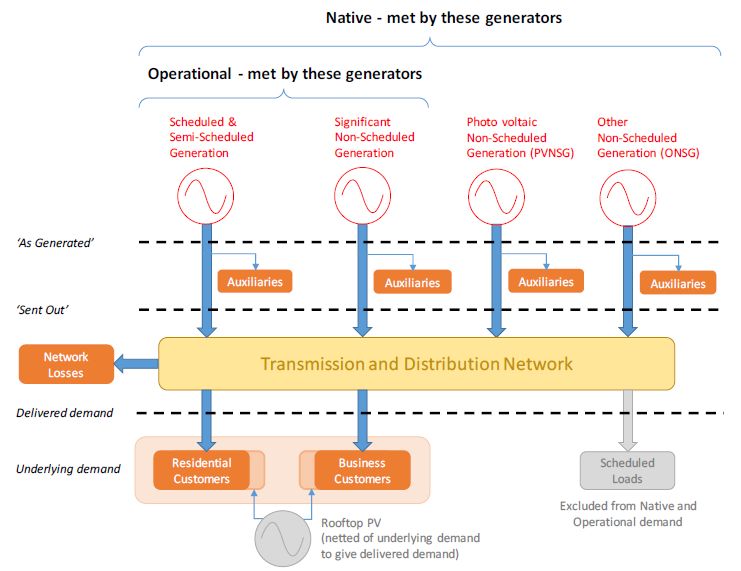
Important notice
PURPOSE
This Summer 2019 Forecast Accuracy Update has been prepared for the purposes of clause 3.13.3(u) of the
National Electricity Rules. It reports on the accuracy of demand and supply forecasts to date in the 2018
Electricity Statement of Opportunities (ESOO) for the National Electricity Market (NEM) and improvements
made to the forecasting process for the 2019 ESOO.
This publication has been prepared by AEMO using information available at 13 th May 2019.

DISCLAIMER
This document or the information in it may be subsequently updated or amended. This document does not
constitute legal or business advice, and should not be relied on as a substitute for obtaining detailed advice
about the National Electricity Law, the National Electricity Rules, or any other applicable laws, procedures or
policies. AEMO has made every effort to ensure the quality of the information in this document but cannot
guarantee its accuracy or completeness.
Accordingly, to the maximum extent permitted by law, AEMO and its officers, employees and consultants
involved in the preparation of this document:
• make no representation or warranty, express or implied, as to the currency, accuracy, reliability or
  completeness of the information in this document; and
• are not liable (whether by reason of negligence or otherwise) for any statements or representations in this
  document, or any omissions from it, or for any use or reliance on the information in it.

VERSION CONTROL
 Version         Release date                Changes

 1               19/06/2019                  First Version for Publication

CORRESPONDANCE
Questions and comments should be directed to energy.forecasting@aemo.com.au.

© AEMO 2019. Summer 2019 Forecast Accuracy Update
Executive summary
Each year, the Australian Energy Market Operator (AEMO) assesses the accuracy of its electricity demand and
consumption forecasts to help inform its continuous improvement program and build confidence in the
forecasts produced. The annual report is normally published towards the end of the calendar year following
the relevant Electricity Statement of Opportunities (ESOO) publication, to allow time to collect historical
observations of annual consumption, and key input drivers. For the first time, AEMO has prepared this
Summer Forecast Accuracy Update to enable more timely understanding of the 2018 ESOO forecast
performance over summer and implement any identified model improvements ahead of the 2019 ESOO.
Summer 2019 was the warmest on record, with high demand in most regions of the NEM and record demand
in Queensland. It was also the highest year for solar PV installations. Renewable generation now supplies
more than ever before. The majority of the observed trends fell within the expectations of the 2018 ESOO.
This report has explored the accuracy of key forecast elements, including demand drivers, demand forecasts
and supply forecasts for summer 2018-19. It highlights that:
• Forecasts for customer connections and PV uptake were optimistic. While these two demand drivers are
  important, the net effect of both mostly cancelled each other out.
• Demand forecasts were appropriate, except for Queensland, for which an upward revision is needed and
  will be implemented in the upcoming ESOO.
• Supply forecasts were mostly appropriate, however some coal generators performed worse than expected
  and will also be adjusted in the upcoming ESOO.
AEMO will continue to improve the forecasting techniques in use, with improvements expected in time for the
2019 ESOO.
The 2018 ESOO forecast “a relatively high forecast likelihood (1-in-3 chance) of some unserved energy (USE)” 1
in Victoria over summer 2019, especially if high temperatures emerged. Other regions had no material
forecast reliability gap. High demand conditions in Victoria did materialise as forecast and coincided with
generator outages, resulting in load shedding on the 24 th and 25th January 20192. No other region suffered
from lack-of-capacity induced load shedding. A performance summary is provided below:
Table 1                   Forecast accuracy summary by region – summer 2018-19

    Region             Summer Demand                                Summer Supply                             Summer Reliability Outcome
                       Accuracy                                     Accuracy

    NSW                         Good                                         Good                                      No load shedding

    QLD                         Demand higher than                           Good                                      Surplus capacity avoided
                                forecast                                                                               load shedding

    SA                          Good                                         Good                                      No load shedding

    TAS                         Good                                         Good                                      No load shedding

    VIC                         Good                                         Higher failure rates                      Forecast risk of load
                                                                             than forecast                             shedding eventuated

1
    AEMO. 2018 Electricity Statement of Opportunities for the National Electricity Market, August 2018. https://www.aemo.com.au/Electricity/National-
     Electricity-Market-NEM/Planning-and-forecasting/NEM-Electricity-Statement-of-Opportunities
2
    AEMO. Load Shedding in VIC on 24 and 25 January 2019. https://aemo.com.au/Media-Centre/PSOIR-published-for-load-shedding-24-25-Janaury

© AEMO 2019. Summer 2019 Forecast Accuracy Update
Contents Executive summary 3 1. Introduction 7 1.1 Definitions 7 2. Trends in demand drivers 9 2.1 Population and connections 9 2.2 Rooftop PV and PV non-scheduled generation 10 2.3 Weather and climate 11 3. Demand forecasts 12 3.1 Modelling consumer behaviour 12 3.2 Summer 2019 actuals 14 3.3 New South Wales 15 3.4 Queensland 16 3.5 South Australia 17 3.6 Tasmania 19 3.7 Victoria 20 3.8 Demand forecast improvements 22 4. Supply forecasts 24 4.1 New South Wales black coal generation availability 26 4.2 Queensland black coal generation availability 27 4.3 Victorian brown coal generation availability 28 4.4 Hydro generation availability 29 4.5 Gas and liquid fuel generation availability 30 4.6 New South Wales intermittent generation availability 30 4.7 South Australian intermittent generation availability 31 4.8 Victorian intermittent generation availability 32 4.9 Supply forecast improvements 33 5. Summary 35 5.1 List of relevant improvements for the 2019 ESOO 35 A1. 2019 summer adjustments 36 A2. Measures and abbreviations 40 © AEMO 2019 Summer 2019 Forecast Accuracy Update 4
Figures
Figure 1       Demand definitions used in this document                                       8
Figure 2       NEM rooftop PV and PVNSG installed capacity comparison, 2015 - 2023           10
Figure 3       BoM Seasonal Deciles. summer 2018-19.                                         11
Figure 4       Individual and Group demand shown on one day                                  12
Figure 5       Scatterplot of NSW demand and temperature. Example based on 2017 calendar
              year.                                                                          13
Figure 6       Conceptual maximum demand probability density functions for 3 scenarios.      13
Figure 7       New South Wales demand history compared to neutral forecast, summer 2016-
              summer 2021                                                                    15
Figure 8       New South Wales demand and daily maximum temperature scatterplot, summer
              2019.                                                                          16
Figure 9       Queensland demand history compared to neutral forecast, summer 2016 -
              summer 2021                                                                    16
Figure 10     Queensland demand and daily maximum temperature scatterplot, summer 2019.      17
Figure 11      South Australian demand history compared to neutral forecast, summer 2016 –
              summer 2021                                                                    18
Figure 12     South Australia demand and daily maximum temperature scatterplot, summer
              2019.                                                                          19
Figure 13     Tasmania demand history compared to neutral forecast, summer 2016 – summer
              2021                                                                           19
Figure 14     Tasmania demand and daily maximum temperature scatterplot. Summer 2019.        20
Figure 15     Victoria demand history compared to neutral forecast, summer 2016 – summer
              2021                                                                           21
Figure 16     Victoria demand and daily maximum temperature scatterplot, summer 2019.        22
Figure 17     New South Wales black coal historic unplanned outage rates                     26
Figure 18     New South Wales black coal supply availability – top 10 hottest days           26
Figure 19     Queensland black coal historic unplanned outage rates                          27
Figure 20     Queensland black coal supply availability – top 10 hottest days                27
Figure 21     Victorian brown coal historic unplanned outage rates                           28
Figure 22     Victorian brown coal supply availability – top 10 hottest days                 28
Figure 23     Hydro historic unplanned outage rates                                          29
Figure 24     Mainland hydro supply availability – top 10 hottest days                       29
Figure 25     Gas and liquid supply availability – top 10 hottest days                       30
Figure 26     New South Wales intermittent generation availability – top 10 hottest days     30
Figure 27     South Australian intermittent generation availability – top 10 hottest days    31
Figure 28     Victorian intermittent generation availability – top 10 hottest days           32
Figure 29     Estimated mean time to repair in hours by region and fuel type                 33

© AEMO 2019 Summer 2019 Forecast Accuracy Update                                              5
Tables
Table 1 Forecast accuracy summary by region – summer 2018-19 3
Table 2 Forecast and actual residential connections growth rate comparison. 2018-19 (%) 9
Table 3 Rooftop PV and PVNSG installed capacity comparison by state. January 2019.
(MW) 10
Table 4 Summer 2019 maximum demand with adjustments per NEM region. 14
Table 5 New South Wales summer 2019 maximum demand and temperature actual
compared to forecast 15
Table 6 Queensland summer 2019 maximum demand and temperature actual compared
to forecast 17
Table 7 South Australian summer 2019 maximum demand and temperature actual
compared to forecast 18
Table 8 Tasmania summer 2019 maximum demand and temperature actual compared to
forecast 20
Table 9 Victoria summer 2019 Maximum demand and temperature actual compared to
forecast 21
Table 10 Demand forecast improvements from the 2018 Forecast Accuracy Report 23
Table 11 Outage and derating rates used in 2018 ESOO. 25
Table 12 New South Wales intermittent generation capacity, forecast and actual. 31
Table 13 South Australia intermittent generation capacity, forecast and actual. 31
Table 14 Victoria intermittent generation capacity, forecast and actual. 32
Table 15 Summer 2019 peak demand days in NEM regions. 36
Table 16 New South Wales maximum demand adjustments 37
Table 17 Queensland maximum demand adjustments 37
Table 18 South Australia maximum demand adjustments 38
Table 19 Tasmania maximum demand adjustments 38
Table 20 Victoria maximum demand adjustments 39
© AEMO 2019 Summer 2019 Forecast Accuracy Update 61. Introduction
The Australian Energy Market Operator (AEMO) produces a Forecast Accuracy Report for its Electricity
Statement of Opportunities (ESOO) each year. In advance of the annual Forecast Accuracy Report, this 2019
Summer Forecast Accuracy Update aims to expedite the accuracy assessment for metrics relevant only to
summer. This assessment reviews the accuracy of input assumptions, summer maximum demand, and
summer supply availability in AEMO’s 2018 ESOO 3, for each region in the National Electricity Market (NEM).
This document is not designed to be a replacement for the annual Forecast Accuracy Report and will not
include all metrics published annually. Consultation is ongoing with stakeholders and academics to define
appropriate accuracy metrics for the annual publication.
The 2018 ESOO provided AEMO’s independent forecast of supply reliability in the National Electricity Market
over a 10-year period to inform the decision-making processes of market participants, new investors, and
policy-makers as they assess future development opportunities. The forecasts were developed by comparing
simulations of customer demand with simulations of available generator supply. This report explores the
accuracy of these elements in three parts:
• Trends in demand drivers.
• Demand forecasting.
• Supply forecasting.
1.1 Definitions
In this report, all forecasts are reported on a “sent out” basis unless otherwise noted. Terms used in this report
are defined in the glossary. To assess forecasting performance, historical demand “as generated” is converted
to “sent-out” based on estimates of auxiliary load. Figure 1 shows the demand definitions used in this
document.
For consistency, data and methodologies of actuals are the same as those used for the corresponding
forecasts in the 2018 ESOO. This means:
• Summer is defined as November to March for all NEM regions, except Tasmania where summer is defined
as December to February inclusive.
• This report uses a definition of auxiliary load consistent with the 2018 ESOO. This definition may result in
variations from estimates published in 2017 and before.
3
AEMO. 2018 Electricity Statement of Opportunities for the National Electricity Market, August 2018. Available at
https://www.aemo.com.au/Electricity/National-Electricity-Market-NEM/Planning-and-forecasting/NEM-Electricity-Statement-of-Opportunities
© AEMO 2019 Summer 2019 Forecast Accuracy Update 7Figure 1 Demand definitions used in this document © AEMO 2019 Summer 2019 Forecast Accuracy Update 8
2. Trends in demand
   drivers
Electricity forecasts are predicated on a wide selection of inputs, drivers and assumptions. The 2018 ESOO laid
out the changing social, economic, and political environment in which the Australian electricity market
operates. As this environment evolves, the needs of the market and system will also evolve. Three scenarios
were therefore proposed to capture and test possible pathways: Slow Change, Neutral and Fast Change.
The 2018 ESOO was published in August 2018, nine months before this publication was written. For some
input variables it is too early to comment on performance; these include economic growth and retail price.
Other variables have no material impact on the 2019 summer outcome and are not discussed. For example,
neither energy storage systems (ESS) nor electric vehicles are yet at meaningful levels of penetration. Input
variables suitable for comment are discussed below.

2.1       Population and connections
Population is a main driver of electricity demand, directly affecting the number of residential and non-
residential connections. The 2018 ESOO forecast residential connections as a function of population, taking
dwelling and population forecasts from the Housing Industry Association (HIA), and the Australian Bureau of
Statistics (ABS). Non-residential connections were forecast as a function of economic growth and population.
Table 2 shows the residential connection growth for 2018-19 sourced from AEMO internal monthly
connections data, against the three 2018 ESOO scenarios.

Table 2           Forecast and actual residential connections growth rate comparison. 2018-19 (%)
                                            NSW          QLD               SA             TAS             VIC
 Actual (Jan18-Jan19)                       1.3%          1.2%           1.2%             1.1%           1.7%
 Slow Change scenario                       1.6%          1.5%           1.2%            0.7%            1.7%
 Neutral scenario                           1.8%          1.7%           1.3%            0.8%            1.9%
 Fast Change scenario                       2.0%          1.9%           1.5%            0.9%            2.1%

As the table shows, actual connections growth over 2018-19 was predominantly lower than forecast
(sometimes in line with the slow scenario, sometimes below), except in the case of Tasmania. The inaccuracy
is driven by the assumptions applied in application of the HIA and ABS forecasts. A new connections model
has been developed for 2019 that incorporates greater visibility and consideration for the history and dwelling
type characteristics. AEMO is also anticipating new information from the ABS that may inform more accurate
short-term forecasts.

© AEMO 2019 Summer 2019 Forecast Accuracy Update                                                                9
2.2 Rooftop PV and PV non-scheduled generation The 2018 ESOO forecast rapid rates of PV system installation, a revision upwards from previous forecast trajectories. The forecast provided by CSIRO assumed a short term rise in installations, which would slow in the medium term as conditions for installation became less favourable. Both PV and PV non-scheduled generation (PVNSG) actuals are not known precisely and are subject to revision. In this case, both estimates of the history have been revised downwards due to the availability of better information. Figure 2 shows the forecast for the 2018 ESOO and compares it with recently revised actuals. Table 3 compares the forecast for January 2019 from the 2018 ESOO with recently revised estimates of actuals. These actuals are estimated from installation data provided by the Clean Energy Regulator, cleaned and de-rated by AEMO to reflect average age of systems, and system replacements. Figure 2 NEM rooftop PV and PVNSG installed capacity comparison, 2015 - 2023 Table 3 Rooftop PV and PVNSG installed capacity comparison by state. January 2019. (MW) January 2019 NSW QLD SA TAS VIC PV Actual (MW) 1981 2426 1021 137 1592 PV Forecast (MW) 2268 2462 1059 161 1768 PV Difference (%) -13% -1% -4% -15% -10% PVNSG Actual (MW) 168 133 53 6 75 PVNSG Forecast (MW) 176 146 51 7 85 PVNSG Difference (%) -4% -9% 4% -19% -12% Overall, PV installations have fallen short of the growth trajectories expected, with most of the difference occurring in the residential sector. Tasmanian installations have been substantially slower than forecast. As installed PV capacity is negatively correlated with electricity demand, lower PV uptake may produce higher demand than otherwise forecast. While short-term PV forecast accuracy has been poor, the medium-term forecast is considered relevant given the moderating forecast trend. For 2019, the forecast is being revised. Due to the uncertainty in the rate of uptake, AEMO is seeking the advice of two expert consultants to inform the 2019 forecast. © AEMO 2019 Summer 2019 Forecast Accuracy Update 10
2.3             Weather and climate
Both customer demand and system supply are responsive to weather, which will change over time given
expected changes in climate. The 2018 ESOO considered the effect of future climate change in forecasting
electricity consumption and demand. As part of the forecasting process, temperatures used in demand
forecasting were escalated in line with Representative Concentration Pathway (RCP) 4.5 using publicly
available projections data4. The Bureau of Meteorology’s summary report 5 about the 2018-19 summer
included comments that:
• It was Australia’s warmest summer on record, marked by persistent widespread heat
• Mean and maximum temperature for the season broke previous records by large margins; both almost
  one degree above the record set in 2012-13
• It was the warmest on record for New South Wales, Victoria, Western Australia and the Northern Territory
• Exceptional heatwaves occurred during December on the tropical Queensland coast and across much of
  Australia during December and January
• Significant fires affected eastern Queensland, large parts of Tasmania, eastern Victoria, north-eastern New
  South Wales, and south west Western Australia
• Rainfall was below to very much below average across most of Australia, but above average for large parts
  of northern Queensland

Figure 3                 BoM Seasonal Deciles. summer 2018-19.

Source: Bureau of Meteorology, Australia in summer 2018-19

Demand forecasting processes are not fitted to a specific weather prediction, but instead simulate many
weather years around a long-term climate trend. Simulated weather years include short, medium and long
term trends: such as seasonal variability, El Nino/La Nina, and climate change. Temperature and heat waves
are not the only factors that contribute to maximum demand. However, given high temperatures are
positively correlated with electricity demand, the hot summer may produce a demand result towards the
higher end of the probability distribution for applicable regions.
Further work is currently underway to ensure the effects of climate change on the reliability and resilience of
the electricity system are considered. Subject to data availability, the choice of RCP in future forecasts should
reflect more likely global emissions trajectories.

4
    Sourced from ClimateChangeInAustralia.gov.au accessed as part of the 2018 ESOO process.
5
    Bureau of Meteorology, Australia in summer 2018-19. www.bom.gov.au/climate/current/season/aus/summary.shtml. Accessed 21May19.

© AEMO 2019 Summer 2019 Forecast Accuracy Update                                                                                     11
3. Demand forecasts This summer update does not discuss energy consumption and minimum demand. The demand forecast section will focus on the accuracy of the summer maximum demand forecasts only, leaving other variables to be address in the annual Forecast Accuracy Report later in the year. Summer maximum demand is the half-hour period with the highest level of demand in the season. It is the period where customer choices drive more coincident appliance use, typically in response to extreme heat. Understanding the modelling of these consumer choices is important in the evaluation of maximum demand forecast accuracy. 3.1 Modelling consumer behaviour Individual residential consumers do not behave consistently every day, and can sometimes appear unpredictable. Even on days with identical weather, the choices of individuals are not identical, and reflect the lifestyle of the individual or household. It is only when customer electrical demand is aggregated to a regional level that the group behaviour becomes more predictable. This is because the group demand largely cancels out the idiosyncratic behaviour of the individual. Figure 4 shows the load profile of an individual customer, compared to the average of a group of similar customers. While the load profile of the individual is spikey and erratic, the group profile has smoothed out some of idiosyncrasies of the customer. Figure 4 Individual and Group demand shown on one day Although demand becomes more predictable when aggregated, it remains a function of individual customer decisions. Periods of high demand only become so because individual customers choose to do the same things at the same time. Peak demand is therefore driven entirely by the degree of coincident appliance use across customers, across regions. There are many factors that drive customers to make similar appliance choices at the same time including: • Work and school schedules, traffic and social norms around meal times. • Weekdays, public holidays, and weekends. • Weather, and the use of heating and cooling appliances. • Many other societal factors, such as whether the beach is pleasant, or the occurrence of retail promotions. © AEMO 2019 Summer 2019 Forecast Accuracy Update 12
Figure 5 shows a scatter plot of temperature and electrical load. A strong relationship between temperature
and group electrical load can be seen, however the relationship cannot explain all variation. Even when all
observable characteristics are considered, the variance attributable to coincident customer choices remains.

Figure 5          Scatterplot of NSW demand and temperature. Example based on 2017 calendar year.

It is standard industry practise to model the drivers of demand in two parts
• structural drivers, which are modelled as scenarios, including considerations such as:
   – population,
   – economic growth,
   – electricity price,
   – technology adoption.
• Random drivers, which are modelled as a probability distribution, including considerations such as:
   – weather driven coincident behaviour,
   – weather driven embedded generation output,
   – non-weather driven coincident behaviour.

Figure 6 shows the modelled probability density functions that represent possible maximum demand
outcomes for a typical southern region. Three probability density functions are shown, one for each of the
scenarios with unique structural drivers. The 10% Probability of exceedance (POE) estimates are sampled from
the probability distributions, shown by the vertical lines.

Figure 6          Conceptual maximum demand probability density functions for 3 scenarios.

© AEMO 2019 Summer 2019 Forecast Accuracy Update                                                               13
3.2       Summer 2019 actuals
AEMO forecasts demand in the absence of load shedding and the occasional customer response to price
and/or reliability signals, known as demand side participation (DSP). Comparing actual observed demand with
forecast values can only be done if on the same basis. For example, a maximum demand day observed during
summer may have happened at a time of supply shortages, leading to load shedding and very high prices,
which also would have had a dampening impact on those exposed to market prices. Adjustments have been
identified to make 2019 actuals relevant and AEMO forecasts should not be compared without these
adjustments.
Adjustments have been grouped in to two types
• Firm – adjustments estimated based on metering data
• Potential – adjustments that are more speculative and are based on expected behaviour rather than
  metering data.
For example, the maximum demand for Victoria occurred on the 25th of January 2019. Due to the heat and
reduced generation availability, governments and utilities called for electricity conservation. Additionally,
AEMO procured demand side participation through the Reliability and Emergency Reserve Trader (RERT)
mechanism and there was forced load shedding. The load shedding and RERT is considered firm, while an
estimation of voluntary electricity conservation is considered potential.
Table 4 shows the maximum demand periods for the various NEM regions in summer 2019 with calculated
adjustments.

Table 4           Summer 2019 maximum demand with adjustments per NEM region.

 Region      Time of           Operational     Auxiliary   Operational   Adjustment   Adjustment    Adjusted
             maximum           as              load        sent out      (firm)       (potential)   sent out
             (NEM time)        generated

 NSW         31 Jan 19 16:30   13821           -501        13320         0            0             13320

 QLD         13 Feb 19 17:30   10044           -552        9492          20           0             9512

 SA          24 Jan 19 19:30   3240            -100        3140          82           55            3277

 TAS         15 Jan 19 15:30   1330            -18         1312          0            0             1312

 VIC         25 Jan 19 13:00   9110            -335        8775          510          120           9405

It should be noted that there was an early cool change on the 25 January in Victoria, with temperatures
coming down significantly from around 13:00. Had temperatures remained high, an even higher peak would
have been expected towards the evening as output from the approximately 1500 MW of installed rooftop PV
capacity in the region would have reduced.
Appendix A1 discusses the highest demand days in each NEM region during the 2018-19 summer and
whether any adjustments to observed peak demand were required.

© AEMO 2019 Summer 2019 Forecast Accuracy Update                                                                14
3.3 New South Wales
The electrical demand from New South Wales, shown in Figure 7, has been relatively stationary over the last
few years, with expected summer and winter seasonal patterns and distinctive summer peaks. The three-year
2018 ESOO forecast shown is also relatively stationary with a wide distribution of possible annual maximums;
this is a distribution reflecting the wide variety of annual weather and coincident customer behaviour
observed in New South Wales. There may be a positive bias due to the over forecast of customers, and a
negative bias from the over forecast of PV. The 2019 summer maximum fell between the 50% POE and 10%
POE forecasts, consistent with the hot weather observed over the period. While only one year out, the
forecast appears to have captured the summer maximum trends well.
Figure 7 New South Wales demand history compared to neutral forecast, summer 2016-summer
2021
Table 5 describes the demand and temperature characteristics of the observed maximum demand relative to
forecast. Rooftop PV output, temperature and heatwave index forecasts are sampled from the 10th – 90th
percentile range of the forecast simulations. The ranges demonstrate that annual maximum demand events
may occur in a variety of circumstances. In this case, the actual rooftop PV was within the simulated range,
and the observed temperature and heatwave index was within the 50% POE simulated temperature range as
expected.
Table 5 New South Wales summer 2019 maximum demand and temperature actual compared to
forecast
2019 Summer Actual Forecast Forecast Forecast
90% POE 50% POE 10% POE
Maximum demand – sent out (MW) 13,320 11,262 12,366 14,024
Rooftop PV at time of max demand (MW)6 568 363-1,492
Temperature at time of maximum demand (°C)6 38.1 32.2-38.0 37.8-41.0 39.9-44.5
3-day rolling heatwave index (°C)6, 7 7.0 5.0-8.2 7.0-9.7 8.7-11.9
6
10th - 90th percentile of simulations provided for forecast range.
7
Rolling 144 interval average of cooling degrees over threshold; designed to capture the effect of heat accumulation.
© AEMO 2019 Summer 2019 Forecast Accuracy Update 15Figure 8 shows the relationship between daily maximum demand and daily maximum temperature observed at the Bankstown Airport weather station. In 2019, the day of maximum demand coincided with the day of maximum temperature, however there were several near contenders at marginally lower temperatures. Figure 8 New South Wales demand and daily maximum temperature scatterplot, summer 2019. 3.4 Queensland The electrical demand from Queensland, shown in Figure 9, has become more volatile over the last few years, with a single period of high demand throughout summer. Shoulder season load has been declining, while summer loads are increasing, with increasing volatility. The three-year 2018 ESOO forecast shown is stationary with a wide distribution of possible annual maximums. In 2019, summer loads exceeded the 50% POE forecast several times and the maximum was well above the 10% POE forecast. The peak demand forecast did not sufficiently capture the emerging summer trends. Further analysis has shown that the forecast inaccuracy is pre-domninantly driven by changes in the quantity and/or coincident usage of cooling appliances by consumers. It is largely not attributable to industrial activity or connections. Figure 9 Queensland demand history compared to neutral forecast, summer 2016 - summer 2021 © AEMO 2019 Summer 2019 Forecast Accuracy Update 16
Table 6 describes the demand and temperature characteristics of the observed maximum demand relative to
forecast. The actual rooftop PV output and heatwave index was within the 10th – 90th percentile range of the
forecast simulations and the observed temperature was between the 90% POE and 50% POE simulated
temperature ranges despite a record maximum demand, further confirming poor model performance.

Table 6           Queensland summer 2019 maximum demand and temperature actual compared to forecast
 2019 Summer                                         Actual           Forecast        Forecast        Forecast
                                                                      90% POE         50% POE         10% POE

 Maximum demand – sent out (MW)                               9,512          8,252           8,533           9,067

 Rooftop PV at time of max demand (MW)                         380                                      223 – 1,493

 Temperature at time of maximum demand (°C)                   30.3        28.0-35.9       28.3-36.1       32.6-41.6

 3-day rolling heatwave index (°C)                              5.1         1.4-5.3         2.6-5.5         4.5-7.6

Figure 10 shows the relationship between daily maximum demand and daily maximum temperature observed
at the Archerfield Airport weather station. In 2019, the day of maximum demand did not coincide with the day
of maximum temperature, due to a combination of weather and non-weather driven coincident behaviours.

Figure 10         Queensland demand and daily maximum temperature scatterplot, summer 2019.

3.5         South Australia
The electrical demand from South Australia, shown in Figure 11, has a declining trend, with expected summer
and winter seasonal patterns and distinctive summer peaks. Despite the declining trend, summer loads have
become more volatile and peakier. The three-year 2018 ESOO maximum demand forecast shown is stationary
with a wide distribution of possible annual maximums; this distribution reflects the wide variety of annual
weather and coincident customer behaviour observed in South Australia. There may a positive bias due to the
over forecast of customers, and a negative bias from the over-forecast of PV. The 2019 summer maximum fell
just above the 10% POE forecast, consistent with the hot weather observed over the period. While only one
year out; the forecast appears to have captured the summer maximum trends well.

© AEMO 2019 Summer 2019 Forecast Accuracy Update                                                                  17
Figure 11 South Australian demand history compared to neutral forecast, summer 2016 –
summer 2021
Table 7 describes the demand and temperature characteristics of the observed maximum demand relative to
forecast. The actual rooftop PV output was within the 10th – 90th percentile range of the forecast simulations
and the observed temperature and heatwave index fell within the 10% POE simulated temperature range, as
expected.
Table 7 South Australian summer 2019 maximum demand and temperature actual compared to
forecast
2019 Summer Actual Forecast Forecast Forecast
90% POE 50% POE 10% POE
Maximum demand – sent out (MW) 3,277 2,614 2,901 3,176
Rooftop PV at time of max demand (MW) 26 0-334
Temperature at time of maximum demand (°C) 44.3 36.4-40.3 38.1-42.1 40.5-44.4
3-day rolling heatwave index (°C) 13.1 2.0-10.9 5.0-10.9 5.6-14.3
Figure 12 shows the relationship between daily maximum demand and daily maximum temperature observed
at the Adelaide (Kent Town) weather station. In 2019, the day of maximum demand coincided with the day of
maximum temperature by a significant margin.
© AEMO 2019 Summer 2019 Forecast Accuracy Update 18Figure 12 South Australia demand and daily maximum temperature scatterplot, summer 2019. 3.6 Tasmania The electrical demand from Tasmania, shown in Figure 13, has an increasing trend, with a single period of high demand throughout winter. The summer load is not of significance to Tasmania but is rising slowly over the forecast period. The 2019 summer maximum fell just below the 90% POE forecast. While only one year out, the forecast appears to have captured the summer maximum trends well. Figure 13 Tasmania demand history compared to neutral forecast, summer 2016 – summer 2021 Table 8 describes the demand and temperature characteristics of the observed maximum demand relative to forecast. The actuals for Tasmania are not a good match for the forecast simulation ranges, which predict a summer maximum at a time that is winter-like. In summer 2019, winter-like conditions did not occur, resulting in a truer summer peak. © AEMO 2019 Summer 2019 Forecast Accuracy Update 19
Table 8           Tasmania summer 2019 maximum demand and temperature actual compared to forecast
 2019 Summer                                           Actual           Forecast        Forecast        Forecast
                                                                        90% POE         50% POE         10% POE

 Maximum demand – sent out (MW)                                 1,312          1,322           1,344               1,371

 Rooftop PV at time of max demand (MW)                            63                                               0-16

 Temperature at time of maximum demand (°C)                     23.8         9.2-15.0       10-5-17.8        8.5-13.3

 3-day rolling heatwave index (°C)                               3.3           0-0.7           0-2.4           0-0.6

Figure 14 shows the relationship between daily maximum demand and daily maximum temperature observed
at the Hobart (Ellerslie Road) weather station. As demand is not driven substantially by high temperatures, the
relationship is weak, and summer maximum demand did not occur on the hottest day.

Figure 14         Tasmania demand and daily maximum temperature scatterplot. Summer 2019.

3.7         Victoria
The electrical demand from Victoria, shown in Figure 15, has been relatively stationary over the last few years,
with expected summer and winter seasonal patterns and distinctive summer peaks. The three-year 2018
ESOO forecast shown is also stationary with a wide distribution of possible annual maximums; this distribution
reflects the wide variety of annual weather and coincident customer behaviour observed in Victoria. The 2019
summer maximum fell between the 50% POE and 10% POE, consistent with the hot weather observed over
the period. While only one year out; the forecast appears to have captured the summer maximum trends well.

© AEMO 2019 Summer 2019 Forecast Accuracy Update                                                                       20
Figure 15 Victoria demand history compared to neutral forecast, summer 2016 – summer 2021
Table 9 describes the demand and temperature characteristics of the observed maximum demand relative to
forecast. The actual rooftop PV output was towards the upper end of the percentile range of the forecast
simulations and the observed temperature and heatwave index fell within the 10% POE simulated range, as
expected.
Table 9 Victoria summer 2019 Maximum demand and temperature actual compared to forecast
2019 Summer Actual Forecast Forecast Forecast
90% POE 50% POE 10% POE
Maximum demand – sent out (MW) 9,405 8,366 8,983 9,764
Rooftop PV at time of max demand (MW) 841 209-883
Temperature at time of maximum demand (°C) 42.3 33.3-38.3 36.5-40.6 40.4-42.9
3-day rolling heatwave index (°C) 7.5 2.5-9.1 3.7-9.9 6.0-11.9
Figure 16 shows the relationship between daily maximum demand and daily maximum temperature observed
at the Melbourne (Olympic Park) weather station. In 2019, the day of maximum demand coincided with the
day of maximum temperature, however there were several other contenders at lower temperatures.
© AEMO 2019 Summer 2019 Forecast Accuracy Update 21Figure 16 Victoria demand and daily maximum temperature scatterplot, summer 2019.
3.8 Demand forecast improvements
In all regions except Queensland, the 2018 ESOO model specification and assumptions produced appropriate
outcomes. To better reflect the demand trends evident amongst the regions, AEMO is implementing several
forecasting process improvements, including the development of several modelling techniques that will be
used together as an ensemble.
In 2018 and before, AEMO used a single half hourly demand model that was simulated to sample the range
of maximums. In 2019, AEMO has tested two additional demand models that will be considered alongside the
half hourly model:
1. Half-hourly demand model (current model)
2. Weekly Generalised Extreme Value (GEV) model simulation
3. Annual Generalised Extreme Value point process model fitted to daily maximums8
While the half-hourly model is better at forecasting the transition in timing of demand due to disruptive
technology such as PV, battery systems and electric vehicles; higher resolution models have greater
variability. The GEV models are better at forecasting short-term maximum demand (1-3 years ahead) but are
unlikely to capture complex interactions between variables evident longer term. These models will be
compared to develop an ensemble forecast, harnessing the strengths of each model over the forecast
horizon.
Queensland
For the 2018 ESOO, only the half-hourly demand model was used. Using the default model specification at
that time, maximums in summer 2018 were considered to be within normal ranges driven by variance in
coincident customer behaviour. With another year of observations, it is now evident that coincident customer
behaviour is changing and is not just a statistical fluctuation. The new pattern observed is representative of
behavioural change whereby customers generally conserve electricity but have a reduced tolerance to heat
on extreme days. There may also be an interaction with the lower prices observed during recent periods of
high demand relative to history, whereby price exposed customers now have less incentive to reduce
consumption in response.
8
Li, Y & Jones, B. The use of extreme value theory for forecasting long-term substation maximum electricity demand. 2019.
© AEMO 2019 Summer 2019 Forecast Accuracy Update 22The Queensland half-hourly demand model will therefore be updated to include variables that will reflect this
new pattern in coincident customer behaviour. Additionally, the new weekly GEV model will capture this
emerging trend, as it focuses only on weekly maximum demand. The focus on weekly maximum demand
allows greater explanation of the maximums without having to explain the complex interactions between
variables at the half-hour level, increasing short term accuracy. Combined, the use of a model ensemble and
model specification changes are expected to result in an upward revision to the Queensland forecast in the
2019 ESOO.
Progress against improvements identified in 2018 Forecast Accuracy Report
Beyond the additional demand models, other improvements were scheduled in the 2018 Forecast Accuracy
Report9 that are still relevant. These improvements are shown in Table 10.
Table 10 Demand forecast improvements from the 2018 Forecast Accuracy Report
Observation Action already taken Further actions to be taken
Improve ability to explain Increased information provided in Retain more modelling data for
forecast differences the 2018 Forecast Accuracy better explanation of non-
Report, prepared a new summer weather-related coincident
update, and consulted with behaviour explanation. Further
industry on new performance stakeholder and academic
metrics that could be used to consultation on the forecast
measure accuracy of probabilistic accuracy report requirements.
forecasts.
Forecast values fluctuate Doubled simulations in 2018 to Same as 2018 or more
between forecast years smooth forecasts between years. simulations.
Need to understand Improved modelling of climate Further improvements to model
interaction of weather change, particularly extreme formulation, considering other
variables, including temperature and heatwave combinations of weather
subregional weather trends. variables, enabled by greater
access to climate and weather
data.
Poor distribution alignment in Reformulated model – POE Continuous review of model
some regions. spread more representative of formulation, and inclusion of an
historical values. ensemble of models to improve
accuracy, particularly in
Queensland
9
AEMO. 2018 Forecast Accuracy Report. https://www.aemo.com.au/-/media/Files/Electricity/NEM/Planning_and_Forecasting/Accuracy-Report/Forecast-
Accuracy-report-2018.pdf
© AEMO 2019 Summer 2019 Forecast Accuracy Update 234. Supply forecasts
Generator supply availability is particularly important in reliability studies given it is commonly a key driver of
Unserved Energy (USE) estimates. Supply forecasts are therefore assessed by the degree to which capacity
availability estimated in the 2018 ESOO matched actual generation availability. To achieve this goal AEMO
developed a method to compare 2018 ESOO simulations with historical observations during extreme
temperature periods in summer 2019.
Extreme temperature periods are likely to align closely with periods of very high demand, possible derating
and possible supply shortfalls. These periods allow exploration of forecast versus actual supply availability
considering:
• Available capacity considering de-rating.
• Full unplanned outages.
• Partial unplanned outages.
The method for assessing supply forecast performance involves:
• Selecting historical availability data for the 10 hottest days over summer 2018 and summer 2019 per
region.
– Eight intervals were chosen per day including the time of maximum temperature and the seven half-
hour periods that followed.
– This selection of historical data was used to observe generator performance at times of high
temperature. High temperature periods are very likely to be linked with periods of tight supply-
demand balance and also represent periods where the physical capability of generator units is most at
risk of physical issues including temperature derating.
– Units with availability below their listed seasonal availability during these periods are assumed to be
experiencing a partial or full outage, rather than a strategic withdrawal of capacity.
• Selecting equivalent forecast availability from 2018 ESOO simulations.
– Simulated availability was taken from 1,000 samples of 10 random days/iterations. The availability data
from these days is taken from the maximum temperature period and the seven half-hourly periods that
follow (this is to match the number of hours with historical). The 97.5th and 2.5th percentiles of the
simulation outcomes are shown to represent the forecast band and eliminate outliers that may occur
with very low probabilities.
• Aggregating historical and forecast data for comparison with respect to generation fuel types and regions,
plotting duration curves to compare the data sets.
– Historical trends per fuel type were cleaned such that only units currently operating were considered.
Capacity
AEMO models the capabilities of generators by applying inputs sourced from market participants. The
maximum capacity of each generating unit is provided by market participants through the Generation
Information survey process. Through this process, each participant provides expected summer and winter
available capacity over the 10-year modelling horizon. These capacities represent the expected capability
during temperatures consistent with a 10% POE maximum demand in each region.
© AEMO 2019 Summer 2019 Forecast Accuracy Update 24Unplanned Outages
Generators are assumed to be available at their summer or winter capacity unless they experience an
unplanned outage. Planned outages are not modelled in the ESOO, because these are assumed to be
planned in lower demand periods or shifted if low reserve conditions occurred so should not impact USE
outcomes in summer.
AEMO collects information from all generators on the timing, duration, and severity of unplanned outages,
via an annual survey process. This data is used to calculate the probability of full and partial unplanned
outages, which are then applied randomly to each unit in the ESOO modelling. To protect the confidentiality
of this data, AEMO may publish calculated outage parameters for a number of technology aggregations.
The rates used by AEMO in the 2018 ESOO are shown in Table 11:
Table 11 Outage and derating rates used in 2018 ESOO.
Full Unplanned Partial Unplanned Partial derating (%)
Outage Rate (%) Outage Rate (%)
Brown coal- VIC 5.34 13.32 19.18
Black coal- QLD 2.42 13.51 16.94
Black coal- NSW 6.56 25.81 19.98
CCGT 1.33 0.36 42.76
OCGT 3.56 0.28 26.91
Steam turbine 4.58 11.25 22.85
Hydro 1.59 0.01 17.26
The performance of the forecast unplanned outage rates and availabilities is shown in the following sections.
The regions and fuel types that contribute most substantially to supply availability are shown, excluding some
minor contributors.
© AEMO 2019 Summer 2019 Forecast Accuracy Update 254.1 New South Wales black coal generation availability Black coal generation in New South Wales has had consistent rates of unplanned outages, although partial unplanned outages have been rising. Figure 17 shows how the rates of unplanned outages have changed over time relative to the 2018 ESOO assumptions. Figure 17 New South Wales black coal historic unplanned outage rates Figure 18 shows the availability over the top 10 hottest days slightly exceeded the simulated availability. Figure 18 New South Wales black coal supply availability – top 10 hottest days Despite the number of partial unplanned outages exceeding expectation, the observed availability was above forecast. The maximum temperature over the top 10 days in New South Wales in 2018-19 was between 36.0 and 39.6° and did not exceed the reference temperature upon which further derating is expected. It is likely that some generators exceeded their rated summer capacities and the effective outage rate during the high temperature periods was lower than average outage rates throughout the year. © AEMO 2019 Summer 2019 Forecast Accuracy Update 26
4.2         Queensland black coal generation availability
Black coal generation in Queensland has had relatively consistent rates of unplanned outages, and slowly
growing rates of partial unplanned outages. Figure 19 shows how the rates of unplanned outages have
changed over time relative to the 2018 ESOO assumptions.

Figure 19         Queensland black coal historic unplanned outage rates

Figure 20 shows the availability over the top 10 hottest days was less than the simulated availability.

Figure 20         Queensland black coal supply availability – top 10 hottest days

The observed availability in 2018-19 is lower than the simulated range due to outages and/or unavailable
capacity at several units. Queensland has a surplus of available capacity relative to maximum demand, so
there are periods where capacity may not be offered as available, as it was not required despite the extreme
temperature.

© AEMO 2019 Summer 2019 Forecast Accuracy Update                                                           27
4.3         Victorian brown coal generation availability
Brown coal generation in Victoria has a strong upward trend in full unplanned outages, and rates of partial
unplanned outages have been relatively stationary before 2018-19. Figure 21 shows how the rates of
unplanned outages have changed over time relative to the 2018 ESOO assumptions.

Figure 21         Victorian brown coal historic unplanned outage rates

Because the assumptions used in the 2018 ESOO are fitted to historical observed outage rates, the outage
assumption was lower than the observed full outage rate.
Figure 22 shows the availability over the top 10 hottest days was less than the simulated availability. In 2018-
19, the observed availability was at times lower than the simulated range and was generally at the lower end
of the simulated range for the poorest performing days. This was due to multiple, coincident outages during
these high temperature days.
One of the outages occurring on two of the high temperature days was a planned outage. It was assumed in
the 2018 ESOO that this outage would have been conducted in a lower risk period, typically before the start
of summer. However, in this case, overdue and urgent maintenance was planned for 19-26 January where, at
the time, no lack of reserves were forecast. As planned outages are not included in the calculation of the
unplanned outage rate, a second line has been added (the dotted orange line) to show the effect, should the
unit have been fully available. Victorian brown coal outages are considered to be one of the primary causes
of the 25th January 2019 Victorian load shedding event.

Figure 22         Victorian brown coal supply availability – top 10 hottest days

© AEMO 2019 Summer 2019 Forecast Accuracy Update                                                               28
4.4         Hydro generation availability
Hydro generation has had consistent rates of unplanned outages, and almost no partial unplanned outages.
Figure 23 shows how the rates of unplanned outages have changed over time relative to the 2018 ESOO
assumptions.

Figure 23         Hydro historic unplanned outage rates

Figure 24 shows the availability over the top 10 hottest days was broadly consistent with the 2018 ESOO
simulation for mainland NEM hydro generation.

Figure 24         Mainland hydro supply availability – top 10 hottest days

© AEMO 2019 Summer 2019 Forecast Accuracy Update                                                           29
4.5              Gas and liquid fuel generation availability
For gas-fired and liquid-fired generators10, the mainland NEM has been considered in aggregate. As Figure 25
shows, observed availability has tended towards the upper bound of the 2018 ESOO simulation range.

Figure 25                 Gas and liquid supply availability – top 10 hottest days

The main reason observed availabilities are higher than simulated outcomes is that many generators
outperformed their rated summer capacity. Seasonal availabilities are provided to AEMO with respect to
certain reference temperatures. The majority of the periods used in this analysis are below the reference
temperatures, while the model always assumes the provided capacity limits. Future improvements to the
modelling of seasonal capacity will be investigated, provided in Section 4.9. Beyond the variation in observed
available capacity, outage rates were as expected.

4.6              New South Wales intermittent generation availability
All intermittent generation, including large scale grid solar PV and wind in New South Wales was considered
in aggregate. Intermittent generation is modelled differently from thermal and hydro generation because
periods of low or no demand are simulated using historical load traces. As Figure 26 shows, the 2018 ESOO
simulated a wide band of possible intermittent generation for New South Wales on the 10 hottest days, based
on these historical traces, and observed output for summer 2019 was within the simulation range.

Figure 26                 New South Wales intermittent generation availability – top 10 hottest days

10
     This aggregation includes OCGTs, CCGTs, gas-fired steam turbines, and liquid-fuelled generation (except those in Tasmania)

© AEMO 2019 Summer 2019 Forecast Accuracy Update                                                                                  30
Table 12 shows the forecast and actual characteristics of all intermittent generation for New South Wales in
summer 2019. Total summer capacity was less than the 2018 ESOO forecast, as a new facility was behind
schedule in commissioning all capacity.
Table 12 New South Wales intermittent generation capacity, forecast and actual.
February 2019 Facilities operating Total summer Output during top 10
(count) capacity (MW) hottest days relative
to summer capacity
2018 ESOO forecast 20 1,871 9%-88%
Actual11 20 1,768 26%-57%
4.7 South Australian intermittent generation availability
All intermittent generation for South Australia has been considered in aggregate. As Figure 27 shows below,
the 2018 ESOO simulated a wide band of possible intermittent generation for South Australia on the 10
hottest days and observed output for summer 2019 tended towards the lower end of the simulation range.
Figure 27 South Australian intermittent generation availability – top 10 hottest days
Table 13 shows the forecast and actual characteristics of all intermittent generation for South Australia in
summer 2019. Total summer capacity was less than the 2018 ESOO forecast, as multiple facililties were behind
schedule in commissioning all capacity.
Table 13 South Australia intermittent generation capacity, forecast and actual.
February 2019 Facilities operating Total summer Output during top 10
(count) capacity (MW) hottest days relative
to summer capacity
2018 ESOO forecast 23 2,012 7%-83%
Actual11 23 1,856 9%-69%
11
Total summer capacity is estimated based on available data. Actual capacity may be lower due to hold points imposed during commissioning.
© AEMO 2019 Summer 2019 Forecast Accuracy Update 314.8 Victorian intermittent generation availability
All intermittent generation for Victoria was considered in aggregate. As Figure 28 shows, the 2018 ESOO
simulated a wide band of possible intermittent generation for Victoria on the 10 hottest days, and observed
output for summer 2019 was within the simulation range.
Figure 28 Victorian intermittent generation availability – top 10 hottest days
Table 14 shows the forecast and actual characteristics of all intermittent generation for Victoria in summer
2019. Total summer capacity was less than the 2018 ESOO forecast, as several facililties were behind schedule
in commissioning all capacity, while one smaller facility began partial operation ahead of schedule.
Table 14 Victoria intermittent generation capacity, forecast and actual.
February 2019 Facilities operating Total summer Output during top 10
(count) capacity (MW) hottest days relative
to summer capacity
2018 ESOO forecast 19 1,977 8%-84%
Actual11 19 1,881 12%-66%
© AEMO 2019 Summer 2019 Forecast Accuracy Update 324.9 Supply forecast improvements
For the majority of regions and fuel types, the assumptions used in the 2018 ESOO delivered aggregate
availability estimates that were appropriate. For Victorian brown coal however aggregate availability was
overestimated, due to the combination of outages and a planned outage.
Several categories showed trends in the unplanned outage rate. This rate is a combination of two factors:
• The count/frequency of unplanned outages,
• The mean time to repair (MTTR).
In most cases, the trend was driven entirely by the MTTR as shown in Figure 29.
Figure 29 Estimated mean time to repair in hours by region and fuel type
There are many possible explanations for the increasing repair time including:
• More complex fault types, which might be indicative of ageing plant.
• Changed business process regarding the urgency of unplanned faults.
• A statistical abnormality.
With respect to brown coal, the trend is so strong that it can no longer be considered a statistical
abnormality. A standard t-test with full unplanned outage rates sampled for 2010-11 to 2014-15 and 2015-16 to
2018-19 indicates less than 1% probability that the two samples are from the same population.
In 2018, AEMO implemented unplanned outage rates that were the average rate of the last three years. In
2019, a similar period is under consideration. This method was developed on the principle that recent
maintenance spend would affect outage rates and would be best reflected in more recent performance.
For most plant this will be appropriate, but where there is a strong trend, further consideration will be given
to better capture changes attributable to equipment ageing and/or business process changes. Generator
owners can provide alternative rates with reasoning and are encouraged to do so if it is believed their rate will
be different over the forecast horizon.
AEMO also intends to make modifications to the simulation of unplanned outage rates to better capture the
uncertainty and variation observed in the history, as detailed in the Retailer Reliability Obligation Issues
Paper12.
12
AEMO. Reliability forecasting methodology issues paper. http://aemo.com.au/Stakeholder-Consultation/Consultations/Reliability-Forecasting-
Methodology-Issues-Paper
© AEMO 2019 Summer 2019 Forecast Accuracy Update 33You can also read