Impact of VOCs and NOx on Ozone Formation in Moscow - MDPI
←
→
Page content transcription
If your browser does not render page correctly, please read the page content below
atmosphere
Article
Impact of VOCs and NOx on Ozone Formation
in Moscow
Elena Berezina *, Konstantin Moiseenko, Andrei Skorokhod, Natalia V. Pankratova, Igor Belikov,
Valery Belousov and Nikolai F. Elansky
 A.M. Obukhov Institute of Atmospheric Physics, Russian Academy of Sciences, 119017 Moscow, Russia;
 konst.dvina@gmail.com (K.M.); skorokhod@ifaran.ru (A.S.); n_pankratova@list.ru (N.V.P.); uawgr@mail.ru (I.B.);
 binomod@gmail.com (V.B.); n.f.elansky@mail.ru (N.F.E.)
 * Correspondence: e_berezina_83@mail.ru

 Received: 7 October 2020; Accepted: 19 November 2020; Published: 23 November 2020

 Abstract: Volatile organic compounds (VOCs), ozone (O3 ), nitrogen oxides (NOx), carbon monoxide
 (CO), meteorological parameters, and total non-methane hydrocarbons (NMHC) were analyzed from
 simultaneous measurements at the MSU-IAP (Moscow State University—Institute of Atmospheric
 Physics) observational site in Moscow from 2011–2013. Seasonal and diurnal variability of the
 compounds was studied. The highest O3 concentration in Moscow was observed in the summer
 daytime periods in anticyclonic meteorological conditions under poor ventilation of the atmospheric
 boundary layer and high temperatures (up to 105 ppbv or 210 µg/m3 ). In contrast, NOx, CO, and
 benzene decreased from 8 a.m. to 5–6 p.m. local time (LT). The high positive correlation of daytime
 O3 with secondary VOCs affirmed an important role of photochemical O3 production in Moscow
 during the summers of 2011–2013. The summertime average concentrations of the biogenic VOCs
 isoprene and monoterpenes were observed to be 0.73 ppbv and 0.53 ppbv, respectively. The principal
 source of anthropogenic VOCs in Moscow was established to be local vehicle emissions. Yet, only
 about 5% of the observed isoprene was safely attributed to anthropogenic sources, suggesting
 significant contribution of biogenic sources into the total levels of ozone precursors. The non-linear
 O3 –NOx dependence shows a decrease in ground-level O3 with an increase in NOx during the
 summers of 2011–2013, which is typical for the VOC-sensitive photochemical regime of O3 formation.
 Nevertheless, during the elevated ozone episodes in July 2011, the photochemical regime of ozone
 production was either transitional or NOx-sensitive. Contribution of various anthropogenic and
 biogenic VOCs into the measured ozone values was evaluated. The ozone-forming potential (OFP) of
 total VOCs was 31–67 µg/m3 on average and exceeded 100 µg/m3 in the top 10% of high ozone events,
 reaching 136 µg/m3 . Acetaldehyde, 1.3-butadiene, and isoprene have the highest ozone production
 potential in Moscow compared to that of other measured VOCs.

 Keywords: air pollution; ozone production; volatile organic compounds; atmospheric photochemistry

1. Introduction
     Ozone (O3 ) is one of the most important secondary pollutants of the atmosphere for a variety of
environmental conditions ranging from heavily polluted urban atmospheres to remote areas subjected
to the impact of regional (biomass burning) and distal sources of ozone precursors through long-range
transport [1,2]. In cities, O3 is mainly formed from complex photochemical interactions of volatile
organic compounds (VOCs) and nitrogen oxides (NOx) [3–6]. VOCs help in oxidizing primary NO
released from various sources to form NO2 and in retaining the existing ozone by competing with
ozone to react with NO [6]. Reductions in VOCs emissions from local and/or upwind sources will
decrease ambient ozone formation (and ground-level ozone concentrations) in VOC-sensitive areas

Atmosphere 2020, 11, 1262; doi:10.3390/atmos11111262                          www.mdpi.com/journal/atmosphere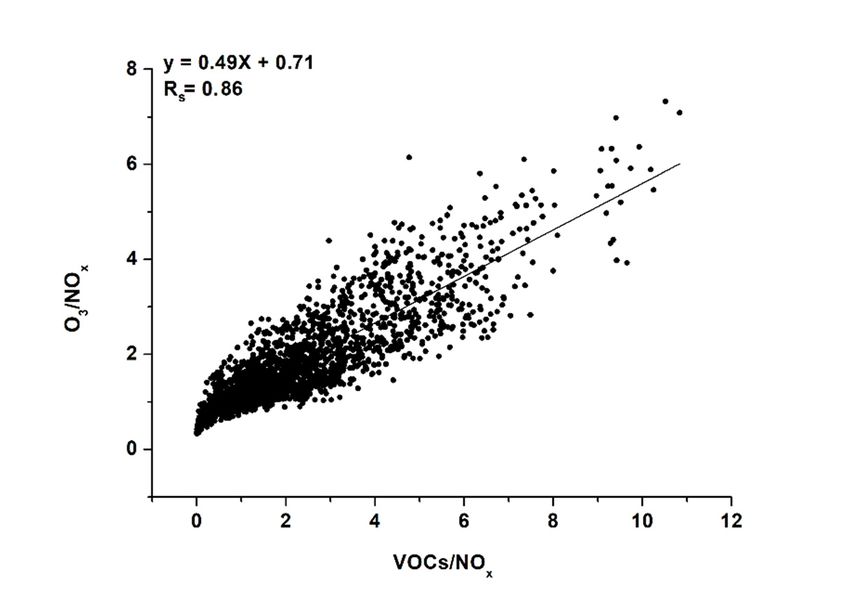
Atmosphere 2020, 11, 1262                                                                             2 of 16

but increase ozone production in NOx-sensitive areas. On the other hand, controls of NOx emissions
will decrease ozone formation in areas with the NOx-sensitive regime but increase ozone formation in
VOC-sensitive areas [6–11].
      Downwind from climatically important atmospheric pollution sources, ozone production is
largely NOx-sensitive at a regional scale, though urban areas with high NOx emissions are frequently
VOC-sensitive [10,12]. However, some observation-based studies [4,6,10,11,13] have shown that O3
production in an urban environment can also be NOx-sensitive or at least have a mixed (transitional)
regime [5,6,8,12–18]. The latter may indicate that ozone production in cities is sensitive to specific
meteorological conditions affecting a VOC/NOx ratio through a vertical mixing in the planetary
boundary layer for a given strength of ozone precursor emission sources. Hence, a closer study of
high ozone events in large cities is important for choosing an effective ozone control strategy through
reduction of VOCs and/or NOx emissions [10,12].
      Ozone concentrations higher than 50 ppbv have a detrimental effect on plants, and levels higher
than 100 ppbv cause irreversible changes in the human respiratory system [19]. High air temperature
and low wind speeds create the most favorable conditions for ozone photochemical production in
Moscow, as in other world megacities, with the daytime ozone levels frequently exceeding its maximum
allowable concentration (MAC = 80 ppbv or 160 µg/m3 ). Ozone concentrations exceeding the MAC
were recorded in Moscow under strong anticyclonic conditions [20–26].
      Despite a significant reduction of industrial plants in Moscow over recent decades, the problem of
air pollution continues to be urgent due to the rapid and steady growth of the city’s car fleet and the
expansion of the motorway area. Hence, understanding the relationship between ozone production and
its precursors as well as their impact on ozone generation is important for development of an effective
ozone control strategy. We studied diurnal and seasonal variability of ozone and its precursors in the
surface air in Moscow; determined the regime of ozone generation; and quantified the contribution of
anthropogenic and biogenic VOCs to O3 generation in polluted urban air.

2. Experiments
      Ground level concentrations of various species including VOCs (acetaldehyde, ethanol,
1.3-butadiene, acetone, acetic acid, isoprene, MVK + MACR (isoprene products), benzene, 2-methyl-3-
buten-2-ol (MBO), toluene, phenol, styrene, C8-aromatics, C9-aromatics, and monoterpenes) and
meteorological parameters (air temperature, atmospheric pressure and humidity, solar radiation, wind
speed and direction, cloud height, and rainfall amount) were simultaneously measured (Table 1) at the
joint ecological station of the Obukhov Institute of Atmospheric Physics, Russian Academy of Sciences,
and the Geographic Faculty of Moscow State University (MSU-IAP) [20]. The site is located in the
southwestern part of Moscow (about 8 km away from the city center) in the green area of the Botanical
Gardens of Moscow State University. The nearest roads with intense traffic are about 300–450 m away
from the site.

      Table 1. The compounds measured at the Institute of Atmospheric Physics, Russian Academy of
      Sciences, and the Geographic Faculty of Moscow State University (MSU-IAP) site. NOx: nitrogen
      oxide; O3 : ozone; CO: carbon monoxide; NMHC: non-methane hydrocarbons; VOCs: volatile
      organic compounds.

   Compound          Instrument                                        Response Time, s   Range Limits
   NOx, ppbv         TE42C-TL (Thermo Inc., USA)                       60                 0.05–200
   O3 , ppbv         1008AH (Dasibi Inc., USA)                         60                 1–1000
   CO, ppmv          TE48S (Thermo Inc., USA)                          60                 0.05–10
   NMHC, µ/m3        APHA-360 (Horiba Inc., Japan)                     60                 0.1–100
   VOCs, ppbv        Compact PTR-MS (Ionicon Analytic GmbH, Austria)   0.5/each comp.     0.05–1000

     The measurements at the MSU-IAP site corresponded to the State Standards [27] and satisiued the
international requirements for measuring systems operating at the Global Atmospheric Watch network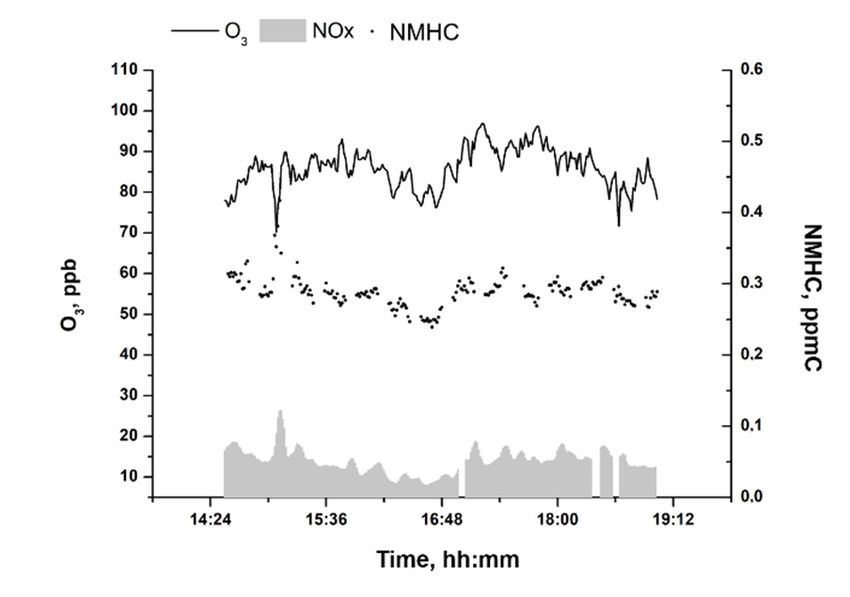
The measurements at the MSU-IAP site corresponded to the State Standards [27] and satisiued
the international requirements for measuring systems operating at the Global Atmospheric Watch
network of the World Meteorological Organization (GAW WMO) (see [28,29] for the complete
Atmosphere
description      11,the
           2020,of   1262measurement devices). One-hour averages of the measured compounds3are
                                                                                           of 16used

in the subsequent discussion.
of the World Meteorological Organization (GAW WMO) (see [28,29] for the complete description
3. Results
of the measurement devices). One-hour averages of the measured compounds are used in the
subsequent discussion.
3.1. Diurnal and Seasonal Variability of Inorganic and Organic Species
3. Results
      According to Figure 1a, the highest daytime ozone levels in Moscow were observed from April
3.1. Diurnal following
to August,    and Seasonalclosely the annual
                            Variability         cycleand
                                        of Inorganic  of the   totalSpecies
                                                          Organic    intensity of solar UV radiation measured at
the MSU-IAP site [30–32]. The observed abrupt increase of ozone levels in early spring, peaking in
      According to Figure 1a, the highest daytime ozone levels in Moscow were observed from April
April, is a general feature of ozone climatology over the continent as evidenced from a variety of
to August, following closely the annual cycle of the total intensity of solar UV radiation measured
ozone measurements in both polluted and background environments [33,34]. It has been suggested
at the MSU-IAP site [30–32]. The observed abrupt increase of ozone levels in early spring, peaking
previously that the accumulation of ozone precursors during the cold season at northern latitudes
in April, is a general feature of ozone climatology over the continent as evidenced from a variety of
provides a great potential for intense production of ozone under rapid increases of solar UV
ozone measurements in both polluted and background environments [33,34]. It has been suggested
radiation in late winter and into early spring (see more discussion in [20,34,35]). It is likely that the
previously that the accumulation of ozone precursors during the cold season at northern latitudes
observed springtime ozone maximum at MSU-IAP has two primary contributions, which are the
provides a great potential for intense production of ozone under rapid increases of solar UV radiation
large-scale
in late wintertropospheric
                and into earlychemistry
                                 spring (seeandmorelocal  ozone in
                                                     discussion    photochemical
                                                                      [20,34,35]). It isproduction    in observed
                                                                                         likely that the  the polluted
boundary     layer under    sufficient  abundance    of  odd   nitrogen      species. Another
springtime ozone maximum at MSU-IAP has two primary contributions, which are the large-scale    distinct feature    of the
MSU-IAP ozone
tropospheric           seasonal
               chemistry           cycle
                            and local      is aphotochemical
                                       ozone      prolonged spring–summer
                                                                 production in themaximum           [28,35,36],
                                                                                        polluted boundary         which
                                                                                                              layer
undoubtedly      reflects  the primary     contribution    of  large   local    sources  of  ozone
under sufficient abundance of odd nitrogen species. Another distinct feature of the MSU-IAP ozone   precursors     in the
photochemically
seasonal  cycle is aactive   period
                      prolonged       (April–September)
                                  spring–summer      maximum [34] [28,35,36],
                                                                   and not the      downward
                                                                                  which          ozonereflects
                                                                                        undoubtedly      flux from
                                                                                                                 the the
stratosphere     and    continental-scale     transport    from    other      potentially   important
primary contribution of large local sources of ozone precursors in the photochemically active period     areas    of net
photochemical production
(April–September)     [34] and notoftheozone
                                        downwardin the   western
                                                     ozone           parttheofstratosphere
                                                             flux from            North Eurasia.     Over the whole
                                                                                             and continental-scale
observation
transport  fromperiod,
                  other the  highest important
                         potentially   ozone levels   were
                                                   areas      observed
                                                          of net             in July 2011,
                                                                  photochemical             when daytime
                                                                                      production  of ozone O      mixing
                                                                                                             in3 the
ratios exceeded
western             the short-time
         part of North                MACthe
                           Eurasia. Over     (80whole
                                                  ppb orobservation     3 ). Thesethe
                                                           160 μg/m period,         episodes
                                                                                       highestare  described
                                                                                               ozone           in detail
                                                                                                       levels were
observed
below. in July 2011, when daytime O3 mixing ratios exceeded the short-time MAC (80 ppb or
160 µg/m3 ). These episodes are described in detail below.

     Figure 1. Seasonal variation of daytime O3 (a) and NOx (b) concentrations in Moscow from 2011 to
     Figure 1. Seasonal variation of daytime O3 (a) and NOx (b) concentrations in Moscow from 2011 to
     2013 (MSU-IAP data).
     2013 (MSU-IAP data).
     Seasonal daytime NOx variation is opposite to that of O3 (Figure 1b) with the highest values being
     Seasonal
observed         daytime
           in winter (up toNOx    variation
                             130 ppbv).        is opposite
                                          In summer,           to thatusually
                                                        NOx levels      of O3 did
                                                                               (Figure   1b) with
                                                                                    not exceed      the highest
                                                                                               30 ppbv.           values
                                                                                                         Evidently,
being
the    observed
    observed       in winter
               four-fold       (up in
                          increase to wintertime
                                      130 ppbv). NOx In summer,       NOx
                                                            levels with     levelstousually
                                                                          respect            did not
                                                                                     the summer       exceed
                                                                                                   values      30 ppbv.
                                                                                                          is a local
Evidently, theofobserved
manifestation                 four-foldinincrease
                   seasonal variations                in wintertime
                                            vertical mixing     intensityNOx    levels with
                                                                           and associated     respect toresidence
                                                                                            atmospheric   the summer
valuesofispollutants
times       a local manifestation     of seasonal
                      in the lower troposphere     overvariations    in vertical mixing intensity and associated
                                                          the continent.
     Since theresidence
atmospheric     origin of the  observed
                            times         enhanced
                                  of pollutants    in levels  of ozone
                                                       the lower         in Moscow
                                                                    troposphere       during
                                                                                   over       the summer months
                                                                                         the continent.
is photochemical
     Since the origin of the observed enhanced levels of ozone in Moscow duringtothe
                    generation,  we focus   below  on   the  summertime     period  of the observations     explore
                                                                                                                summer
some
monthsbasic  features of the urban
          is photochemical           ozone photochemistry.
                               generation,    we focus below on the summertime period of the observations
     Meteorological
to explore   some basicobservations
                          features ofat the
                                        the MSU-IAP
                                             urban ozone site during  the summers of 2011–2013 (Figure 2) show
                                                              photochemistry.
favorable conditions for accumulation of ozone precursors in the surface air and active photochemistry
during a substantial part of the summer months. In the observed period, daytime air temperature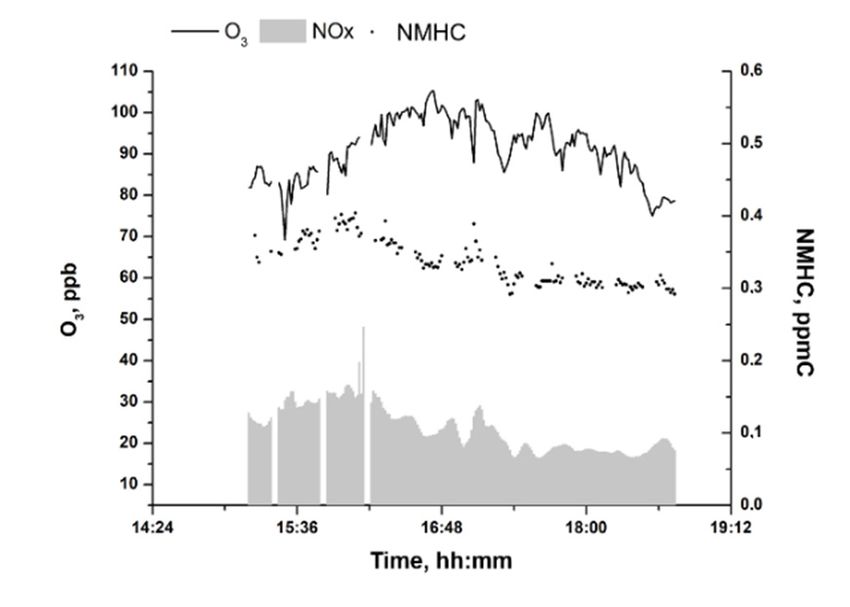
Atmosphere 2020, 11, x FOR PEER REVIEW 4 of 17
Meteorological
Atmosphere observations at the MSU-IAP site during the summers of 2011–2013 (Figure4 of
2020, 11, 1262 2)16
show favorable conditions for accumulation of ozone precursors in the surface air and active
photochemistry during a substantial part of the summer months. In the observed period, daytime air
often reached 25–30 ◦ C. Wind speeds were ≤2 m/s on average and exceeded 3 m/s only in 5% of the
temperature often reached 25–30 °C. Wind speeds were ≤2 m/s on average and exceeded 3 m/s only
whole observation time, thus evidencing generally stagnant meteorological conditions. The prevailing
in 5% of the whole observation time, thus evidencing generally stagnant meteorological conditions.
wind
The directions
prevailing were
windfrom W andwere
directions NWfrom
to N,Wwhich
and correspond to thecorrespond
NW to N, which transport oftorelatively cleanof
the transport air,
subjected to a limited impact of regional pollution sources.
relatively clean air, subjected to a limited impact of regional pollution sources.
Figure2.2. Wind
Figure Wind speed,
speed, wind rose and
and maximum
maximum daytime
daytime air
air temperature
temperaturefrom
from3-h
3-hMSU-IAP
MSU-IAP
observations during the summers of 2011–2013. Down arrows are elevated ozone (>80 ppbv)
observations during the summers of 2011–2013. Down arrows are elevated ozone (>80 ppbv) episodes.
episodes.
According to Figure 3, O3 mixing ratio increases monotonically from early morning, reaching its
maximum According
valuetoofFigure
34 ppbv3, O(sample
3 mixingmean)
ratio increases
at ~4 p.m.monotonically
LT The diurnalfromvariations
early morning, reaching
of NOx, its
CO, and
maximum
benzene, thevalue
latterofbeing
34 ppbv (sample mean)
an important ozone atprecursor
~ 4 p.m. LT Theanthropogenic
with diurnal variations of NOx,
origin, CO, andto
are opposite
benzene, the latter being an important ozone precursor with anthropogenic
that of O3 and characterized by a stable decrease from their morning peak values at 8 a.m. to late origin, are opposite to
that of O and characterized by a stable decrease from their morning peak values
afternoon minimums at ~3–4 p.m. LT. Thus, the observed diurnal variation of the secondary pollutants
3 at 8 a.m. to late
afternoon
was stronglyminimums
and negativelyat ~3–4 p.m LT.
correlated Thus,
in the daythe
timeobserved
hours withdiurnal variation
the depth of theofconvective
the secondary
mixing
layer, and the associated changes with vertical mixing intensity, over Moscow, which peaks at 1–3the
pollutants was strongly and negatively correlated in the day time hours with the depth of p.m.
convective
LT, following mixing
a daily layer,
cycle and
of the associated
radiation and changes with vertical
heat balance mixing intensity,
[37]. Additionally, over distraction
chemical Moscow,
ofwhich peaks atemitted
the primary 1–3 p.m.VOCs,
LT , following a dailyas
with benzene cycle of radiation
an example, andcontribute
may heat balance [37]. Additionally,
to their late afternoon
chemical distraction of the primary emitted VOCs, with benzene as
decrease accompanied by significant accumulation of ozone and other secondary pollutants an example, may contribute
(Figureto4).
their late afternoon decrease accompanied by significant accumulation of ozone and other secondary
According to Figure 4, the maximum O3 production rate is observed during the late morning hours
pollutants (Figure 4). According to Figure 4, the maximum O3 production rate is observed during the
(10–12 a.m. LT), which also coincides with diurnal peaks of the most abundant secondary VOCs
late morning hours (10–12 a.m. LT), which also coincides with diurnal peaks of the most abundant
(acetaldehyde, acetone, and acetic acid). The origin of the observed late morning maximum of the
secondary VOCs (acetaldehyde, acetone, and acetic acid). The origin of the observed late morning
above species can be attributed to both photochemical oxidation of primary emitted VOCs after sunrise
maximum of the above species can be attributed to both photochemical oxidation of primary emitted
and entrainment of partially oxidized products from the upper layers under development of the
VOCs after sunrise and entrainment of partially oxidized products from the upper layers under
convective boundary layer. The latter may be especially efficient for ozone accumulation in prolonged
development of the convective boundary layer. The latter may be especially efficient for ozone
stagnation conditions leading to overnight retention of secondary organics above a nocturnal inversion
accumulation in prolonged stagnation conditions leading to overnight retention of secondary
layer [38]. All compounds discussed except for O3 are not normally distributed (see Figure S1 in the
organics above a nocturnal inversion layer [38]. All compounds discussed except for O3 are not
Supplementary
normally distributedMaterials).
(seeThus,
Figure weS1 calculated the nonparametric
in the Supplementary Spearman’s
Materials). Thus,correlation coefficients
we calculated the
(Rnonparametric
s ) to measure the strength of association between maximal afternoon O 3 (3–5
Spearman’s correlation coefficients (Rs) to measure the strength of associationp.m. LT) and maximal
morning
between(10–12maximal a.m. LT) mixing
afternoon ratios
O3 (3–5 p.m.ofLT)
some
andsecondary VOCs during
maximal morning (10–12the
a.m.summer
LT) mixingmonths
ratiosfrom
of
2011–2013. High correlations were found between acetaldehyde, ethanol,
some secondary VOCs during the summer months from 2011–2013. High correlations were found acetone, and acetic acid
s = 0.55–0.91)
(Rbetween as well as
acetaldehyde, between
ethanol, the above
acetone, species
and acetic acidand
(Rs the productsasofwell
= 0.55–0.91) isoprene oxidation,
as between MVK
the above
and MACR (R = 0.67–0.81) (Table 2). The positive correlation
species and the products of isoprene oxidation, MVK and MACR (Rs = 0.67–0.81)
s of daytime O 3 (R s = 0.45–0.52)
(Table 2). Thewith
secondary VOCs affirms an important role of photochemical O3 production in Moscow during the
summers of 2011–2013.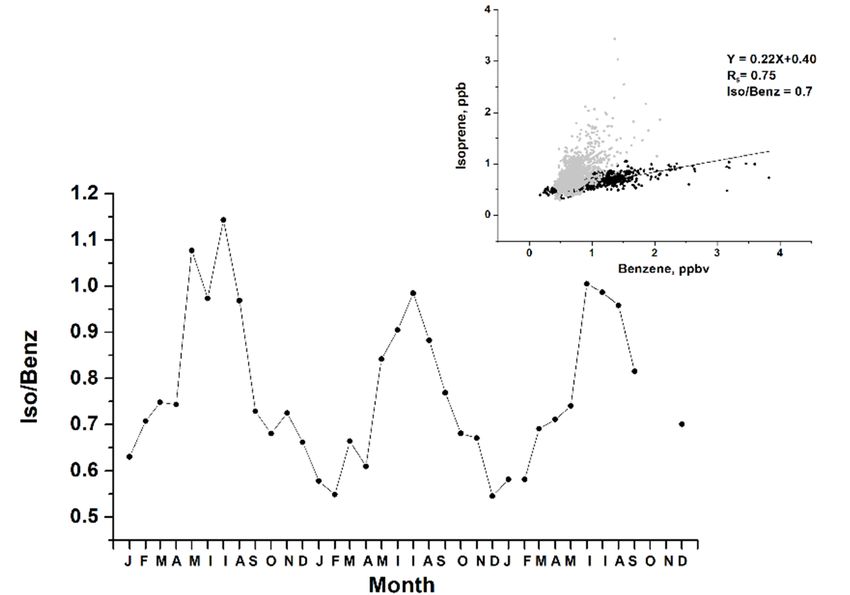
Atmosphere 2020, 11, x FOR PEER REVIEW                                                                       5 of 17

   positive correlation of daytime O3 (Rs = 0.45–0.52) with secondary VOCs affirms an important role of
   photochemical
Atmosphere             O3 production
           2020, 11, 1262        in Moscow during the summers of 2011–2013.                      5 of 16

     Figure 3. Diurnal variations of O3 and its precursors at the MSU-IAP site during the summers
 Atmosphere Figure
            2020, 11,3.xDiurnal
                        FOR PEERvariations
                                  REVIEW of O3 and its precursors at the MSU-IAP site during the summers of6 of 17        Commented
     of 2011–2013.
                                                 2011–2013.
                                                                                                                          please chang

      Figure4.4.Mean
     Figure      Meandiurnal
                       diurnalvariations of O
                                variations  of3 and secondary
                                                O3 and        VOCs
                                                        secondary  at theatMSU-IAP
                                                                  VOCs             site during
                                                                            the MSU-IAP        the summers
                                                                                          site during the
     ofsummers
         2011–2013.
                of 2011–2013.

      Table 2. Daytime summer nonparametric Spearman’s correlation coefficients (Rs) of O3 and its
      precursors from 1-h data. Significant at the 0.05 level.

                      Acetaldeh.       Acetone   Acet.acid   Ethanol   MVK + MACR         O3     CO      NOx
    Acetaldeh.           1.00           0.91       0.62        0.55       0.81           0.47    0.00    0.00
    Acetone              0.91           1.00       0.58        0.45       0.82           0.45    0.11    0.00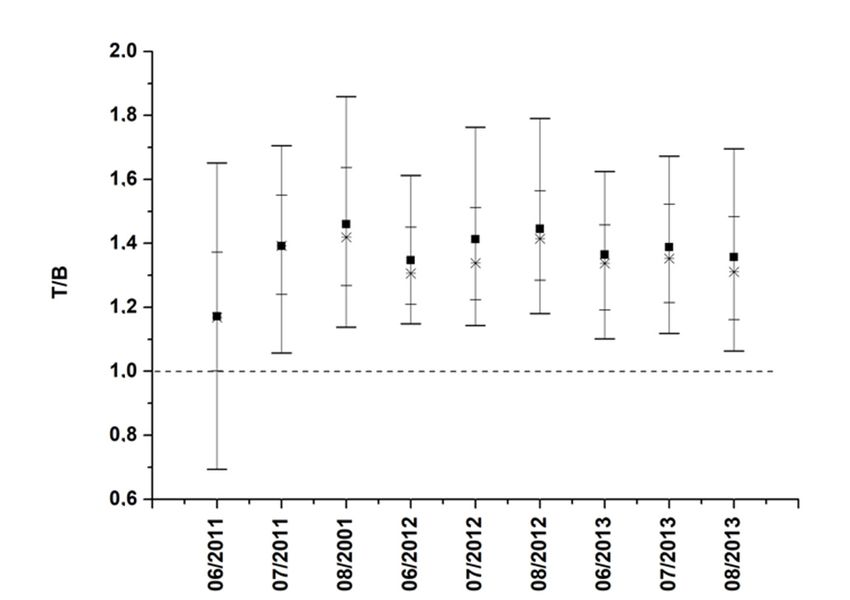
Figure 4. Mean diurnal variations of O3 and secondary VOCs at the MSU-IAP site during the
       summers of 2011–2013.
Atmosphere 2020, 11, 1262                                                                                6 of 16
       Table 2. Daytime summer nonparametric Spearman’s correlation coefficients (Rs) of O3 and its
       precursors from 1-h data. Significant at the 0.05 level.
     Table 2. Daytime summer nonparametric Spearman’s correlation coefficients (Rs ) of O3 and its
                      Acetaldeh.
     precursors from 1-h              Acetone
                           data. Significant     Acet.acid
                                             at the 0.05 level.Ethanol MVK + MACR     O3    CO  NOx
     Acetaldeh.            1.00         0.91        0.62         0.55       0.81    0.47   0.00 0.00
     Acetone        Acetaldeh.
                           0.91 Acetone 1.00 Acet.acid
                                                     0.58 Ethanol0.45 MVK + MACR
                                                                            0.82   O0.45
                                                                                      3    CO
                                                                                           0.11   NOx
                                                                                                 0.00
   Acetaldeh.
     Acet.acid        1.00 0.62    0.91 0.58 0.62 1.00      0.55 0.82    0.81
                                                                            0.75   0.47    0.00
                                                                                    0.60 −0.09     0.00
                                                                                                 0.00
   Acetone
     Ethanol          0.91 0.55    1.00 0.45 0.58 0.82      0.45 1.00    0.82
                                                                            0.67   0.45    0.11
                                                                                     0.52 −0.16    0.00
                                                                                                −0.09
   Acet.acid
     MVK + MACR 0.62 0.78          0.58 0.82 1.00 0.75      0.82 0.67    0.75
                                                                            1.00    0.49 −0.09
                                                                                   0.60    0.00    0.00
                                                                                                0.00
   Ethanol            0.55         0.45        0.82         1.00         0.67      0.52   −0.16   −0.09
     O3                    0.47         0.45        0.60         0.52       0.49     1.00 −0.39 −0.49
   MVK + MACR         0.78         0.82        0.75         0.67         1.00      0.49    0.00    0.00
   O3CO               0.47 0.00    0.45 0.11   0.60 −0.09   0.52−0.16       0.00
                                                                         0.49       −0.39
                                                                                   1.00    1.00
                                                                                          −0.39  0.82
                                                                                                  −0.49
   CONOx              0.00 0.00    0.11 0.00 −0.09 0.00 −0.16−0.09          0.00
                                                                         0.00       −0.49 1.00
                                                                                  −0.39    0.82    1
                                                                                                  0.82
   NOx                  0.00     0.00       0.00       −0.09          0.00         −0.49    0.82     1
       According to the MSU-IAP observations, the toluene to benzene ratio (T/B) was mainly in the
  range of 1–2 (mean = 1.39; P75 = 1.50; P90 = 1.89) (Figure 5). This ratio is known to be a safe indicator
      According to the MSU-IAP observations, the toluene to benzene ratio (T/B) was mainly in the
  of vehicle pollution as well as proximity of the sampled air to the associated pollution sources [39–
range of 1–2 (mean = 1.39; P75 = 1.50; P90 = 1.89) (Figure 5). This ratio is known to be a safe indicator
  43]. A T/B ratio approaching 1 indicates traffic-originated emission sources, and the value increases
of vehicle pollution as well as proximity of the sampled air to the associated pollution sources [39–43].
  with the closeness of the pollution source [44]. It suggests that the dominated anthropogenic VOCs
A T/B ratio approaching 1 indicates traffic-originated emission sources, and the value increases with
  source in the region of the MSU-IAP site during the summers of 2011–2013 was local vehicle
the closeness of the pollution source [44]. It suggests that the dominated anthropogenic VOCs source
  emissions.
in the region of the MSU-IAP site during the summers of 2011–2013 was local vehicle emissions.

              Figure5.5.Toluene
             Figure      Tolueneto
                                 tobenzene
                                   benzene ratio
                                           ratio (T/B) ratio in Moscow
                                                                Moscow from
                                                                       from daytime
                                                                            daytimesummer
                                                                                    summervalues.
                                                                                           values.                 Commented [
                                                                                                                   please change
       Thediurnal
      The  diurnalcycles
                    cyclesofofbiogenic
                               biogenicVOCs,
                                         VOCs,isoprene,
                                                isoprene,andandmonoterpenes
                                                                monoterpeneswere
                                                                              weregenerally
                                                                                    generallyweak
                                                                                              weak(Figure
                                                                                                   (Figure3),
  3), which
which   can can  be explained
             be explained    by by
                                 thethe direction
                                     direction  ofofthe
                                                      theprevailing
                                                          prevailingwinds
                                                                    winds (Figure
                                                                           (Figure 2) blowing
                                                                                      blowingmainly
                                                                                               mainlyfrom
                                                                                                       from
areas with highly limited vegetation. Isoprene levels are the highest during the morning hours
(07:00–10:00 a.m.) whereas monoterpenes increase during evening and nighttime hours owing to their
emissions at these hours and accumulation in the stable atmosphere.
      Since motor vehicle emissions dominate over other pollution sources in urban environments,
VOCs primarily produced by motor vehicles (benzene, 1.3-butadiene etc.) are commonly used as
suitable exhaust tracers. This allows for quantifying the traffic contributions to ambient isoprene and
then separating biogenic isoprene from traffic emissions [45–47]. The nighttime isoprene/anthropogenic
VOC ratio in a vehicle-polluted atmosphere is supposed to characterize vehicle exhaust [46,48]. We
then used benzene concentration to estimate the traffic contribution to isoprene at the MSU-IAP
site. Since biogenic isoprene emissions are strongly dependent on air temperature and the amount
of local vegetation, nighttime winter isoprene concentrations are supposed to be of anthropogenic
origin. Consequently, the monthly mean diurnal isoprene/benzene ratio was lowest during the
cold season and reached its maximum during the summer months (mean = 0.94), thus following a
seasonal cycle of biogenic isoprene emissions (Figure 6). Yet, the observed high positive nonparametric
Spearman’s correlation between isoprene and benzene on summer days (Rs = 0.69) clearly indicates
significant contribution of the anthropogenic signal in isoprene data during the warm season as well. A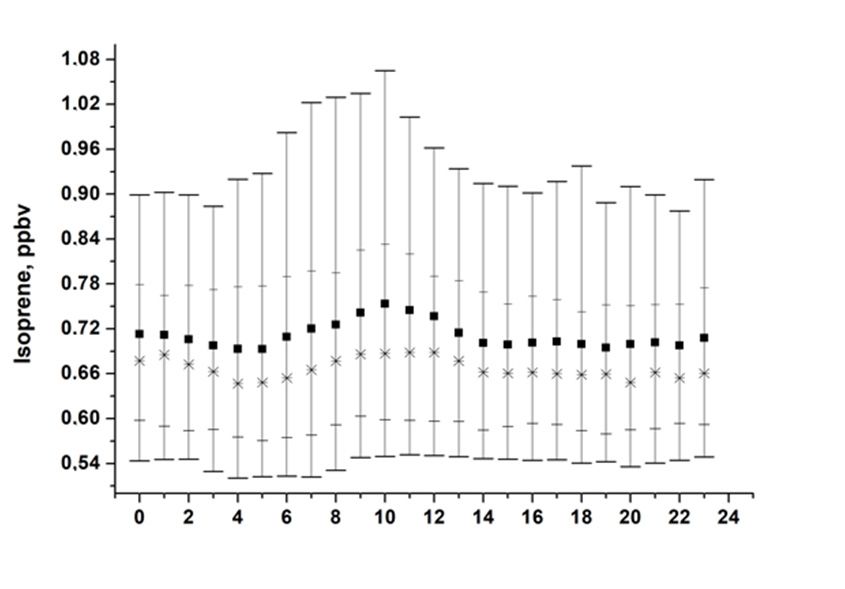
supposed to be of anthropogenic origin. Consequently, the monthly mean diurnal isoprene/benzene
ratio was lowest during the cold season and reached its maximum during the summer months
(mean = 0.94), thus following a seasonal cycle of biogenic isoprene emissions (Figure 6). Yet, the
observed high positive nonparametric Spearman’s correlation between isoprene and benzene on
      Atmosphere 2020, 11, 1262                                                                              7 of 16
summer days (Rs = 0.69) clearly indicates significant contribution of the anthropogenic signal in
isoprene data during the warm season as well. A somewhat better correlation is observed for
      somewhat
nighttime  winter  better
                      valuescorrelation is observed
                                (Rs = 0.75).        for nighttime
                                               The nighttime   winter     values (Rs = 0.75). The
                                                                  winterisoprene/benzene          nighttime
                                                                                               ratio        winter
                                                                                                     in the observed    site
      isoprene/benzene ratio in the observed site was calculated to be 0.7 on average (see scatter diagram on
was calculated to be 0.7 on average (see scatter diagram on Figure 6). It was about 5% of the summer
      Figure 6). It was about 5% of the summer daytime isoprene/benzene ratios. Thus, we suppose that
daytime  isoprene/benzene
      about  5% of the daytime ratios.
                                    summerThus,     weinsuppose
                                              isoprene            thatan
                                                         Moscow had    about   5% of the
                                                                          anthropogenic     daytime
                                                                                          origin,      summer
                                                                                                  presumably from  isoprene
in Moscow
      vehiclehad   an anthropogenic origin, presumably from vehicle exhaust.
              exhaust.

     FigureFigure
             6. Monthly     mean
                    6. Monthly meanisoprene/benzene       ratio
                                     isoprene/benzene ratio  fromfrom   2011
                                                                   2011 to 2013to 2013
                                                                                and     and versus
                                                                                    isoprene isoprene  versus
                                                                                                   benzene (blackbenzene
           circles: winter nighttime values; white circles: summer   daytime  values).
     (black circles: winter nighttime values; white circles: summer daytime values).
       3.2. Ozone Generation in Moscow
3.2. Ozone Generation in Moscow
            Although
         Atmosphere       mean
                    2020, 11,     daytime
                              x FOR        summer
                                             O3 concentration at the MSU-IAP was ~30 ppbv (Figure87),
                                    PEER REVIEW                                                       of 17
    Although
      about 5% ofmean   daytime
                  the observed    summer
                               hourly       O3 concentration
                                      mean ozone                 at the MSU-IAP
                                                 mixing ratios exceeded            was severe
                                                                        80 ppbv, marking ~30 ppbv  (Figure 7),
                                                                                              pollution
about events
       5% ofinthe
               Moscow    under favorable
                    observed             weather
                               hourly mean       conditions.
                                              ozone    mixing ratios exceeded 80 ppbv, marking severe
pollution events in Moscow under favorable weather conditions.

            Figure 7. Frequency distribution and percentiles of O3 daytime (10 a.m.–6 p.m. LT) values during the
             Figure 7.ofFrequency
            summers      2011–2013.distribution and percentiles of O3 daytime (10 a.m.–6 p.m. LT) values during the
             summers of 2011–2013.
            According to Figure 8, ground-level O3 mixing ratios decreased with increasing NOx, which
              According
       is typical         to Figure 8,urban
                  for VOC-sensitive    ground-level O3 mixing
                                            conditions          ratios
                                                       [5,6]. Since  thedecreased with increasing
                                                                         ozone photochemical      NOx, which
                                                                                               production rate is
         typical for  VOC-sensitive   urban conditions  [5,6]. Since  the ozone  photochemical  production
       depends strongly on temperature (Figure 8b), the highest O3 concentrations were observed at air      rate
       temperatures    >25 Con
         depends strongly  ◦    temperature
                              under  low-NOx(Figure  8b),(Figure
                                              conditions          8a). O3 concentrations were observed at air
                                                           the highest
         temperatures >25 °C under low-NOx conditions (Figure 8a).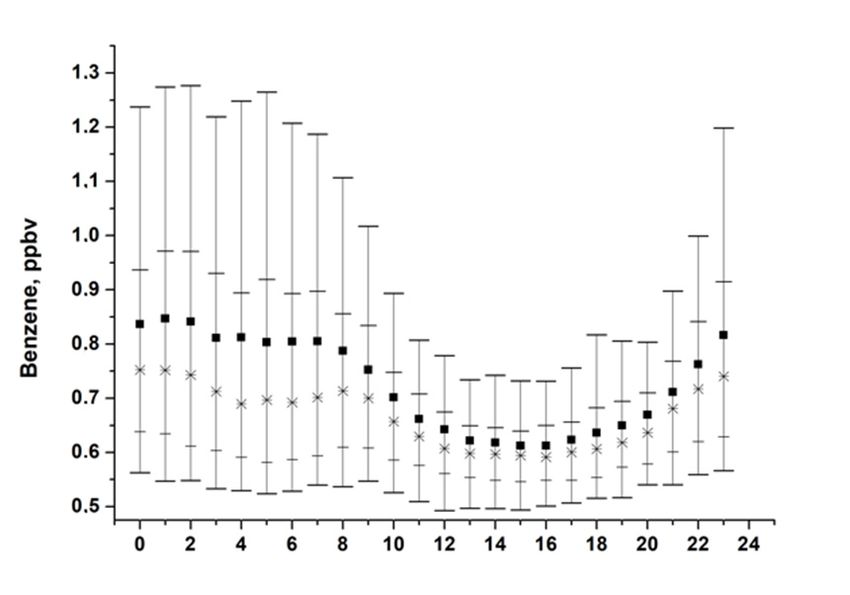
According to Figure 8, ground-level O3 mixing ratios decreased with increasing NOx, which is
typical for VOC-sensitive urban conditions [5,6]. Since the ozone photochemical production rate
depends strongly on temperature (Figure 8b), the highest O3 concentrations were observed at air
temperatures
Atmosphere >25
2020, 11, °C under low-NOx conditions (Figure 8a).
1262 8 of 16
Figure 8. O3 –NOx daytime dependence (a) and O3 versus air temperature (b) from summer daytime
Figure
(10 8. O
a.m.–6 3–NOx
p.m. LT) daytime dependence
measurements (a) and O3 versus
(R2 : determination air temperature
coefficient; (b)correlation
R: Pearson’s from summer daytime
coefficient).
(10 a.m. – 6 p.m. LT) measurements (R2: determination coefficient; R: Pearson’s correlation
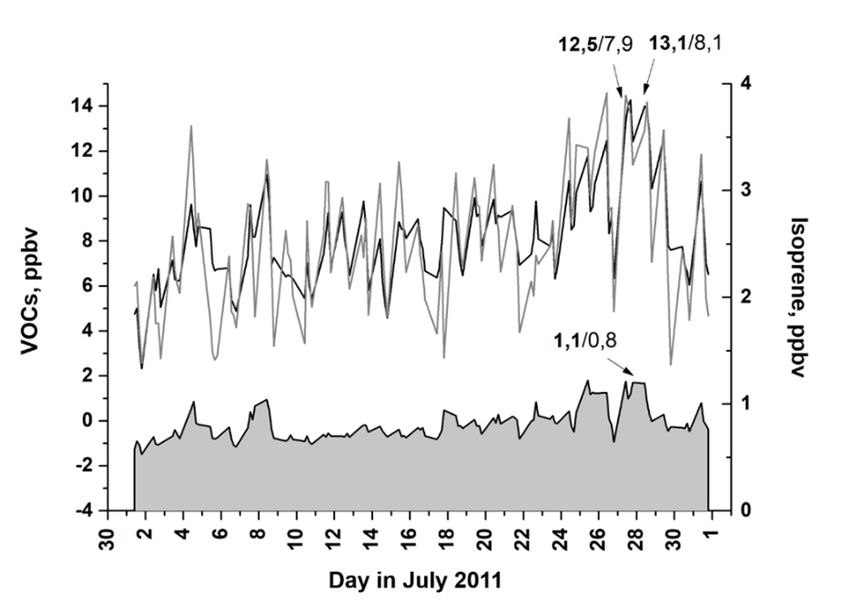
According
coefficient).to the authors of [10], efficiency of ozone photochemical production depends on the
relationship between VOCs and NOx, with an increase in the VOCs/NOx causing an increase in O3
According
production per NO to xthe authorsand,
molecule of [10], efficiencytoofan
consequently, ozone photochemical
increase in O3 groundproduction depends on
level concentration. Suchthe
relationship
behavior is between
clearly VOCs
evidenced and
from NOx,
Atmosphere 2020, 11, x FOR PEER REVIEWour with
data an increase
(Figure 9), in the
showing VOCs/NOx
an ozone causing
production an increase
efficiency in
value O3
9 of 17
production per NO molecule and, consequently, to an increase
ranging from 1 to 6 ppb O3 per mol NOx based on all summertime measurements.
x in O 3 ground level concentration.
Such behavior is clearly evidenced from our data (Figure 9), showing an ozone production efficiency
value ranging from 1 to 6 ppb O3 per mol NOx based on all summertime measurements.
Figure 9. Ozone
Figure production
9. Ozone per molecule
production of NOx
per molecule ofatNOx
different VOC/NOx
at different ratios from
VOC/NOx summer
ratios from daytime
summer
measurements at the MSU-IAP from 2011 to 2013 (R s : Spearman’s correlation coefficient).
daytime measurements at the MSU-IAP from 2011 to 2013 (Rs: Spearman’s correlation coefficient).
3.3. High O3 Episodes in Moscow
3.3. High O3 Episodes in Moscow
In summer 2011, two high O3 concentration episodes at the MSU-IAP site were observed, these
In summer 2011, two high O3 concentration episodes at the MSU-IAP site were observed, these
were from the 27 July (3–5 p.m. LT) and 28 July (2–5 p.m. LT) pollution events. In these events, hourly
were from the 27 July (3–5 p.m. LT) and 28 July (2–5 p.m. LT) pollution events. In these events,
O3 mixing ratios exceeded 80 ppbv, which is well above the short-time MAC value (Figure 10).
hourly O3 mixing ratios exceeded 80 ppbv, which is well above the short-time MAC value (Figure
Both episodes were observed in the period of hot weather (daytime air temperature >30 ◦ C).
10).
During the first episode (27.07), the daytime O3 mixing ratio increased stably and peaked at 4–5 p.m.
LT whereas the observed non-methane hydrocarbons (NMHC) and NOx mixing ratios increased along
with O3 until 4 p.m. LT with a subsequent decrease throughout late afternoon. During the second
episode (28.07), a simultaneous increase in O3 with a decrease in NMHC and NOx, changed by some
outliers, in the concentration graphs of all compounds was observed (Figure 10, right graph) from 3:30
to 5 p.m. LT.
(a) (b)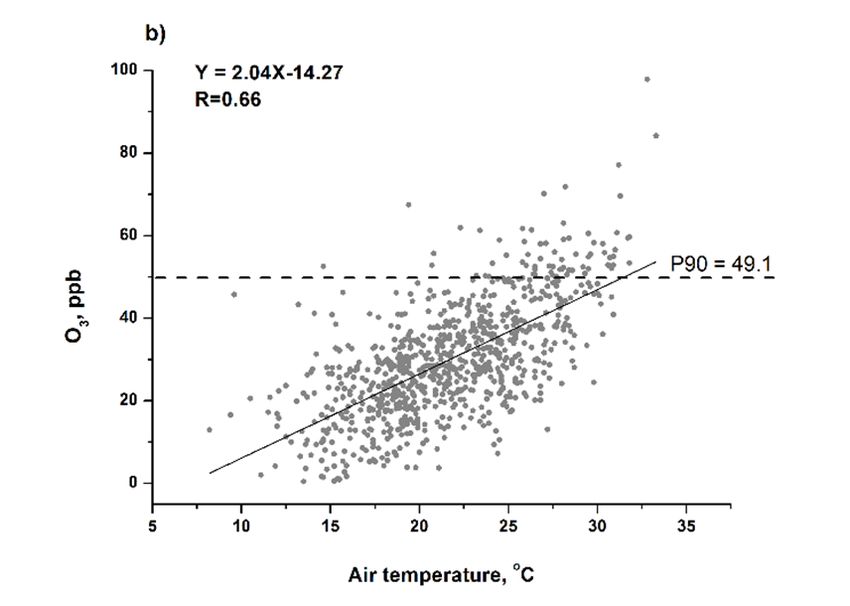
3.3. High O3 Episodes in Moscow
     In summer 2011, two high O3 concentration episodes at the MSU-IAP site were observed, these
were from the 27 July (3–5 p.m. LT) and 28 July (2–5 p.m. LT) pollution events. In these events,
hourly  O3 mixing ratios exceeded 80 ppbv, which is well above the short-time MAC value (Figure
  Atmosphere 2020, 11, 1262                                                                9 of 16
10).

                             (a)                                                                  (b)
        Figure 10. High O3 episodes in Moscow in July 2011 ((a): 27 July, (b): 28 July) from 1-min measurements
              Atmosphere 2020, 11, x FOR PEER REVIEW                                                   10 of 17
        at the MSU-IAP site.
              by some outliers, in the concentration graphs of all compounds was observed (Figure 10, right
      According    to the
           graph) from   3:30meteorological
                              to 5 p.m. LT.      data (Figure 11), in July 2011 there was hot and dry weather
  because of strong     anticyclonic     conditions.     From 11),
                According to the meteorological data (Figure     27 in
                                                                     to July
                                                                         28 2011
                                                                             July,there
                                                                                    the was
                                                                                         anticyclone
                                                                                              hot and drydecayed,
                                                                                                          weather which
           because  of strong  anticyclonic conditions. From  27 to 28 July, the anticyclone
  was accompanied by the respective drop in atmospheric pressure. In the evening (6–9         decayed, which wasp.m. LT),
    Figure accompanied
            10. High O3byepisodes        in Moscow
                               the respective   drop ininatmospheric
                                                           July 2011 pressure.
                                                                        ((a): 27 In
                                                                                  July,
                                                                                     the (b):  28 July)
                                                                                          evening        fromLT),
                                                                                                   (6–9 p.m.   1-min                 Commente
  thunderstorms with heavy rain (about 14 mm of precipitations) and squall winds were observed,
    measurements    at the MSU-IAP
           thunderstorms    with heavysite.
                                         rain (about 14 mm of precipitations) and squall winds were observed,
  accompanied   by a change in wind direction from west to east.
           accompanied by a change in wind direction from west to east.                                                              please chan

    Both episodes were observed in the period of hot weather (daytime air temperature >30 °C).
During the first episode (27.07), the daytime O3 mixing ratio increased stably and peaked at 4–5 p.m.
LT whereas the observed non-methane hydrocarbons (NMHC) and NOx mixing ratios increased
along with O3 until 4 p.m. LT with a subsequent decrease throughout late afternoon. During the
second episode (28.07), a simultaneous increase in O3 with a decrease in NMHC and NOx, changed

                    Maximum
        Figure 11.Figure           air temperature,
                          11. Maximum     air temperature,atmospheric     pressureat at
                                                            atmospheric pressure     SLSL
                                                                                        (sea(sea  level),
                                                                                              level),      and speed
                                                                                                      and speed        and wind
                                                                                                                and wind
        direction at the MSU-IAP
                  direction            site from
                            at the MSU-IAP           26 to
                                              site from  2627 July
                                                           to 27 July2011.
                                                                      2011.

                 The observed
       The observed     drop in drop    in the concentrations
                                  the concentrations       of theofspecies
                                                                    the species
                                                                             at 28atJuly.2011
                                                                                      28 July.2011   is assumed
                                                                                                is assumed      to to
                                                                                                                    be be
                                                                                                                        connected
            connected  with the  change   in the weather  conditions  and  ventilation  of the boundary
  with the change in the weather conditions and ventilation of the boundary layer through the passage     layer through
            the passage of the front system.
  of the front system.
                 Some studies reported that daytime NMHC/NOx ratios lower than 10 are associated to
       SomeVOC-sensitive
               studies reported       that daytime
                            ozone production      regimesNMHC/NOx
                                                            whereas daytime  ratios    lower ratios
                                                                                NMHC/NOx        than greater
                                                                                                        10 arethan associated
                                                                                                                       20       to
  VOC-sensitive     ozone
            correspond       production ozone
                         to NOx-sensitive     regimes     whereas daytime
                                                    photochemistry                NMHC/NOx
                                                                      [10,12]. Figure   12 shows thatratios
                                                                                                        duringgreater
                                                                                                                 the first than 20
  correspondhigh
               to ozone episode, theozone
                  NOx-sensitive      NMHC/NOx        ratio was in the
                                              photochemistry          range of
                                                                   [10,12].     10–20, 12
                                                                             Figure     which  points
                                                                                           shows      to photochemical
                                                                                                   that   during the first high
            ozone production. During the second episode, O3 was produced mainly in NOx-sensitive (~in 80% of
  ozone episode, the NMHC/NOx ratio was in the range of 10–20, which points to photochemical ozone
            cases) and transitional (~in 20% of cases) regimes.
  production. During the second episode, O3 was produced mainly in NOx-sensitive (~in 80% of cases)
  and transitional (~in 20% of cases) regimes.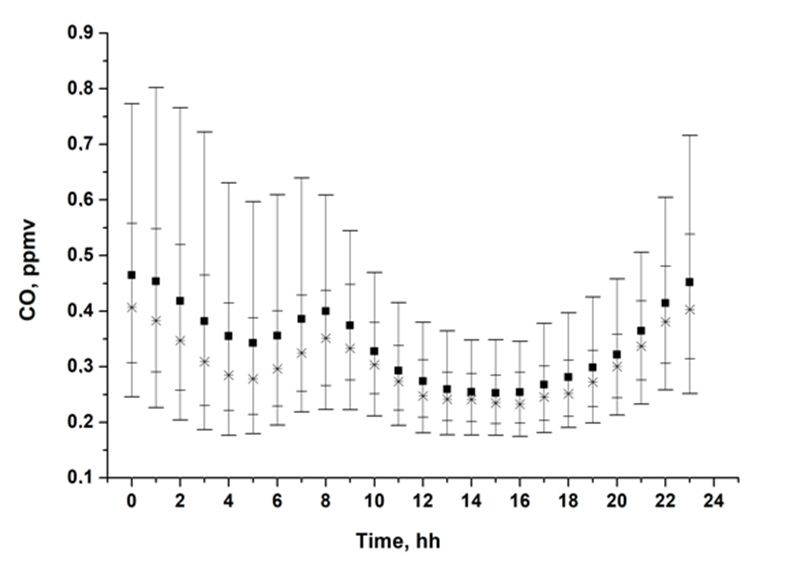
correspond to NOx-sensitive ozone photochemistry [10,12]. Figure 12 shows that during the first
high ozone episode, the NMHC/NOx ratio was in the range of 10–20, which points to photochemical
ozone production. During the second episode, O3 was produced mainly in NOx-sensitive (~in 80% of
cases) and transitional (~in 20% of cases) regimes.
Atmosphere 2020, 11, 1262                                                                                      10 of 16

      Figure 12. Ozone production per molecule of NOx with different photochemical regimes during the
   Atmosphere 2020, 11, x FOR PEER REVIEW                                                              11 of 17
     Figure 12.ofOzone
      episodes          production
                  elevated ozone (Rper  molecule ofcorrelation
                                   s : Spearman’s    NOx withcoefficient).
                                                               different photochemical regimes during the                 Commente
     episodes of elevated ozone (Rs: Spearman’s correlation coefficient).
       There  was                                                                                                         please chan
     There was  nono   significantincrease
                    significant     increaseininthe
                                                  theconcentrations
                                                      concentrations of
                                                                     of VOCs
                                                                         VOCs measured
                                                                              measured on
                                                                                        on 27
                                                                                           27 and
                                                                                              and 28
                                                                                                  28 July
                                                                                                      July
2011 compared to that of other days of the month, except for two compounds: acetone and acetic
  2011  compared   to that of  other  days of   the month,  except for  two compounds: acetone and  acetic
  acid (Figure 13). During the high ozone episodes, acetone, acetic acid, and isoprene concentrations
acid (Figure 13). During the high ozone episodes, acetone, acetic acid, and isoprene concentrations
  exceeded their averages in July 2011 by 5.0, 4.6, and 0.3 ppbv, respectively. Acetone and acetic acid
exceeded their averages in July 2011 by 5.0, 4.6, and 0.3 ppbv, respectively. Acetone and acetic acid can
  can be both biogenic and anthropogenic. This is confirmed by the high Spearman’s correlation of
be both biogenic and anthropogenic. This is confirmed by the high Spearman’s correlation of these
  these compounds with biogenic isoprene (Rs = 0.7–0.8), 2-methyl-3-buten-2-ol (MBO) (Rs = 0.8–0.9),
compounds with biogenic isoprene (Rs = 0.7–0.8), 2-methyl-3-buten-2-ol (MBO) (Rs = 0.8–0.9), and
  and anthropogenic benzene (Rs = 0.5–0.6) according to our data.
anthropogenic benzene (Rs = 0.5–0.6) according to our data.

      Figure     Acetone,
             13.13.
        Figure            acetic
                    Acetone,      acid,
                             acetic acid,and
                                          andisoprene
                                               isopreneon
                                                        onJuly
                                                           July27
                                                                27and
                                                                   and28,
                                                                       28,2011.
                                                                           2011. The
                                                                                 The ratios
                                                                                     ratios of the daily
                                                                                            of the daily mean
                                                                                                         mean and
                                                                                                              and
      monthly  mean   values are near  the arrows.
        monthly mean values are near the arrows.

3.4. VOCs Impact on O3 Generation in Moscow
   3.4. VOCs Impact on O3 Generation in Moscow
      To estimate the impact of the measured VOCs on ground-level ozone production in Moscow, we
         To estimate the impact of the measured VOCs on ground-level ozone production in Moscow,
employed the widely used quantity, ozone-forming potential (OFP) [49]:
   we employed the widely used quantity, ozone-forming potential (OFP) [49]:
                                                   3
                                       OFP [µg/m
                                         OFP  [ μg/m] 3=
                                                       ] =C     × MIRVOC,,
                                                            VOC × MIR VOC
                                                          CVOC

where Cwhere   CVOC is a VOC    concentration  having
                                                   the the dimension
                                                                   of of    3 and
                                                                         μg/m  3 and MIRVOC is
                                                                                   MIRVOC is a maximum
         VOC is  a VOC    concentration    having       dimension     µg/m                      maximum
  incremental
incremental     reactivity,
              reactivity,   a dimensionlessquantity
                          a dimensionless     quantitydefined
                                                        definedas
                                                                asgrams
                                                                   grams of
                                                                          of O   produced per
                                                                             O33 produced per gram
                                                                                               gram of
                                                                                                     of the
                                                                                                         the
  VOC   [50]. The method    allows  for estimating  the maximum   ozone  concentration produced
VOC [50]. The method allows for estimating the maximum ozone concentration produced from the      from  the
  chemical
chemical    destruction
          destruction  ofof  the
                           the   givenVOC
                               given    VOCbased
                                             basedon onpredefined
                                                        predefinedMIR  VOC values.
                                                                  MIRVOC   values.
       For all the measured VOCs in Moscow during the summers of 2011–2013, the OFP values did
  not exceed 115 μg/m3 for 90% of the measurement time (Figure 14), with the highest OFP values
  observed during the summer of 2011 (mean 67.3 μg/m3, 90-th percentile 103 μg/m3). Acetaldehyde,
  1.3-butadiene, and isoprene were found to play the leading roles in O3 generation, whereas benzene,
  styrene, phenol, and monoterpenes made a minor contribution to O3 formation in the city (Tables 3
  and 4).
Atmosphere 2020, 11, 1262 11 of 16
For all the measured VOCs in Moscow during the summers of 2011–2013, the OFP values did
not exceed 115 µg/m3 for 90% of the measurement time (Figure 14), with the highest OFP values
observed during the summer of 2011 (mean 67.3 µg/m3 , 90-th percentile 103 µg/m3 ). Acetaldehyde,
1.3-butadiene, and isoprene were found to play the leading roles in O3 generation, whereas benzene,
styrene, phenol, and monoterpenes made a minor contribution to O3 formation in the city (Tables 3
and 4).
During the high July 2011 ozone events, the 90th percentile of OFPs for the total observed VOCs
reached 110–136 µg/m3 (55–68 ppbv), with acetaldehyde (42–60 µg/m3 in 90% of cases) and 1.3-butadien
(16–19 µg/m3 in 90% of cases) making the highest contribution to ozone generation. At the same
time, the estimated inputs of acetone, acetic acid, and isoprene, which increased during the high
O3 episodes (Figure 13), to ozone production were about 2 times less than that of acetaldehyde and
1.3-butadien. The highest O3 production was found during the first episode on 27 July, when the
anticyclonic meteorological conditions were not yet changed, as those changes took place during the
second episode.
Atmosphere 2020, 11, x FOR PEER REVIEW 12 of 17
Figure14.
Figure Ozoneformation
14.Ozone formationpotentials
potentialsinin Moscow
Moscow (summers
(summers of of 2011–2013).
2011–2013).
Table 3. Daytime ozone-forming potentials (OFPs) (in µg/m3 ) for VOCs measured at the MSU-IAP site
Table 3. Daytime ozone-forming potentials (OFPs) (in μg/m3) for VOCs measured at the MSU-IAP
during the summers of 2011–2013 (from 1-h VOCs data).
site during the summers of 2011–2013 (from 1-h VOCs data).
VOC N Total Mean Standard Deviation P10 P90
VOC N Total Mean Standard Deviation P10 P90
Acetaldehyde
Acetaldehyde2416 2416 20.3920.39 14.71
14.71 4.824.82 39.84 39.84
Ethanol 2422 4.74 3.12 1.65 9.89
Ethanol 2422 4.74 3.12 1.65 9.89
1.3-Butadiene 2424 13.86 9.73 6.74 28.87
1.3-Butadiene
Acetone 2424 2424 1.4513.86 9.73
0.96 6.740.23 28.87 2.71
AceticAcetone
acid 2418 2424 2.911.45 0.96
1.69 0.231.04 2.71 5.33
Acetic acid 2424
Isoprene 2418 9.582.91 1.69
12.06 1.043.53 5.33 26.20
+ MACR
MVKIsoprene 2424 2424 3.579.58 1.16
12.06 3.532.53 26.20 5.14
Benzene
MVK + MACR 2424 2424 0.283.57 0.08
1.16 2.530.20 5.14 0.36
MBO 2424 1.88 0.49 1.44 2.50
Benzene 2424 0.28 0.08 0.20 0.36
Toluene 2424 1.86 0.80 1.22 2.73
PhenolMBO 2424 2424 0.871.88 0.49
0.39 1.440.62 2.50 1.22
Toluene
Styrene 2424 2424 0.431.86 0.80
0.07 1.220.36 2.73 0.51
Phenol
C8-aromatics 2424 2424 2.710.87 0.39
1.17 0.621.77 1.22 4.03
C9-aromatics
Styrene 2424 2424 2.240.43 0.84
0.07 0.361.50 0.51 3.02
Terpenes
C8-aromatics2424 2424 0.782.71 0.25
1.17 1.770.52 4.03 1.03
Total VOCs 2424 67.27 27.04 38.13 102.90
C9-aromatics 2424 2.24 0.84 1.50 3.02
Terpenes 2424 0.78 0.25 0.52 1.03
Total VOCs 2424 67.27 27.04 38.13 102.90
Table 4. OFPs (in μg/m3) for the high ozone episodes on July 27 and 28, 2011 based on 1-h VOCs
data.
N Total Mean Standard Deviation P10 P90
VOC
1 2 1 2 1 2 1 2 1 2
Acetaldehyde 207 264 49.92 33.08 8.76 7.04 39.54 24.6 60.29 42.06Atmosphere 2020, 11, 1262 12 of 16
Table 4. OFPs (in µg/m3 ) for the high ozone episodes on July 27 and 28, 2011 based on 1-h VOCs data.
N Total Mean Standard Deviation P10 P90
VOC
1 2 1 2 1 2 1 2 1 2
Acetaldehyde 207 264 49.92 33.08 8.76 7.04 39.54 24.6 60.29 42.06
Ethanol 207 264 14.43 13.39 1.16 1.45 12.88 11.35 15.97 15.07
1.3-Butadiene 207 264 15.73 12.92 2.15 2.11 13.08 10.39 18.60 15.47
Acetone 204 264 4.23 3.87 0.40 0.46 3.71 3.38 4.78 4.45
Acetic acid 182 263 7.27 6.78 0.95 0.90 6.09 5.67 8.59 7.98
Isoprene 207 264 7.98 6.93 1.64 1.57 5.95 4.85 10.20 8.85
MVK + MACR 207 264 7.76 6.03 1.39 1.02 5.90 4.73 9.46 7.42
Benzene 207 264 0.42 0.31 0.06 0.06 0.35 0.23 0.51 0.39
MBO 207 264 3.25 2.96 0.51 0.53 2.66 2.33 3.95 3.67
Toluene 207 264 3.03 2.09 0.59 0.45 2.30 1.55 3.91 2.66
Phenol 207 264 0.81 0.91 0.18 0.18 0.57 0.67 1.06 1.15
Styrene 207 264 0.37 0.43 0.09 0.08 0.25 0.32 0.48 0.54
C8-aromatics 207 264 3.57 3.01 0.94 0.65 2.52 2.20 4.85 3.79
C9-aromatics 207 264 2.12 2.05 0.59 0.61 1.33 1.29 2.97 2.88
Terpenes 207 264 0.76 0.71 0.33 0.32 0.30 0.32 1.19 1.13
Total VOCs 207 264 121.70 95.50 12.22 11.27 105.86 81.3 136.38 110.36
Thus, the total contribution of all the measured VOCs to daytime ozone levels in Moscow was
found to be significant in hot and calm weather conditions. O3 production from VOCs was 31–67 µg/m3
on average and in 10% of cases exceeded 100 µg/m3 . Anticyclonic conditions with high air temperature
(above 30 ◦ C), low cloud cover, and low wind speeds led to active ozone generation in the presence of
local pollution sources and resulted in near-surface day-time ozone mixing ratios exceeding hazardous
levels (OFPs from total VOCs was about 100–122 µg/m3 on average and were higher than 136 in 10% of
calculations).
4. Conclusions
The detailed analysis of ground-level O3 and its precursors measured at the MSU-IAP site located
in the southwestern part of Moscow (about 8 km away from the city center) showed the highest O3 to be
in the daytime warm periods of the observation period. The O3 mixing ratio increased monotonically
from early morning, reaching its maximum value of 34 ppbv (sample mean) at ~4 p.m. LT. However,
anticyclonic meteorological conditions with high air temperatures (above 25 ◦ C) and low wind speeds
(2–3 m/s) contributed to O3 reaching a hazardous level (up to 105 ppbv or 210 µg/m3 ) in the city.
Diurnal variations of anthropogenic O3 precursors, NOx, CO, and benzene, were opposite to
that of ozone, showing a stable decrease from their morning peak values at 8 a.m. to late afternoon
minimums at 5-6 p.m. LT. The observed diurnal variability of the above species can be explained by
changes in vertical mixing intensity in the course of the day. Additionally, chemical distraction of the
primary emitted VOCs, with the benzene as an example, could contribute to their daytime decrease,
accompanied by significant accumulation of O3 and other secondary pollutants. The maximum
O3 production rate was observed during the late morning hours (10–12 a.m. LT) which coincided
markedly with diurnal peaks in a number of the most abundant secondary VOCs (acetaldehyde,
acetone, and acetic acid). The origin of the observed late morning maximum of the above species could
be attributed to both photochemical oxidation of primary emitted VOCs after sunrise and entrainment
of partially oxidized products from the upper layers under development of the convective boundary
layer. The high positive relationships of acetaldehyde, ethanol, acetone, and acetic acid with each
other (Rs = 0.6–0.9) and with the products of isoprene oxidation, MVK and MACR, (Rs = 0.7–0.8) and
no correlation with CO and NOx confirmed the significant role of photochemistry in the production
of these VOCs in the city along with their primary sources. The positive correlation of daytime O3
(Rs = 0.5) with secondary VOCs affirmed an important role of photochemical O3 production in Moscow
during the summers of 2011–2013.Atmosphere 2020, 11, 1262 13 of 16
The toluene to benzene ratio (T/B), which can serve as an indicator of vehicle pollution as well as
air chemical aging, suggested that the dominant anthropogenic VOCs source in Moscow was local
vehicle emissions. The non-linear O3 –NOx dependence showed a decrease in ground-level O3 with
am increase in NOx, which is typical for the VOC-sensitive photochemical regime of O3 formation in
Moscow. Increase in the VOCs/NOx ratio caused an increase in O3 production of the NOx molecule
and, consequently, to an increase in ground-level O3 concentration. The NMHC/NOx ratio calculated
for the elevated ozone episodes in July 2011 showed that O3 was mainly generated in the conditions of
transitional and NOx-sensitive photochemical regimes.
The concentrations of the biogenic VOCs isoprene and monoterpenes were 0.73 ppbv and 0.53
ppbv, respectively, on average. Their diurnal variations were poorly distinguished, which may have
been due to the mainly southwest and west winds blowing from the roads and limited vegetation
area. The high positive relationship of isoprene (Rs = 0.7) with the vehicle exhaust tracer benzene in the
summer daytime hours pointed to the impact of anthropogenic isoprene on the data. The calculated
nighttime winter isoprene/benzene ratio showed that about 5% of the daytime summer isoprene in
Moscow was anthropogenic.
For all the measured VOCs in Moscow from 2011to 2013, OFP values did not exceed 115 µg/m3 in
90% of the whole observation period. The highest OFPs were found in 2011 and 2012 (67.3 µg/m3 on
average and did not exceed 103 µg/m3 in 90% of cases). The lowest O3 formation was found in 2013
(31.3 µg/m3 on average and did not exceed 44.3 µg/m3 in 90% of cases). Acetaldehyde, 1.3-butadiene,
and isoprene played the leading roles in O3 generation (9.6–20.4 µg/m3 in average). Benzene, styrene,
phenol, and monoterpenes made less of a contribution to O3 formation in the city (0.3–0.9 µg/m3 in
average). Anticyclonic conditions catalyzed active generation of ground-level O3 in polluted urban air
(OFPs from total VOCs was about 100–122 µg/m3 on average and were higher than 136 µg/m3 in 10%
of calculations).
Supplementary Materials: The following are available online at http://www.mdpi.com/2073-4433/11/11/1262/s1.
Figure S1: Frequency distribution of some atmospheric compounds in Moscow (summers of 2011–2013).
Author Contributions: All authors contributed to the original draft preparation of the manuscript; I.B.B., V.A.B.
and N.F.E. conceived and designed the experiments; E.V.B., K.B.M. and N.V.P. contributed to the data analysis;
K.B.M. and A.I.S. provided project administration and revised the whole manuscript. All authors have read and
agreed to the published version of the manuscript.
Funding: This work was funded by the Russian Foundation for Basic Research (grants # 18-35-20031 (VOCs
impact on O3 generation in cities) and #19-05-50088 (transformation of polluting gases in Moscow)).
Acknowledgments: The authors acknowledge the colloquies with the MSU meteorological observatory for
provision of meteorological data.
Conflicts of Interest: The authors declare no conflict of interest.
References
1. Lefohn, A.S.; Malley, C.S.; Smith, L.; Wells, B.; Hazucha, M.; Simon, H.; Naik, V.; Mills, G.; Schultz, M.G.;
Paoletti, E.; et al. Tropospheric ozone assessment report: Global ozone metrics for climate change, human
health, and crop/ecosystem research. Elem. Sci. Anth. 2018, 6, 1–28. [CrossRef]
2. Manisalidis, I.; Stavropoulou, E.; Stavropoulos, A.; Bezirtzoglou, E. Environmental and Health Impacts of
Air Pollution: A Review. Front. Public Health 2020, 8, 14. [CrossRef] [PubMed]
3. Seinfeld, J.H. Chemistry of Ozone in The Urban and Regional Atmosphere. In Conical Intersections; World
Scientific Publishing Co Pte Ltd.: Singapore, 1995; Volume 3, pp. 34–57.
4. Thielmann, A.; Grüebler, F.C.; Prévôt, A.S.H.; Staehelin, J. Empirical ozone isopleths as a tool to identify
ozone production regimes. Geophys. Res. Lett. 2001, 28, 2369–2372. [CrossRef]
5. Bowman, F.M.; Seinfeld, J.H. Ozone productivity of atmospheric organics. J. Geophys. Res. Space Phys. 1994,
99, 5309–5324. [CrossRef]
6. Mazzuca, G.M.; Ren, X.; Loughner, C.P.; Estes, M.; Crawford, J.H.; Pickering, K.E.; Weinheimer, A.J.;
Dickerson, R.R. Ozone production and its sensitivity to NOx and VOCs: Results from the DISCOVER-AQ
field experiment, Houston 2013. Atmos. Chem. Phys. Discuss. 2016, 16, 14463–14474. [CrossRef]Atmosphere 2020, 11, 1262 14 of 16
7. Sharma, A.; Sharma, S.K.; Rohtash; Mandal, T.K. Influence of ozone precursors and particulate matter on the
variation of surface ozone at an urban site of Delhi, India. Sustain. Environ. Res. 2016, 26, 76–83. [CrossRef]
8. Chang, C.-Y.; Faust, E.; Hou, X.; Lee, P.; Kim, H.C.; Hedquist, B.C.; Liao, K.-J. Investigating ambient ozone
formation regimes in neighboring cities of shale plays in the Northeast United States using photochemical
modeling and satellite retrievals. Atmos. Environ. 2016, 142, 152–170. [CrossRef]
9. Karl, T.; Graus, M.; Striednig, M.; Lamprecht, C.; Hammerle, A.; Wohlfahrt, G.; Held, A.; Von Der Heyden, L.;
Deventer, M.J.; Krismer, A.; et al. Urban eddy covariance measurements reveal significant missing NOx
emissions in Central Europe. Sci. Rep. 2017, 7, 1–9. [CrossRef]
10. Sillman, S. The relation between ozone, NOx and hydrocarbons in urban and polluted rural environments.
Atmos. Environ. 1999, 33, 1821–1845. [CrossRef]
11. Goldberg, D.L.; Vinciguerra, T.P.; Anderson, D.C.; Hembeck, L.; Canty, T.P.; Ehrman, S.H.; Martins, D.K.;
Stauffer, R.M.; Thompson, A.M.; Salawitch, R.J.; et al. CAMx Ozone Source Attribution in the Eastern United
States using Guidance from Observations during DISCOVER-AQ Maryland. Geophys. Res. Lett. 2016, 43,
2249–2258. [CrossRef]
12. Jin, X.; Fiore, A.M.; Murray, L.T.; Valin, L.C.; Lamsal, L.N.; Duncan, B.; Boersma, K.F.; De Smedt, I.;
Abad, G.G.; Chance, K.; et al. Evaluating a Space-Based Indicator of Surface Ozone-NOx-VOC Sensitivity
Over Midlatitude Source Regions and Application to Decadal Trends. J. Geophys. Res. Atmos. 2017, 122,
10–439. [CrossRef] [PubMed]
13. Duan, J.; Tan, J.; Yang, L.; Wu, S.; Hao, J. Concentration, sources and ozone formation potential of volatile
organic compounds (VOCs) during ozone episode in Beijing. Atmos. Res. 2008, 88, 25–35. [CrossRef]
14. Guo, H.; Lyu, X.; Cheng, H.; Ling, Z.; Guo, H. Overview on the spatial–temporal characteristics of the ozone
formation regime in China. Environ. Sci. Process. Impacts 2019, 21, 916–929. [CrossRef]
15. Tan, Z.; Lu, K.; Jiang, M.; Su, R.; Dong, H.; Zeng, L.; Xie, S.; Tan, Q.; Zhang, Y. Exploring ozone pollution in
Chengdu, southwestern China: A case study from radical chemistry to O3-VOC-NOx sensitivity. Sci. Total.
Environ. 2018, 636, 775–786. [CrossRef]
16. Thielmann, A.; Prévôt, A.S.H.; Staehelin, J. Sensitivity of ozone production derived from field measurements
in the Italian Po basin. J. Geophys. Res. Space Phys. 2002, 107, 8194. [CrossRef]
17. Ren, X.; Van Duin, D.; Cazorla, M.; Chen, S.; Mao, J.; Zhang, L.; Brune, W.H.; Flynn, J.; Grossberg, N.;
Lefer, B.L.; et al. Atmospheric oxidation chemistry and ozone production: Results from SHARP 2009 in
Houston, Texas. J. Geophys. Res. Atmos. 2013, 118, 5770–5780. [CrossRef]
18. Xue, L.K.; Wang, T.; Gao, J.; Ding, A.; Zhou, X.H.; Blake, D.R.; Wang, X.F.; Saunders, S.M.; Fan, S.J.; Zuo, H.C.;
et al. Ozone production in four major cities of China: Sensitivity to ozone precursors and heterogeneous
processes. Atmos. Chem. Phys. Discuss. 2013, 13, 27243–27285. [CrossRef]
19. Elansky, N.F. Impurities in the atmosphere of continental Russia. Priroda 2002, 2, 32–43, [In Russian].
20. Elansky, N.; Lokoshchenko, M.A.; Trifanova, A.V.; Belikov, I.B.; Ckorokhod, A.I. On Contents of Trace Gases
in the Atmospheric Surface Layer over Moscow. Izv. Atmos. Ocean. Phys. 2015, 51, 39–51. [CrossRef]
21. Elanskii, N.F.; Belikov, I.B.; Golitsyn, G.S.; Grisenko, A.M.; Lavrova, O.V.; Pankratova, N.V.; Safronov, A.N.;
Skorokhod, A.I.; Shumskii, R.A. Observations of the atmosphere composition in the Moscow megapolis
from a mobile laboratory. Dokl. Earth Sci. 2010, 432, 649–655. [CrossRef]
22. Gorchakov, G.I.; Semutnikova, E.G.; Isakov, A.A.; Kopeikin, V.M.; Karpov, A.V.; Kurbatov, G.A.;
Ponomareva, T.Y.; Sokolov, A.V. The Moscow smoke haze of 2010: Extreme aerosol and gaseous air
pollution of in the Moscow region. Atmos. Ocean. Opt. 2011, 24, 6, 452–458.
23. Yurganov, L.N.; Rakitin, V.; Dzhola, A.; August, T.; Fokeeva, E.; George, M.; Gorchakov, G.; Grechko, E.;
Hannon, S.; Karpov, A.; et al. Satellite- and ground-based CO total column observations over 2010 Russian
fires: Accuracy of top-down estimates based on thermal IR satellite data. Atmos. Chem. Phys. Discuss. 2011,
11, 7925–7942. [CrossRef]
24. Lokoshchenko, M.A.; Elansky, N.F.; Trifanova, A.V.; Belikov, I.B.; Skorokhod, A.I. Limiting levels of air
pollution in Moscow. Vestn. Mosk. Univ. Geogr. 2016, 5, 29–39.
25. Lokoshchenko, M.A.; Elanskii, N.F.; Malyashova, V.P.; Trifanova, A.V. Dynamics of the surface content of
sulfur dioxide in Moscow. Atmos. Ocean. Opt. 2015, 21, 384–391.
26. Causes and factors of positive anomalies of surface ozone in the Moscow region and the south-eastern coast
of the Crimea. Atmos. Ocean. Opt. 2016, 29, 493–502. [CrossRef]You can also read