Estimating seasonal fragrant rice production in Thailand: A review article
←
→
Page content transcription
If your browser does not render page correctly, please read the page content below
International Journal of Agricultural Technology 2019 Vol. 15(5): 707-722
                                                     Available online http://www.ijat-aatsea.com
                                                                       ISSN 2630-0192 (Online)

Estimating seasonal fragrant rice production in Thailand:
A review article

Kaeomuangmoon, T.1, Jintrawet, A.2* and Katzfey, J.3
1
 Center for Agricultural Resource System Research, Faculty of Agriculture, Chiang Mai
University, Chiang Mai, 50200, Thailand; 2Department of Plant and Soil Science and Center for
Agricultural Resource System Research, Faculty of Agriculture, Chiang Mai University, Chiang
Mai, 50200, Thailand; 3Post Retirement Fellow, Climate Science Centre, CSIRO, Aspendale,
3195, Australia.

Kaeomuangmoon, T., Jintrawet, A. and Katzfey, J. (2019). Estimating Seasonal Fragrant Rice
Production in Thailand: A review article. International Journal of Agricultural Technology
15(5): 707-722.

Abstract The article is reviewed the current and existing methods of fragrant rice crop yield
and production forecasts in Thailand and their potential application for seasonal prediction.
While several government agencies have carried out the forecast task, however, the further
research is needed in order to minimize risk and maximize efficiency of agricultural resources.
Incorporation of emerging methods could lead to a new strategy to forecast yields and
production as well as to provide timely and reliable forecasts, by adopting integrated agro-
informatic tools. The manual crop cutting, end-of-season farmer surveys, remote sensing,
spatial databases and decision support system tools and simulation models were reviewed. We
concluded that the spatial databases and climate and crop simulation models provided the
opportunities to establish an inclusive and integrated platform for farmers, government agencies
and private firms to participate in the important task of seasonal forecasting for fragrant rice
production systems in Thailand.

Keywords: KDML105 rice variety, Agro-informatics, agricultural resource databases, CSM-
CERES-Rice model, ORYZA2000 model

Introduction

       Timely and accurate crop yield estimation is an essential management
tool to regulate the common agricultural markets (Supit, 1997). The estimated
results are used by multiple stakeholders in several ways to improve crop
production outcomes by minimizing inputs and maximizing efficiency in
sustainable agricultural practice and precision farming (Challinor, 2009; Zhang
et al., 2002). An estimation of seasonal crop yield is necessary for agricultural
information systems, and tools for this have been developed for cotton in the
southeastern United States (Baigorria et al., 2010; Mauget et al., 2013), several
*
    Corresponding Author: Jintrawet, A.; Email: attachai.j@cmu.ac.th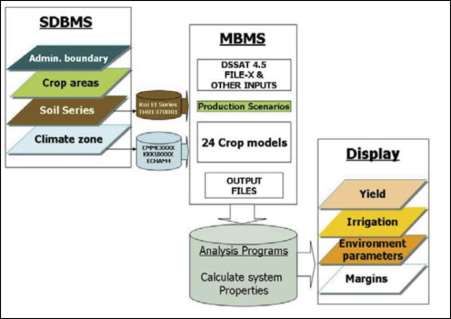
crops in Europe (Cantelaube and Terres, 2005), and rice in the Philippines
(Koide et al., 2013). At a plot level of crop production, using process-oriented
models for seasonal yield forecasts may help to optimize crop management
decisions such as site-specific chemical fertilizer application rates (Ratjen and
Kage, 2015).
The purpose of this review is to provide a summary of crop and rice yield
and production forecasts using various methods and to discuss methods focused
specifically on fragrant rice (also known as jasmine rice) in Thailand, using
simulation models and spatial databases currently and routinely operated by
various agencies in the Ministry of Agriculture and Cooperatives and the
Ministry of Science and Technology in Thailand.
A photoperiod-sensitive rice production ecosystem in Thailand
In 2015, Thailand had a total land area of approximately 51 million
hectares, allocated as non-agricultural lands (11 million hectares), forest lands
(16 million hectares) and agricultural lands (24 million hectares). Of the
agricultural lands, approximately 9.3 million hectares were allocated for rice
paddies during the main rice-growing season between May and December
(OAE, 2016). There were two major photoperiod-sensitive rice varieties: RD6
(glutinous rice) occupied an area of 1.7 million hectares and KDML 105 variety,
(non-glutinous fragrant rice) covered an area of 4.0 million hectares (DOAE,
2017).
A rice production ecosystem is a major contributor to food security and
generates cash income for farmers’ households and the country under various
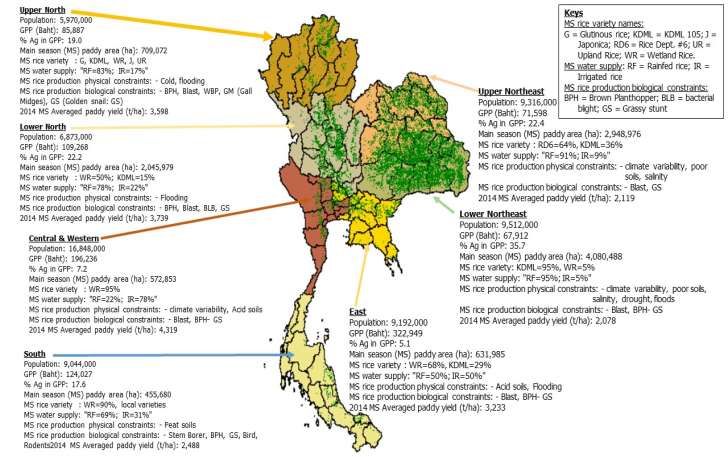
agroecosystems (AE). The Thailand Rice Department has defined seven rice
production ecosystems (Figure 1), based on provincial administrative
boundaries in Thailand. A successful rice paddy field depends on numerous
abiotic and biotic factors, such as soil physical and chemical conditions, solar
radiation, air temperature, rainfall and crop management (e.g., rice variety,
planting date, fertilizer application and water management). In addition, spatial
soil properties and weather variability cause spatial and temporal rice yield
variability. As a result, a system for forecasting seasonal photoperiod-sensitive
rice yields is an important tool for optimizing rice production ecosystems.
In 2015, Thailand was one of the principal rice (Oryza sativa L.)
exporting countries and earned foreign income of more than 150 billion Baht
with around 30 percent of the total income from fragrant rice (TREA, 2016).
During the main rice-growing season in 2015, the country allocated some 9.3
million hectares or around 39% of the total agricultural land area of the whole
Kingdom to paddy rice production (OAE, 2016).
708International Journal of Agricultural Technology 2019 Vol. 15(5): 707-722
Figure 1. Seven rice production ecosystems in Thailand. Source: Thailand Rice Department, 2018
709Thai Hom Mali rice is the principal fragrant rice category, consisting of
two varieties, namely KDML 105 and RD15 (NBACFS, 2017). According to
the farmers’ registration system used during the 2015/16 main rice-growing
season by DOAE, the areas planted with rice varieties RD15, KDML 105 and
other rice varieties are 0.3, 4.0 and 5.0 million hectares or 3%, 43% and 54% of
the total rice-planted areas, respectively (DOAE, 2017).
Current rice yield and production forecast methods
The Office of Agricultural Economics (OAE) is the only agency under the
Thai government’s Ministry of Agriculture and Cooperatives responsible for
announcing and providing the official annual data sets that cover all major
economic crops including rice. In each main rice growing season, OAE
releases forecasts and reports at a district level on rice planted areas, averaged
paddy yield and total rice production. The agency releases the report when rice
planted areas have reached approximately 40% of the total areas and when rice
is approaching the harvesting period using a statistical approach and crop
cutting method (OAE, 2014, 2016). In addition, the Geo-Informatics and Space
Technology Development Agency (GISTDA) has been producing rice planted
areas digital maps with estimates of rice yield at fortnightly intervals since 2013.
The digital maps and related information are then published and distributed in
shapefile format on GISTDA’s website (GISTDA, 2018). To estimate the
paddy rice production of a given polygon in the shapefile, the average
fortnightly paddy rice yield of a fixed rice-cropping duration of 120 days after
planting was multiplied by the area of planted rice determined from satellite
images. In summary, the methods implemented by OAE and GISTDA do not
account for the dynamics of weather and soil conditions or for rice varieties and
rice management practices in various rice ecosystems. Consequently, there is a
need for an integrated agro-informatics system to support the realistic
estimation of paddy rice yield and production, which allows the users to
incorporate weather, soil, rice variety and management practices data sets.
Furthermore, the forecasts could be issued three to four months prior to the
harvest period using process-oriented crop simulation models and spatial and
attribute data sets, including seasonal weather forecasts, soil groups, and rice-
planted areas, so that better planning can occur.
Emerging crop yield and production forecast methods
Crop yield and production forecasts for seasonal growing periods are of
interest for farmers, traders and policy makers. Various crop yield forecast
710International Journal of Agricultural Technology 2019 Vol. 15(5): 707-722
methods have been developed for quantifying production of agricultural
systems at plot, region or national levels. Sapkota et al. (2016) compared
various methods of crop production estimation with their cost-effectiveness,
scale and accuracy (Table 1). Brief descriptions of each method follow.
Crop cutting
In the 1950s, a method of forecasting crop yields by randomly sampling
frames about 1 meter by 1 meter square within a field was initially developed in
India. The crop cutting method was subsequently adopted as a standard
recommended by the Food and Agriculture Organization of the United Nations
(FAO) to estimate and forecast crop production at the harvesting period for
various crops (FAO, 1982; Fermont and Benson, 2011; Sapkota et al., 2016).
In this method, crop yields in one or more frames were measured and total crop
yield per unit area was calculated as the total production divided by the total
plot area. Sapkota et al. (2016) suggested that the size of the sampling frames
should be at least one-meter square to obtain reasonable and acceptable crop
yield and production forecasts. In a field with variable crop performance, it
was advisable to use even larger sampling frames or increase the number of
sampling frames for crop yield estimation, but it was a time and labor-intensive
method.
Remote sensing
The remote sensing method is based on the principle of differing spectral
reflectance of surfaces, i.e., crops and other land surfaces. The sensors on
board a satellite were used to collect the reflected electromagnetic radiation
signals from the surfaces, which subsequently are used to calculate the
Normalized Difference Vegetable Index (NDVI). According to Johnson et al.
(2016), the Moderate Resolution Imaging Spectroradiometer (MODIS)-NDVI
was the most effective NDVI value to forecast crop yields by Multiple Linear
Regression. However, the NDVI tracked only the vegetative development, but
could not determine crop grain yield (Mkhabela et al., 2005).
In Thailand, GISTDA, which is under the Ministry of Science and
Technology, is the only Thai Government agency in charge of providing
fortnightly data on planted-rice areas. The data has been derived from the
MODIS satellite observations since January 2014 and is provided in shapefile
format. However, these shapefiles currently do not include seasonal rice yield
forecasts by integrating a crop simulation model and seasonal climate forecasts
(GISTDA, 2018).
711Rice Simulation Models
Process-based crop simulation models, including the CSM-CERES-Rice
model (Ritchie et al., 1987; Singh et al., 1989), were designed to simulate rice
developmental stages and growth on a daily time scale. Moreover, these
models can respond to and capture different environment factors, such as
planting date, rice variety, water management, nitrogen chemical fertilizer
management and crop residue (Basso et al., 2016; Hoogenboom, 2000;
Hoogenboom et al., 2017; Jones et al., 2003; Tsuji et al., 1998). Jintrawet and
Kaeomuangmoon (2016) developed a prototype of an integrated agro-
informatics system tool called the DSS-SRY4cast tool for users to forecast
paddy rice yield four to six months in advance for six different planting dates
during the 2016 main rice-growing season in Thailand. However, they did not
specifically focus on KDML 105 at the district level.
The process-based crop and rice simulation models were used to simulate
crop growth, developmental stages, and yields that are influenced by soil profile
characteristics, daily weather data, crop variety and crop management on a
daily time step from planting until harvesting times (Hoogenboom, 2000). It
was found that these crop simulation models could be accurate and precise
when they were calibrated and evaluated with field observations from various
sites under real crop production situations (Hunt and Boote, 1998). However,
the accuracy of forecasted crop yields can be improved when there are
outbreaks of pests or plant diseases by linking pest effects to the crop model
(Teng et al., 1998).
ORYZA2000 simulation model: The International Rice Research
Institute (IRRI) and Wageningen University and Research Centre have
developed the ORYZA2000 model to simulate growth and developmental
stages of lowland rice in situations with variations of potential production, such
as water limits and nitrogen limits (Bouman et al., 2001). The ORYZA2000
model had four phenological phases: the juvenile phase, the photoperiod-
sensitive phase, the panicle development phase and the grain-filling phase
(Arora, 2006). The model followed a daily calculation scheme for the rate of
dry matter production of various rice organs and for the rate of phenological
development. By integrating these rates over time, dry matter production and
developmental stages were simulated throughout the growing season (Bouman
and van Laar, 2006). The ORYZA2000 model was not designed and tested for
photoperiod-sensitive rice varieties. The newest version has been renamed
“ORYZA version 3 (v3)” (Li et al., 2017). According to Amiri et al. (2014),
the comparison of the performance of three rice dynamic models (CSM-
CERES-Rice, AquaCrop, and ORYZA2000) in simulating biological processes
712International Journal of Agricultural Technology 2019 Vol. 15(5): 707-722
and grain yields of rice showed that the CERES-Rice model was the most
accurate in approximating grain yields under different irrigation intervals and
nitrogen applications.
Table 1. Crop yield forecast methods with description of cost effectiveness,
intended scale and precision
Crop yield Cost effectiveness Scale Precision in forecast, error and
forecast bias
methods
Crop cut Time and labor Field, farm and Tendency to overestimate
intensive sometimes
landscape level
Farmer’s Cheap and quick Farm to Fairly accurate estimation but
estimate method that saves landscape needs adequate supervision.
time and money Subjective. Sometimes farmers
deliberately overestimate or
underestimate.
Crop Cost effective Plot to Less error and bias if adequately
modeling Landscape parameterized and calibrated.
Does not include induced
improvements in agricultural
technology
Remote Cost effective Landscape Chances of error in cases where
sensing different crops have same
signature
Source: Sapkota et al. (2016)
CSM-CERES-Rice simulation model: The Decision Support System for
Agrotechnology Transfer (DSSAT) was designed to accommodate 16
simulation crop models (CSM) from the CROPGRO and CERES models and
has primary modules for weather, soil, plant, soil-plant-atmosphere, and crop
management (Jones et al., 2003). The CERES-Rice model, a model under the
DSSAT package, was developed to simulate nine rice developmental stages,
rice growth processes, and biomass partitioning of a rice crop on a daily basis
according to climatic data, water and nitrogen balances and cultivar
characteristics (Ritchie et al., 1998; Timsina and Humphreys, 2006). Bannayan
et al. (2003) indicated that the CERES-Rice model has demonstrated reliability
under different climate, soil, and management conditions. Chun et al. (2016)
and Jintrawet and Chinvanno (2011) assessed the impacts of climate change on
rice yields in Southeast Asia using the projected climate data from two climate
change models. Using the CSM-CERES-Rice model together with climate
change A2 and B2 scenarios as predicted by the PRECIS RCM, downscaled
from the ECHAM4 GCM data set, they concluded that during 1980-2099, rice
production in Thailand showed changes, with slight declines in main season
713rice yields before the 2040s and drastic decreases after this time. Similar rice
yield decreases were found when output from the Conformal Cubic
Atmospheric Model (CCAM) downscaled projections for the RCP4.5 and 8.5
scenarios (Katzfey et al., 2014; Katzfey et al., 2016) were used with the CSM-
CERES-Rice model (Jintrawet et al., 2017).
The CSM-CERES-Rice model emphasizes the effects of crop
management and the influence of weather conditions and soil properties on crop
performance. The model was designed to assess rice yield as captured by rice
varietal characteristics. The model was also used to decide on how best to
implement soil water and nitrogen management for alternative production
options and for various growing sites. Weather inputs include daily solar
radiation, maximum and minimum temperatures and precipitation. Potential
effects of extreme events, i.e., storm events, and high and low temperature are
ignored, and no pest infestations are assumed. The influence of carbon dioxide
(CO2) on photosynthesis and transpiration has recently been added to assess the
impact of increased CO2 on rice yield under various climate change scenarios.
The CSM-CERES-Rice model version 4.7, within DSSAT v4.7, has daily
outputs and requires four minimum data sets, namely weather, soil, rice genetic
coefficients, and rice management practices throughout the growing season
(Table 2).
Available spatial databases in Thailand
KDML105 rice-planted area maps
GISTDA released maps of areas planted with rice fortnightly and posted
the data set on their website (Mitkalaya et al., 2013). These rice planted areas
were processed from the MODIS surface reflectance 8-day L3 Global 250 m
SIN Grid V005 or MOD09Q1 data set from 2013 to 2015 (Bridhikittti and
Overcamp, 2012). To obtain the planted area for KDML105 rice, we linked the
fortnightly rice-planted areas shapefile, released by GISTDA six times during
the main growing season from June to August in 2013, 2014, and 2015, with
the farmer registration database administered and operated by the DOAE. By
linking data from these two sources, we created the KDML105 planted-area
shapefiles data sets with administration codes for the 2013 to 2015 growing
seasons for six planting dates for each growing season (Table 1). During the
periods of these six planting dates, on average all 77 districts received about
180–300 mm of rain per month, which is sufficient to produce a reasonably
good rice crop (Yoshida, 1981).
714International Journal of Agricultural Technology 2019 Vol. 15(5): 707-722
Table 2. Contents of minimum data sets for operation of the CSM-CERES-Rice
model
Data set Description
Required minimum data sets
Weather Daily global solar radiation, maximum and minimum air temperatures,
precipitation
Soil Classification using the local system and (to family level) the USDA-
NRCS taxonomic system
Basic profile characteristics by soil layer: in situ water release curve
characteristics (saturated drained upper limit, lower limit); bulk density,
organic carbon; pH; root growth factor; drainage coefficient
Rice genetic Four phenological and four growth coefficients for each rice variety.
coefficients
Crop Soil water, ammonium and nitrate concentration by soil layer
Management Cultivar name and type
Planting date, depth and method; row spacing and direction; plant
population
Irrigation and water management, dates, methods and amounts or
depths
Chemical fertilizer (inorganic) applications
Residue (organic fertilizer) applications (material, depth of
incorporation, amount and nutrient concentrations).
Auxiliary data set
Site Latitude and longitude, elevation; average annual temperature; average
annual amplitude in temperature
Slope and aspect; major obstruction to the sun (e.g. nearby mountain);
drainage (type, spacing and depth); surface stones (coverage and size)
Initiate conditions Previous crop, root, and nodule amounts; numbers and effectiveness of
rhizobia (nodulating crop)
Source: Jones et al. (2003).
Seasonal weather forecasts in Thailand
Weather conditions have significant impacts on crop growth and
developmental stages and have major impacts on pests and diseases, so crop
yield variability is affected by year-to-year climatic variability (Hoogenboom,
2000). Accurate forecasts of weather 3–6 months in advance can potentially
allow farmers and policy makers in various agricultural systems to make proper
decisions to reduce unwanted impacts or take advantages of expected favorable
climate and weather conditions (Jones et al., 2000).
Statistical seasonal weather forecast data sets, generated from the historic
range of climate variations, can be applied to estimate current crop conditions
or potential yields. During the beginning of the crop growing season these
forecasts have ranges of predictions for variables such as temperature and
715rainfall rather than specific values due mainly to the incorporation of all
historical climate variability, leading to a large range of possible outputs from
the models. Dynamical seasonal climate models, such as the Weather Research
and Forecasting (WRF) model, offer the opportunity to narrow this range,
contingent on the models having adequate predictive skill (Brown et al., 2018).
WRF is a widely used open-source model that allows the users to create
different configurations tailored to the needs of each study. The WRF model is
based on physical principles (Chotamonsak et al., 2011), and can provide
probabilistic predictions of the seasonal mean climate. It also generates daily
time series of the evolution of the weather and thus provides more detailed
information on the weather statistics during the season. These daily time series
can be used to drive applications models such as a crop model; however, some
spatial downscaling of the data may be required. Grosz et al. (2015) applied
and tested WRF with the DNDC model (DeNitrification DeComposition Model)
for greenhouse gas flux simulation. Kioutsioukis et al. (2016) applied high
resolution (2-kilometer grid) WRF ensemble forecasting data to irrigation.
Capa-Morocho et al. (2016) found that disaggregating seasonal climate
forecasts into daily weather data and using it as input data for crop simulation
models provided predictability for crop yield and production. The crop yield
forecasts and irrigation requirements from the crop model could be considered
as a production cost and were used to analyze likely gross margins to help
farmers making a decision when the seasonal rainfall forecast was below
normal.
Applications of weather forecast data sets to agricultural decision
problems are, therefore, numerous and rely on the possibility of translating the
meteorological content of the forecasts into agricultural terms. Users can gain
economic benefits from weather information for short-term (tactical) decisions
as well as long-term (strategic) decisions. In many areas of the world, access to
seasonal weather forecasts is still limited, but efforts are being undertaken at
various levels to improve on this situation (Calanca, 2014).
Decision support system tools in Thailand
Jintrawet (2009) developed the Crop Production Systems Decision
Support System (CropDSS), which consists of the Spatial Database
Management System (SDBMS), Model Base Management System (MBMS),
analysis programs and map display functions (Figure 2). This tool facilitated
linking of four minimum spatial databases, namely administrative boundary,
crop planted areas, soil series boundary, and climate grid maps with four crop
simulation models under the DSSAT package.
716International Journal of Agricultural Technology 2019 Vol. 15(5): 707-722
The CropDSS agro-informatics tool was used to simulate potential rice
production options for Thailand under various climate change scenarios. Under
the ECHAM4 SRES A2 scenario, predictions of rainfed rice production in the
Chi and Moon River Basin in the northeast of Thailand show that rice yield will
be increased at the rates of 15.5 and 11.1 percent compared to recent Chi and
Moon rice yields, respectively, by the year 2099 (Buddhaboon and Jintrawet,
2009). When data from multiple high-resolution (10 km) downscaled
simulations produced using the Conformal Cubic Atmospheric model (Katzfey
et al., 2014; Katzfey et al., 2016) for two CMIP5 RCPs (lower 4.5 and high 8.5
greenhouse gas concentrations) were input into the CROPDSS agro-informatics
tool, it was shown that most projections give a decrease in rice yields during
2006–2040 relative to the baseline (Jintrawet et al., 2017).
Figure 2. Overview of the components and modular structure of CropDSS
interface, Source: Jintrawet (2009)
Jintrawet and Kaeomuangmoon (2016) have developed an agro-
informatics prototype called the DSS-SRY4cast tool for users to produce rice
yield forecasts 4-6 months in advance for six planting dates during the 2016
main rice-growing season in Thailand. However, there are no estimates of the
environmental and economic risk of rice production scenarios in various parts
of the country.
717A reliable seasonal paddy rice yield forecast system requires as a
minimum spatial data sets and attribute data sets, i.e., rice cropping
management, rice planted area, soil group and seasonal weather forecast data
sets, which are provided by various Thai agencies. The rice-planted areas data
set is updated fortnightly and the seasonal weather forecast data set is updated
monthly. Each data set is large and covers rice-planted areas throughout the
country. SDBMS can help to store large data sets and connect to GIS software
to create maps, conduct data analysis and produce visualizations of spatial data
(Tragila et al., 2010; Van Den Eeckhaut and Hervás, 2012; Jäger, 2018).
Discussion
Non-glutinous fragrant rice variety KDML 105 covered an area of
approximately 4.0 million hectares or 43% of annual total rice planted in
Thailand (DOAE, 2017; OAE, 2014, 2016). Because rice is linked with food
and income security of millions of small farm households, it is imperative and
essential for the country to invest in the development and implementation of a
reliable and accurate rice yield estimation tool (Supit, 1997).
The availability of climate and crop simulation models and spatial data
sets in Thailand offer a unique opportunity for integrating data and information
on the bio-physical properties of the major staple food crop in various rice
ecosystems in Thailand, especially fragrant rice KDML 105 (OAE, 2014, 2016;
Mitkalaya et al., 2013). Spatial data sets, together with geo-referenced maps
and a dynamically downscaling climate model such as CCAM and WRF can be
used for providing production forecasts and seasonal estimates of rice yield 3-4
months in advance using an integrated agro-informatic tool. The geo-
referenced maps from GISTDA and attribute data sets from other agencies in
Thailand could be linked with other field-level data sets (GISTDA, 2018).
Conclusion
We have reviewed various methods and approaches for estimating
seasonal fragrant rice production in Thailand. Seasonal rice production
techniques have advanced greatly over the last few decades and improved
substantially in recent years. These improvements were due to better
understanding of soil-plant-weather-management processes, advances in
computing, improved simulation models, increased availability of data and
higher standards enhance the ability to implement decision support systems. In
conclusion, the real value of using simulation models and spatial data sets,
combined as an integrated agro-informatic forecasting tool, as described in our
718International Journal of Agricultural Technology 2019 Vol. 15(5): 707-722
review, is that it will help the farmers and policy makers to collaboratively
utilize and optimize agricultural resources for sustainable fragrant rice
production systems.
Acknowledgement
This research was financially supported in part by three research grants CMU-TRF-
RDG58A0013, CMU-TRF-SRC5920201, and CMU-TRF-SRC6020201. All products in this
publication are solely for the purpose of KDML105 seasonal fragrant rice production forecast
development and do not imply recommendation or endorsement by TRF.
We acknowledge the World Climate Research Programme’s Working Group on Coupled
Modelling, which is responsible for CMIP and for producing and making available their model
output. For CMIP, the U.S. Department of Energy’s Program for Climate Model Diagnosis and
Intercomparison provides coordinating support and leads development of software
infrastructure in partnership with the Global Organization for Earth System Science Portals.
References
Amiri, E., Rezaei, M., Rezaei, E. E. and Bannayan, M. (2014). Evaluation of CERES-Rice,
Aquacrop and Oryza2000 Models in Simulation of Rice Yield Response to Different
Irrigation and Nitrogen Management Strategies. Journal of Plant Nutrition, 37:1749-
1769.
Arora, V. K. (2006). Application of a Rice Growth and Water Balance Model in an Irrigated
Semi-arid Subtropical Environment. Agricultural Water Management, 83: 51-57.
Baigorria, G. A., Chelliah, M., Mo, K. C., Romero, C. C., Jones, J. W., O’Brien, J. J. and
Higgins, R. W. (2010). Forecasting Cotton Yield in the Southeastern United States using
Coupled Global Circulation Models. Agronomy Journal, 102:187-196.
Bannayan, M., Kazuhiko, K., Han-Yong, K., Mark, L., Masumi, O. and Shu, M. (2005).
Modeling the interactive effects of atmospheric CO2 and N on rice growth and yield.
Field Crops Research, 93:14.
Basso, B., Liu, L. and Ritchie, J. T. (2016). A comprehensive review of the CERES-Wheat, -
Maize and -Rice Models’ Performances. Advances in Agronomy, 136:27-132.
Bouman, B. A. M. and van Laar, H. H. (2006). Description and evaluation of the rice growth
model ORYZA2000 under nitrogen-limited conditions. Agricultural Systems, 87:249-
273.
Bouman, B. A. M. (2001). Water-efficient management strategies in rice production. Int. Rice
Res. Notes. 26.
Bridhikitti, A. and Overcamp, T. J. (2012). Estimation of Southeast Asian rice paddy areas with
different ecosystems from moderate-resolution satellite imagery. Agriculture,
Ecosystems & Environment, 146:113-120.
Brown, J.N., Hochman, Z., Holzworth, D. and Horan, H. (2018). Seasonal Climate Forecasts
Provide More Definitive and Accurate Crop Yield Predictions. Agricultural and Forest
Meteorology, 260: 247-254.
Buddhaboon, C. and Jintrawet, A. (2009). Impacts of Climate Change on Rice Production in
Chi-Moon river basin. KKU Research Journal, 14: 611-625.
Calanca, P. (2014). Weather forecasting applications in agriculture. Reference Module in Food
Science, from Encyclopedia of Agriculture and Food Systems, 437-449.
719Cantelaube, P. and Terres, J. M. (2005). Seasonal weather forecasts for crop yield modelling in
Europe. Tellus A: Dynamic Meteorology and Oceanography, 57:476-487.
Capa-Morocho, M., Ines, A. V. M., Baethgen, W. E., Rodrí guez-Fonseca, B., Han, E. and
Ruiz-Ramos, M. (2016). Crop yield outlooks in the Iberian Peninsula: Connecting
seasonal climate forecasts with crop simulation models. Agricultural Systems, 149:75-87.
Challinor, A. (2009). Towards the development of adaptation options using climate and crop
yield forecasting at seasonal to multi-decadal timescales. Environmental Science &
Policy, 12:453-465.
Chotamonsak, C., Salathé, E. P. J., Kreasuwan, J. and Chantara, S. (2011). Projected climate
change over Southeast Asia simulated using a WRF regional climate model.
Atmospheric Science Letters, 12:213-219.
Chun, J. A., Li, S., Wang, Q., Lee, W. S., Lee, E. J., Horstmann, N., HPark, O., Veasna, T.,
Vanndy, L., Pros, K. and Vang, S. (2016). Assessing rice productivity and adaptation
strategies for Southeast Asia under climate change through multi-scale crop modeling.
Agricultural Systems.
DOAE (Department of Agricultural Extension) (2017). Rice Farmers’ Registration System.
[Online]. Available: http://farmer.doae.go.th/ [1 April 2018]
FAO (Food and Agriculture Organization of the United Nations) (1982). Estimation of Crop
Areas and Yields in Agricultural Statistics. Rome: FAO.
Fermont, A. M. and Benson, T. (2011). Estimating Yield of Food Crops Grown by Smallholder
Farmers: A review in the Uganda context. IFPRI Discussion paper 01097.
GISTDA (Geo-Informatics and Space Technology Development Agency (Public Organization))
2018. Planting Rice Monitoring System from Satellite in Thailand. [Online]. Available:
http://rice.gistda.or.th [1 April 2018].
Grosz, B., Horváth, L., Gyöngyösi, A. Z., Weidinger, T. and André, K. (2015). Use of WRF
result as meteorological input to DNDC model for greenhouse gas flux simulation.
Atmospheric Environment, 122:230-235.
Hoogenboom, G., Porter, C. H., Shelia, V., Boote, K. J., Singh, U., White, J. W., Hunt, L. A.,
Ogoshi, R., Lizaso, J. I., Koo, J., Asseng, S., Singels, A., Moreno, L. P. and Jones, J. W.
(2017). Decision Support System for Agrotechnology Transfer (DSSAT) Version 4.7.
DSSAT Foundation. Gainesville, Florida, USA. [Online]. Available: https://DSSAT.net.
[1 April 2018].
Hoogenboom, G. (2000). Contribution of agrometeorology to the simulation of crop production
and its applications. Agricultural and Forest Meteorology, 103:137-157.
Hunt, L. A. and Boote, K. J. (1998). Data for model operation, calibration, and evaluation. pp 9-
39, In Tsuji, G. Y., Hoogenboom, G. and Thornton, P. K. Understanding options for
Agricultural Production. Kluwer Academic.
Jäger, A. D., Onduru, D., van Wijk, M. S., Vlaming, J. and Gachini, G. N. (2001). Assessing
sustainability of low-external-input farm management systems with the nutrient
monitoring approach: a case study in Kenya. Agricultural Systems. 69:99-118.
Jintrawet, A. (2009). A Decision Support System to Study the Impact of Climate Change on
Food Production Systems. KKU Research Journal, 14: 589-600.
Jintrawet, A. and Chinvanno, S. (2011). Assessing Impacts of ECHAM4 GCM Climate Change
Data on Main Season Rice Production Systems in Thailand. APN Science Bulletin, 1:29-
34.
Jintrawet, A. and Kaeomuangmoon, T. (2016). A Decision Support System for Seasonal Rice
Yield Forecast 3-6 Months (DSS-SRY4cast). A Research Final Report, Proj ID:
RDG58A0013, submitted to The Thailand Research Fund (TRF). Bangkok, Thailand.
720International Journal of Agricultural Technology 2019 Vol. 15(5): 707-722
Jintrawet, A., Chitnucha B., Jerasorn S. and Archevarahuprok, B. (2017). Developing and
Applying Climate Information for Supporting Adaptation in South East AsiaThailand
Case Study: Impact of Projected Climate Change on Rice Production Systems. A case
study report prepared under the Asian Development Bank (ADB) TA-8359 REG.
(http://www.rccap.org/wp-content/uploads/2017/04/Thailand-FS-170622-web.pdf).
Johnson, M. D., Hsieh, W.W., Cannon, A. J., Davidson, A. and Bédard, F. (2016). Crop yield
forecasting on the canadian prairies by remotely sensed vegetation indices and machine
learning methods. Agricultural and Forest Meteorology, 218-219: 74-84.
Jones, J. W., Hansen, J. W., Royce, F. S. and Messina, C. D. (2000). Potential benefits of
climate forecasting to agriculture. Agriculture, Ecosystems & Environment, 82:169-184.
Jones, J. W., Hoogenboom, G., Porter, C. H., Boote, K. J., Batchelor, W. D., Hunt, L. A.,
Wilkens, P. W., Singh, U., Gijsman, A. J. and Ritchie, J. T. (2003). The DSSAT
cropping system model. Europ. J. Agronomy, 18:235-265.
Katzfey, J. J, McGregor, J. L. and Suppiah, R. (2014). High-resolution climate projections for
Vietnam. Technical Report, CSIRO, Australia, pp.266.
Katzfey, J., Nguyen, K., McGregor, J. L., Hoffmann, P., Ramasamy, S., Nguyen, H. V., Khiem,
M. V., Nguyen, T. V., Truong, K. B., Vu, T. V., Nguyen, H. T., Thuc, T., Phong, D. H.,
Nguyen, B. T., Tan, O. V., Trung, N. Q., Thanh, N. D. and Long, T. T. (2016). High-
resolution simulations for Vietnam-methodology and evaluation of current climate.
Asia-Pacific Journal of Atmospheric Science, 52: 91. https://doi.org/10.1007/s13143-
016-0011-2.
Kioutsioukis, I., de Meij, A., Jakobs, H., Katragkou, E. and Kazantzidis, A. (2016). High
resolution WRF ensemble forecasting for irrigation: Multi-variable evaluation.
Atmospheric Research, 167:156-174.
Koide, N., Robertson, A. W., Ines, A. V. M., Qian, J.-H., DeWitt, D. G. and Lucero, A. (2013).
Prediction of rice production in the philippines using seasonal climate forecasts. Journal
of Applied Meteorology and Climatology, 52:552-569.
Li, T., Angeles, O., Marcaida III, M., Manalo, E., Manalili, M. P., Radanielson, A. and
Mohanty, S. (2017). From ORYZA2000 to ORYZA (v3): An improved simulation
model for rice in drought and nitrogen-deficient environments. Agricultural and Forest
Meteorology, 237-238: 246-256.
Mauget, S., Leiker, G. and Nair, S. (2013). A web application for cotton irrigation management
on the U.S. Southern High Plains. Part I: Crop yield modeling and profit analysis.
Computers and Electronics in Agriculture, 99:248-257.
Mitkalaya, A., Thianthai, P. and Nuangjumnong, P. (2013). Geo-informatics for Rice
Monitoring and Yield Estimation in Thailand.
Mkhabela, M. S., Mkhabela, M.S. and Mashinini, N. N. (2005). Early maize yield forecasting
in the four agro-ecological regions of Swaziland using NDVI data derived fom NOAA's-
AVHRR. Agricultural and Forest Meteorology, 129:1-9.
NBACFS (National Bureau of Agricultural Commodity and Food Standards) (2017). Thai
Agricultural Standard: Thai Hom Mali Rice. Ministry of Agriculture and Cooperatives,
Bangkok, Thailand.
OAE (Office of Agricultural Economics) (2014). Agricultural Statistics of Thailand 2013.
Ministry of Agriculture and Cooperatives, Bangkok, Thailand.
OAE (Office of Agricultural Economics) (2016). Agricultural Statistics of Thailand 2015.
Ministry of Agriculture and Cooperatives, Bangkok, Thailand.
Ratjen, A. M. and Kage, H. (2015). Forecasting yield via reference- and scenario calculations.
Computers and Electronics in Agriculture, 114:212-220.
721Ritchie, I. J., Singh, U., Godwin, D. and Bowen, W. T. (1998). Cereal growth, development and
yield. In Tsuji, G. Y., Hoogenboom, G. and Thornton, P. K. Understanding Options for
Agricultural Production. Dordrecht, Boston, London, Kluwer Academic Publishers in
cooporation with International Consortium for Agricultural Systems Applications, pp.
79-98.
Ritchie, J. T., Alocilja, E. C., Singh, U. and Uehara, G. (1987). IBSNAT and the CERES-rice
model. Weather and rice. Proceedings of the International Workshop on the Impact of
Weather Parameter on Growth and Yield of Rice, Manila, Philippines, International Rice
Research Institute, Manila, Philippines, pp:271-281.
Sapkota, T. B., Jat, M. L., Jat, R. K., Kapoor, P. and Stirling, C. (2016). Yield estimation of
food and non-food crops in smallholder production systems. Methods for measuring
greenhouse gas balances and evaluating mitigation options in smallholder agriculture.
Rosenstock, T. S., Rufino, M. C., Butterbach-Bahl, K., Wollenberg, E. and Richards, M.
Springer International Publishing, 163-174.
Singh, U., Ritchie, J. T. and Godwin, D. C. (1989). A user's guide to CERES-Rice model v2.10.
International Fertilizer Development Center, P.O. Box 2040, Muscle Shoals, Alabama
35662, USA, pp.131.
Supit, I. (1997). Predicting national wheat yields using a crop simulation and trend models.
Agricultural and Forest Meteorology, 88:199-214.
Teng, P. S., Batchelor, W. D., Pinnschmidt, H. O. and Wilkerson, G. G. (1998). Simulation of
pest effects on crops using coupled pest-crop models: The potential for decision support.
In Tsuji, G.Y. et al. eds. 1998. Understanding Options for Agricultural Production.
London: Kluwer Academic Publishers.
Thailand Rice Department (2018). iRiceZoning 2.5. [Online] Available:
http://carsr.agri.cmu.ac.th:88/Research/2016/iRPZ_25/index.html [28 April 2019].
Timsina, J. and Humphreys, E. (2006). Applications of CERES-Rice and CERES-Wheat in
Research, Policy and Climate Change Studies in Asia: A Review. International Journal
of Agricultural Research, 1:202-225.
TREA (Thai Rice Exporters Association) (2016). Rice export quantity and value: 2015.
[Online]. Available: http://www.thairiceexporters.or.th/statistic_2015.html [1 April
2018].
Tsuji, G. Y., Hoogenboom, G. and Thornton, P. J. (1998). Understanding options for
agricultural production. Kluwer Academic Publishers in cooperation with ICASA, pp.
399.
Van, D. E. and Hervás, J. (2012). State of the art of national landslide databases in Europe and
their potential for assessing landslide susceptibility, hazard and risk. Geomorphology,
139-140:545-558.
Yoshida, S. (1981). Fundamentals of rice crop science. Los Banos, Philippines, International
Rice Research Institute, pp. 269.
Zhang, N., Wang, M. and Wang, N. (2002). Precision agriculture-a worldwide overview.
Computers and Electronics in Agriculture, 36:113-132.
(Received: 25 May 2019, accepted: 31 August 2019)
722You can also read