Genomic Selection for Optimum Index with Dry Biomass Yield, Dry Mass Fraction of Fresh Material, and Plant Height in Biomass Sorghum - MDPI
←
→
Page content transcription
If your browser does not render page correctly, please read the page content below
G C A T
T A C G
G C A T
           genes
Article
Genomic Selection for Optimum Index with Dry
Biomass Yield, Dry Mass Fraction of Fresh Material,
and Plant Height in Biomass Sorghum
Ephrem Habyarimana 1, * , Marco Lopez-Cruz 2 and Faheem S. Baloch 3
 1   CREA Research Center for Cereals and Industrial Crops, via di Corticella 133, 40128 Bologna, Italy
 2   Crop, Soil, and Microbial Sciences Department, Michigan State University, 1066 Bogue St, East Lansing,
     MI 42824, USA; lopezcru@msu.edu
 3   Department of Field Crops, Faculty of Agricultural and Natural Sciences, Abant Izzet Baysal University,
     14030 Bolu, Turkey; balochfaheem13@gmail.com
 *   Correspondence: ephrem.habyarimana@crea.gov.it

 Received: 2 December 2019; Accepted: 1 January 2020; Published: 5 January 2020

 Abstract: Sorghum is one of the world’s major crops, expresses traits for resilience to climate
 change, and can be used for several purposes including food and clean fuels. Multiple-trait genomic
 prediction and selection models were implemented using genotyping-by-sequencing single nucleotide
 polymorphism markers and phenotypic data information. We demonstrated for the first time the
 efficiency genomic selection modelling of index selection including biofuel traits such as aboveground
 biomass yield, plant height, and dry mass fraction of the fresh material. This work also sheds light,
 for the first time, on the promising potential of using the information from the populations grown
 from seed to predict the performance of the populations regrown from the rhizomes—even two
 winter seasons after the original trial was sown. Genomic selection modelling of the optimum index
 selection including the three traits of interest (plant height, aboveground dry biomass yield, and
 dry mass fraction of fresh mass material) was the most promising. Since the plant characteristics
 evaluated herein are routinely measured in cereal and other plant species of agricultural interest, it
 can be inferred that the findings can be transferred in other major crops.

 Keywords: Sorghum bicolor; Sorghum halepense; genomic selection; genomic prediction; optimum
 index; index selection; biomass; yield; plant height; GBS SNP

1. Introduction
     Relying on fossil fuels is a major challenge to a world struggling to adapt and mitigate climate
change [1]. In this context, biomass sorghum is a cereal crop that can play an important role for
sustainable and environment friendly farming, as it is particularly resilient to drought stress [2] and is
more energy efficient than most plant species of agricultural interest, including maize and sugarcane [1].
Sorghum biomass can be used to produce several types of green fuels including biogas and bioethanol,
with reduced greenhouse emissions, which are less polluting for the environment relative to fossil
fuels [3]. Biomass yield is the primary trait in biomass sorghum, as it measures productivity and
profitability of the farmer. Sorghum biomass yields are positively correlated with plant height, maturity,
and the concentration of the dry mass [1]. Breeding efforts to increase biomass production should
therefore mostly focus on these plant characteristics.
     Efficient breeding requires also knowledge-based selection strategies that efficiently exploit
available phenotypic and genotypic information that existed in the crop of interest. Since the economic
value of the final product in a breeding program depends on several traits [4,5], it can be inferred
that selecting the parents for the next generation based on several different plant characteristics

Genes 2020, 11, 61; doi:10.3390/genes11010061                                      www.mdpi.com/journal/genes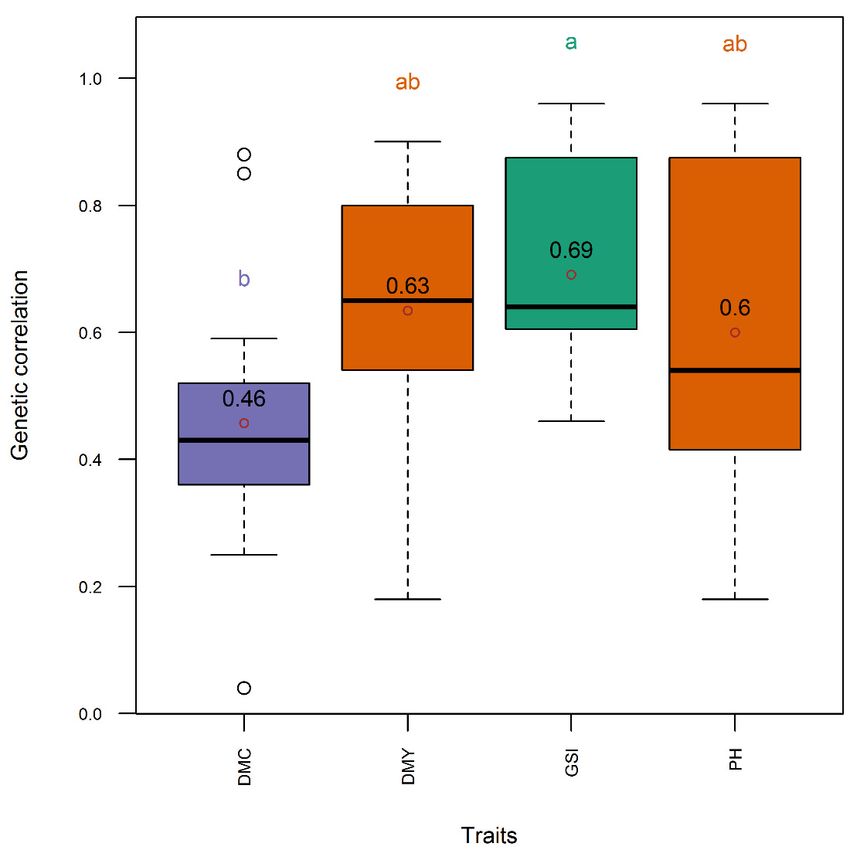
Genes 2020, 11, 61                                                                                     2 of 16

can improve genetic gain. Genomic selection (GS) showed good results in the selection of complex
quantitative traits like yields [6,7] and it has been successfully implemented in plant breeding and
animal husbandry [8,9]. The main features of the GS approach is the use of algorithms that combine
phenotypes and high-density marker data to predict genetic merit upon which superior unphenotyped
candidates are selected [10,11]. This attribute is particularly interesting as it can reduce the costs
associated with evaluating trials, shorten generation interval, and bypass the extensive field progeny
testing that are otherwise required to select parental lines to be used in crossing blocks [12]. Several
genomic selection methods have been developed and successfully implemented in plant breeding
programs and in animal husbandry [13–15]. Despite the GS success stories, studies on the application
of genomic models in sorghum are limited compared to other cereal crops, such as maize, wheat, and
rice [16]. For instance, a first genomic selection study in grain sorghum was reported by Hunt et al. [17]
for prediction of test-cross performance in individual trials. Velazco et al. [12] investigated different
genomic models including pedigree information for across-environment prediction of parental breeding
values in productivity and adaptability traits [10].
      Most of genomic selection algorithms implemented thus far were based on the analysis of single
traits, while selection index has had limited use in actual plant breeding programs [18–20]. Nonetheless,
available results indicate that selection index for improving a single trait would not outperform direct
selection for the trait itself, whereas selecting simultaneously for more than one trait in selection index
might outperform selecting for a single trait [20]. With the use of selection indices, individuals with
very high merit in some traits are saved for breeding, even when they are slightly inferior in other
traits [19,21], which can not only sustain productivity but can also safeguard genetic diversity. The
selection index represents a joint analysis of multiple traits and can increase the accuracy of genetic
evaluations in comparison with the single-trait analysis as it exploits the information from correlated
traits [22].
      The genomic selection index (GSI) is a linear combination of genomic estimated breeding values
(GEBVs) used to predict the individual net genetic merit upon which individual candidates are selected
from a nonphenotyped testing population as parents of the next selection cycle [19]. The efficiency of
applying selection index in breeding depends on the strength of genetic and environmental correlations
between the characters of interest. According to Thompson and Meyer [23], the benefit of selection
index increases for lowly heritable traits, when analyzed together with strongly correlated traits of
higher heritability. Another selection index advantage is represented by the possibility to reduce
selection bias or culling bias introduced by contemporary or sequential selection on correlated traits,
which are ignored by single-trait approaches [24]. The importance of selection index in genomic
selection was demonstrated in empirical and simulation studies [3,25,26]. It was shown that genomic
selection index models can efficiently be used to integrate information from correlated traits and from
relatives. For this purpose, a breeder interested in response to selection for a single target trait, can
incorporate other auxiliary traits in the index to provide additional information on the primary trait.
      The efficiency of genomic selection index (GSI) models was shown in other cereal crops including
maize, rice, and wheat [27–29]. In sorghum, GSI was implemented only in advanced breeding lines of
grain sorghum [12] and in biomass-type genotypes using a pre-breeding population [3]. In the later
work, the objective was to apply the GSI on auxiliary characters to indirectly predict the genomic
estimated breeding value corresponding to the primary trait. In this work, we present, for the first
time, a study we conducted on the potential of exploiting selection index for genomic selection in a
panel of 380 biomass sorghum genotypes consisting of a mixture Sorghum bicolor landraces and lines
and S. bicolor × S. halepense advanced inbred lines. Our objectives were to: (1) investigate if the use of a
genomic selection index made up of aboveground dry biomass yield, dry mass fraction of the fresh
mass material, and plant height can improve prediction accuracy relative to a single trait genomic
selection index, and (2) investigate the efficiency of genomic selection indices in S. bicolor × S. halepense
regrown from the rhizomes (overwintered testing set) using the populations grown from seeds as
training set.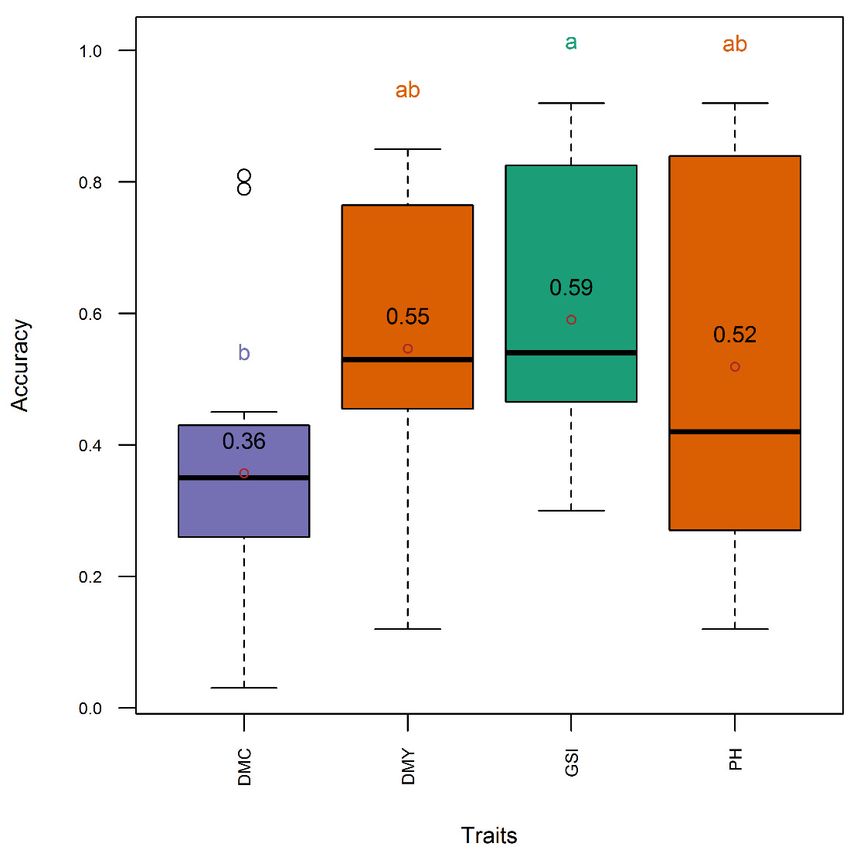
Genes 2020, 11, 61                                                                                                         3 of 16

2. Materials and Methods

2.1. Phenotypic and Genotypic Data
      Plant materials evaluated in this work belonged to a panel of 369 biomass sorghum genotypes of
which 180 Sorghum bicolor landraces and lines and 189 S. bicolor × S. halepense advanced recombinant
inbred lines beyond the F7 filial progeny. The two populations were evaluated at the same experimental
site. Field trials covered four years (2014–2017 for S. bicolor and 2015–2018 for S. bicolor × S. halepense)
for each population and were run side-by-side, except for in 2014 where only a Sorghum bicolor trial
was planted. For the S. bicolor × S. halepense trials, the entire population was evaluated each year except
in 2015 where only half the population was sown owing to scarce seed availability. Overall, there were
four trials for S. bicolor population and nine trials for S. bicolor × S. halepense population. Of the nine
trials of the later population, six were plants regrown from overwintered rhizomes, while three were
trials grown from seeds. The list and the sizes (number of tested genotypes excluding checks) of the
trials evaluated for each trait are presented in Table 1.

                     Table 1. Trials and respective sizes of populations and the traits evaluated.

                                         Trials              PH          DMC          DMY 1
                                        IT14                 174          123           123
                                        IT15                 179          179           179
                                        IT16                 180          NA            180
                                        IT17                 168          168           168
                                      US15_DS                 90           90            90
                                     US15_RG16               89           89            89
                                     US15_RG17               85           85            85
                                     US15_RG18               85           85            85
                                      US16_DS                189          189           189
                                     US16_RG17               189          189           189
                                     US16_RG18               189          189           189
                                      US17_DS                189          189           189
                                     US17_RG18               189          189           189
      1 IT and US, respectively, denote S. bicolor and S. bicolor × S. halepense trials. DS, RG, PH, DMC, DMY, respectively,
      denote trials grown from seeds (direct sowing trials), trials regrown from overwintered rhizomes (regrowth trials),
      plant height, dry mass fraction of the fresh material, and aboveground dry biomass yield. Number following IT and
      US are the years of direct sowing trials, while the numbers following RG are the years of the regrowth trials. “NA”
      indicates that the data was not scored.

      All the experiments were open-field trials and were established at CREA Research Center for
Cereal and Industrial Crops, in the experimental station of Cà Rossa in Anzola (Bologna, Italy). The
augmented randomized complete block design was used with six controls (checks) and six blocks [30]
except US15 trials which had four checks and 4 blocks. Elementary plots were single 5 m long rows
distant 0.75 m, and were thinned to homogeneously distributed 50 plants per plot. We evaluated
open field morpho-physiological data on aboveground dry biomass yields (DMY, t ha−1 ), plant height
(PH, cm), and dry mass fraction of the fresh material (DMC, %), as suggested by IBPGR [31]. Plant
height was measured one week before harvest as the mean height of the elementary plot using a 5 m
telescopic rod (Stanley 5 m grade rod aluminium) placed vertically on the ground in the middle of the
row. Aboveground dry biomass yield and the dry mass fraction of the fresh material were measured as
follows. The entire plot was machine chopped and fresh weight plot yield scored. Immediately after a
plot was weighed, a sample was taken from each plot then weighed before and after oven drying at 80
◦ C to constant weight to determine moisture content. Dry mass fraction of the fresh material (DMC%)

= (sample dry weight/sample wet weight) × 100. Aboveground dry biomass yield in metric tons per
hectare (DMY t ha−1 ) = ((total plot wet weight (kg) × (sample dry weight/sample wet weight))/ plot
area (m2 )) × 10.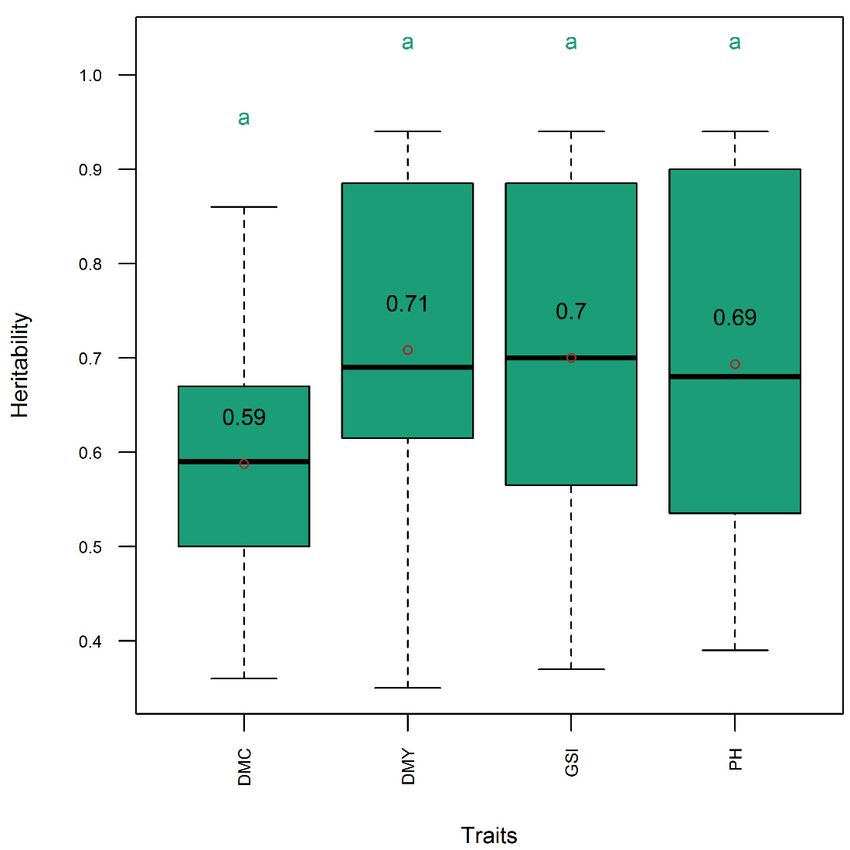
Genes 2020, 11, 61                                                                                                 4 of 16

2.2. Phenotypic Data Analysis
      Data from single trials were analyzed in two steps. In the first step, the adjusted means were
calculated as suggested by Federer [30] to account for the variability of soil properties. In the second step,
adjusted means from each trial were jointly analyzed to estimate genotype means across environments.
The model fitted was as follows: yik = µ + Gi + Ek + GEik + εik , where yik is the best linear unbiased
estimation (BLUE) of i-th genotype in the k-th environment, which was fitted by a random genotype
effect (Gi ), a fixed environmental effect (Ek ), and the genotype × environment interaction (GEik ). Given
that genotype effects were considered random, the GE interaction involving Gi was random. All
random effects were assumed independent homoscedastic and normally distributed with zero mean.
The best linear unbiased estimates were used in the subsequent processes of fitting the genomic
selection models.

2.3. Molecular Data
      DNA extraction and whole-genome genotyping procedures were amply described in
Habyarimana and Lopez-Cruz [10]. The molecular information used in this work consisted of
genotyping-by-sequencing single nucleotide polymorphisms (GBS SNPs) produced by BGI Hong
Kong Company Limited. To prepare the library, the ApeKI, a methylation-sensitive restriction enzyme,
was used, and GBS was carried out on an Illumina HiSeq X Ten platform. For variants discovery, the
sequencing reads were aligned to the sorghum reference genome (Sorghum_bicolor NCBIv3). The SNP
datasets were filtered using VCF tools to extract marker data responding to high quality standards such
as biallelic SNPs only, minor allele frequency (MAF) ≥ 0.05, site quality or the Phred-scaled probability
that reference/alternative alleles polymorphism exists at a given site given the sequencing data Q ≥
40 (i.e., base call accuracy ≥ 99.99%), and missing genotypes (NA) ≤ 20%. The final size of the high
quality-controlled marker dataset matrix was 61,976 SNPs which were used in downstream steps in
this work for genomic prediction and selection analytics.

2.4. Construction of Genomic Selection Indices
       In matrix notation, an optimum phenotypic selection index (PSI) [32] takes the following form [20]
          p                                h          i
            β j xij = β0 xi where β0 = β1 β2 . . . .βp is a vector of coefficients, p is the number of traits on
         P
Ii =
        j=1
                 h             i
Ii , and xi = xi1 , . . . , xip is a vector of p measured phenotypic values which are centered with respect
to their respective means. The linear genomic selection index for individual i is represented by the
                                                          t                                    h                       i
                                                             α j g yij = β0 g yi where ǵ yi = g yi1 g yi2 . . . .g yit is
                                                          P
aggregate genotypes H and was defined as Hi =
                                                           j=1
a vector of the genotypic values of t selection targets yi and α0 = [α1 α2 . . . ., αt ] a vector of known and
fixed economic weights [19]. Under the breeding perspective, economic values are used to reflect the
relative importance of the traits of interest. The economic value is the increase in profit achieved by
improving a particular trait by one unit [33,34]. In case of several traits, the total economic value is a
linear combination of the breeding values of the traits weighted by their respective economic values as
in the above equation [19,32], and this is called the net genetic merit (or aggregate genotype, selection
target) of one individual.
      To be used in the optimum indices, the β j are derived such that Ii is maximally correlated with
Hi , the solution of which is found to be the following matrix equation [20,35] β̂ = P−1           x Gx,y α. The
matrices Gx,y and Px are, respectively, the genotypic covariance between the measured phenotypes
and the selection targets, and the phenotypic variance-covariance among the measured phenotypes.
On the other hand, β̂ is the best linear unbiased predictor (BLUP) of β j , while α is as described
above [32,36,37]. From the above equations, the following statistics were derived as suggested in [18,19]:
(1) heritability of the index h2I = β0 Gx β/β0 Px β, where Gx is the genotypic variance-covariance matrix
among the measured phenotypes, (2) genetic correlation between the index and the selection target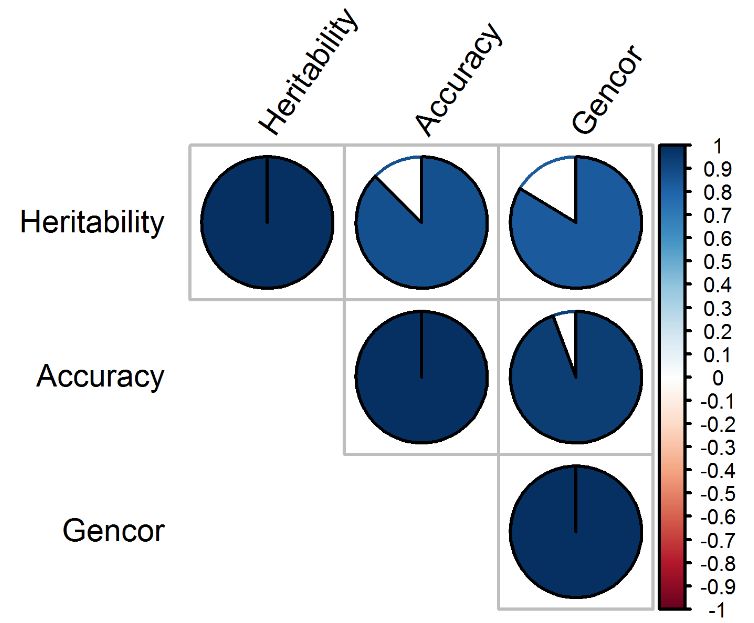
Genes 2020, 11, 61                                                                                       5 of 16

gencor = cor( gI , gH ) = β0 Gx,y α/ β0 G y α β0 Gx β, where G y is the genotypic variance-covariance
                                    p        p

matrix among the selection targets, and (3) accuracy of selection defined as the correlation between the
index and the genotypic value of the selection target i.e., acc = cor(I, gH ) = cor( gI , gH )hI . The accuracy
of selection was used to evaluate the performance of the genomic prediction model performance.

2.5. Genomic Selection Models
     In the genomic selection index modeling, phenotypic and marker data are scored in the training
population and fitted into appropriate algorithm to produce individuals’ whole-genome marker effects.
The marker effects are used in subsequent cycles of selection to compute the genomic estimated
breeding values (GEBVs) that are used as predictors of breeding values in a testing unphenotyped
population. The genomic estimated breeding values are obtained as a product of the estimated marker
effects in the training population and the coded marker values obtained in the testing population.
To apply genomic selection index, GEBVs are obtained in the selection candidates and then used to
predict and rank the net genetic merit of the candidates for selection.
     In this work, the genomic selection analyses were implemented in the multiple-trait model (MTM)
software [38] that uses a Bayesian approach [39]. The routines built in the MTM package allow
the calculation of the phenotypic and genotypic variance-covariance matrices. The performance of
the genomic selection models was assessed using Monte Carlo (repeated hold-out) cross-validation
approach [40,41] applying 70% and 30%, respectively, as training and validation (test) sets. In a
standard hold-out cross-validation, the test set represents new, unseen data to the model. To obtain a
more robust performance estimate that was less dependent on how the data was split into training
and validation sets, the holdout method was repeated 100 times using different random seeds. The
hundred repetitions were then used to calculate the average prediction performance. In comparison to
the standard holdout validation method, the repeated hold-out procedure implemented in this work
provides a better estimate of the model prediction ability when a random test set is used [41]. The
repeated hold-out procedure provides also the information about the stability of the model (produced
by a learning algorithm) across training set splits. The parameters of the models were estimated in
the training set before the models were validated in the testing set. The performance of the models
was measured using the accuracy of selection and the genetic correlation between the index and the
selection target as described previously [18,19].
     The selection index algorithms were implemented for different targets of prediction considering
                                                                      t
                                                                        α j g yij for multi-trait genomic
                                                                     P
Hi = g yij for each single trait in the target set, and then Hi =
                                                                         j=1
selection index, with α0 = [1, . . . , 1] representing the economic weights of the t traits for which we
expressed equal preference [32,35]. In the box below (Figure 1) is the example of a code snippet used
in this work to instruct the creation of a training and testing sets in R:
     The models were implemented using R software, version 3.5.3 (R Core Team, Vienna, Austria) [42]
and the package MTM [1,38] by applying default rules for selecting hyperparameters. The Gibbs
sampler was used and our analyses were based on 30,000 samples from the posterior distribution
obtained after the first 5000 iterations were discarded as burn-in [1]. The visualization algorithms
and statistical inferences used to present the genomic selection models’ output were implemented
using routines called from the R software. The magnitude and direction of the Pearson correlation
coefficients were interpreted according to Gomez and Gomez [43] as follows: 0–0.1, 0.1–0.5, 0.5–0.8,
and 0.8–1, 1, respectively, zero, low, medium, high, and perfect.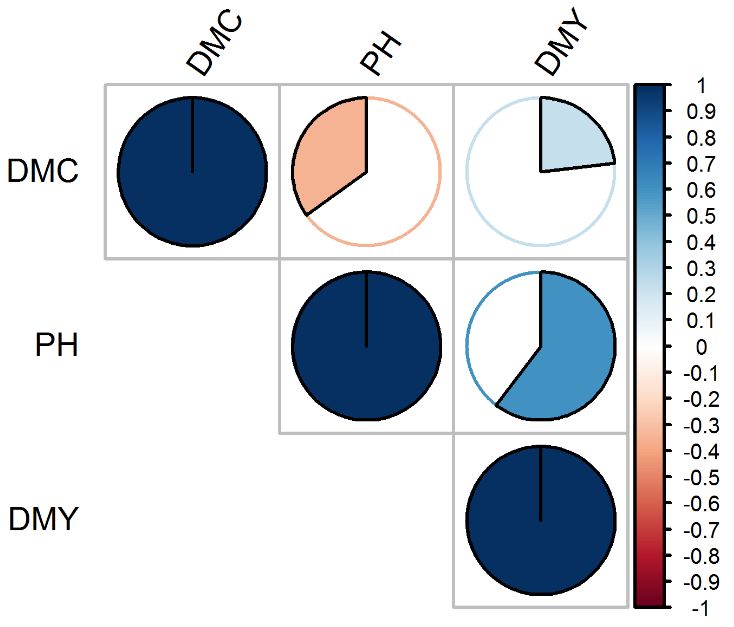
Genes 2020, 11, 61                                                                                             6 of 16
Genes 2019, 10, x FOR PEER REVIEW                                                                             6 of 16

      Figure 1. Example of a code snippet instructing the creation of training and testing sets. The list called
     Figure 1. Example of a code snippet instructing the creation of training and testing sets. The list called
     ‘SETS’ contains three different training-testing (TRN-TST) sets. The IT14, IT15, IT16, and IT17 are four S.
     ‘SETS’ contains three different training-testing (TRN-TST) sets. The IT14, IT15, IT16, and IT17 are four
      bicolor trials containing same genotypes evaluated in 2014, 2015, 2016, and 2017, respectively. The first
     S. bicolor trials containing same genotypes evaluated in 2014, 2015, 2016, and 2017, respectively. The
      set will train the model using as TRN set IT14 to predict IT15. In the second scenario, the model will be
     first set will train the model using as TRN set IT14 to predict IT15. In the second scenario, the model
      trained in IT14 + IT15 + IT16 to predict IT17, while in the third scenario, the model will be trained in
     will be trained in IT14 + IT15 + IT16 to predict IT17, while in the third scenario, the model will be
      US15DS + US16DS to predict US17DS.
     trained in US15DS + US16DS to predict US17DS.
3. Results
      The models were implemented using R software, version 3.5.3 (R Core Team, Vienna, Austria)
3.1. and
[42] Comparison
          the packageof Traits,
                            MTM Genetic
                                   [1,38]Metrics, and Genomic
                                          by applying   defaultSelection
                                                                 rules forApproaches
                                                                           selecting hyperparameters. The Gibbs
sampler   was     used    and  our  analyses  were   based   on 30,000
      The Pearson correlation was low and negative (r = −0.35) between  samples    from  the
                                                                                       the   posterior
                                                                                           dry          distribution
                                                                                               mass fraction   of the
obtained   after   the  first 5000 iterations were   discarded   as burn-in [1]. The  visualization algorithms
fresh material and the plant height, low and positive (r = 0.23) between dry mass fraction of the fresh          and
statistical  inferences     used to  present the   genomic   selection models’   output   were implemented
material and the aboveground dry biomass yield, and medium and positive (r = 0.60) between plant               using
routines
height and  called    from the R dry
               the aboveground        software.
                                          biomassThe    magnitude
                                                    yield (Figure 2).and  direction
                                                                      On the           of the
                                                                              other hand,   thePearson
                                                                                                Pearson correlation
                                                                                                         correlation
coefficients    were   interpreted    according   to Gomez    and  Gomez   [43]  as follows: 0–0.1,
was higher (r = 0.94) between accuracy and genetic correlation, followed by the correlation between 0.1–0.5, 0.5–0.8,
and  0.8–1,   1, respectively,   zero,  low, medium,     high, and  perfect.
accuracy and heritability (r = 0.87), and between heritability and genetic correlation (r = 0.84) (Figure 3).
The heritability of all single traits and the genomic selection index came from same distribution with
3. Results comparable means (h2 = 0.59–0.71) (Figure 4). Genetic correlation was higher (gencor =
statistically
0.6–0.63) and comparable in genomic selection index, aboveground dry biomass yield and plant height,
3.1. Comparison of Traits, Genetic Metrics, and Genomic Selection Approaches
while it was lower (gencor = 0.46) for the dry mass fraction of the fresh weight (Figure 5). The accuracy
showedThe the
           Pearson
               same correlation   wasgenetic
                      pattern as the   low and  negative (rThe
                                              correlation.   = −0.35) between
                                                                 accuracy  was the dry(acc
                                                                                higher  mass= 0.52–0.59)
                                                                                               fraction of and
                                                                                                            the
fresh  material
comparable    in and  the plant
                  genomic       height,
                           selection     lowaboveground
                                     index,  and positive (r = 0.23)
                                                           dry       between
                                                                biomass  yield dry
                                                                               and mass
                                                                                   plant fraction of theitfresh
                                                                                          height, while     was
material
lower (acc  = 0.36)
          and   the aboveground    dry fraction
                     for the dry mass   biomassofyield, and medium
                                                   the fresh           and positive
                                                             weight (Figure   6).   (r = 0.60) between plant
height and the aboveground dry biomass yield (Figure 2). On the other hand, the Pearson correlation
was higher (r = 0.94) between accuracy and genetic correlation, followed by the correlation between
accuracy and heritability (r = 0.87), and between heritability and genetic correlation (r = 0.84) (Figure
3). The heritability of all single traits and the genomic selection index came from same distribution
with statistically comparable means (h2 = 0.59–0.71) (Figure 4). Genetic correlation was higher (gencor
= 0.6–0.63) and comparable in genomic selection index, aboveground dry biomass yield and plant
height, while it was lower (gencor = 0.46) for the dry mass fraction of the fresh weight (Figure 5). The
accuracy showed the same pattern as the genetic correlation. The accuracy was higher (acc = 0.52–
0.59) and comparable in genomic selection index, aboveground dry biomass yield and plant height,
while it was lower (acc = 0.36) for the dry mass fraction of the fresh weight (Figure 6).
Genes 2019, 10, x FOR PEER REVIEW 7 of 16
Genes 2020, 11, 61 7 of 16
Genes 2019, 10, x FOR PEER REVIEW 7 of 16
Figure 2. Pearson correlation coefficients among the evaluated traits. DMC, DMY, and PH,
respectively, denote dry masscoefficients
content, dry biomass yield, andtraits.
plant height. The and
filled-in respectively,
areas of the
Figure2.2.Pearson
Figure Pearson correlation among
correlation coefficients the evaluated
among the evaluatedDMC, DMY,
traits. DMC, PH, DMY, and PH,
circles
denote show the
dry mass absolute
content, value of corresponding correlation coefficients. The scale on the right hand
respectively, denote dry dry biomass
mass content, yield,
dry and plantyield,
biomass height. The
and filled-in
plant areas
height. Theof filled-in
the circles show
areas of the
the
side is
absolute colored
value from
of red (negative
corresponding correlation)
correlation to blue (positive
coefficients. The correlation);
scale on the with
right the
hand intensity
side is of color
colored
circles show the absolute value of corresponding correlation coefficients. The scale on the right hand
scaled
from 0%–100%
red (negative incorrelation)
proportion toto the magnitude of the correlation.theRefer to text for the description of
side is colored from red (negativeblue (positiveto
correlation) correlation); withcorrelation);
blue (positive intensity of color
with scaled
the intensity0%–100%
of color
the
in traits.
proportion to the magnitude to of the
the magnitude
correlation.of Refer to text for the description ofthe
thedescription
traits.
scaled 0%–100% in proportion the correlation. Refer to text for of
the traits.
Figure 3. Pearson
Pearson correlation
correlation coefficients genetic metrics.
coefficients among the genetic metrics. Gencor
Gencor genetic correlation
between the phenotypic and the genomic selection indices. The The filled-in
filled-in areas of the circles show the
Figure 3. Pearson correlation coefficients among the genetic metrics. Gencor genetic correlation
absolute value of corresponding correlation coefficients. The The scale
scale on
on the right-hand
right-hand side is colored
between the phenotypic and the genomic selection indices. The filled-in areas of the circles show the
from red
red (negative
(negativecorrelation)
correlation)totoblue (positive
blue correlation);
(positive with
correlation); the the
with intensity of color
intensity scaled
of color 0%–100%
scaled 0%–
absolute value of corresponding correlation coefficients. The scale on the right-hand side is colored
in proportion
100% to the magnitude
in proportion of the correlation.
to the magnitude Refer toRefer
of the correlation. text for the description
to text of the genetic
for the description of themetrics.
genetic
from red (negative correlation) to blue (positive correlation); with the intensity of color scaled 0%–
metrics.
100% in proportion to the magnitude of the correlation. Refer to text for the description of the genetic
metrics.Genes 2020, 11, 61 8 of 16
Genes 2019, 10, x FOR PEER REVIEW 8 of 16
Figure
Figure 4.
4. Distribution
Distribution (boxplot)
(boxplot) ofof narrow-sense
narrow-sense heritability
heritability for
for single
single trait
trait and
and three-trait
three-trait selection
selection
indices
indices in
in the
the entire
entire panel.
panel. DMC,
DMC,DMY,DMY,GSI,GSI,and
andPH,
PH,respectively,
respectively, denote
denote selection
selection indices
indices relative
relative to
to
dry mass fraction
dry fraction ofoffresh
freshmaterial,
material,aboveground
aboveground dry biomass
dry biomassyield, three-traits
yield, (DMC,
three-traits (DMC,DMY, and and
DMY, PH),
and plant
PH), height.
and plant Means
height. are indicated
Means by open
are indicated dots dots
by open and are
andincluded within
are included the boxplot.
within Means
the boxplot. with
Means
samesame
letter letter
are notare
significantly different at the 5% 0
with not significantly different at level using
the 5% theusing
level Tukeythes HSD (honestly
Tukey′s HSD significant
(honestly
difference)difference)
significant test. Refer to text
test. for the
Refer description
to text of the GS models.
for the description of the GS models.Genes 2020, 11, 61 9 of 16
Genes 2019, 10, x FOR PEER REVIEW 9 of 16
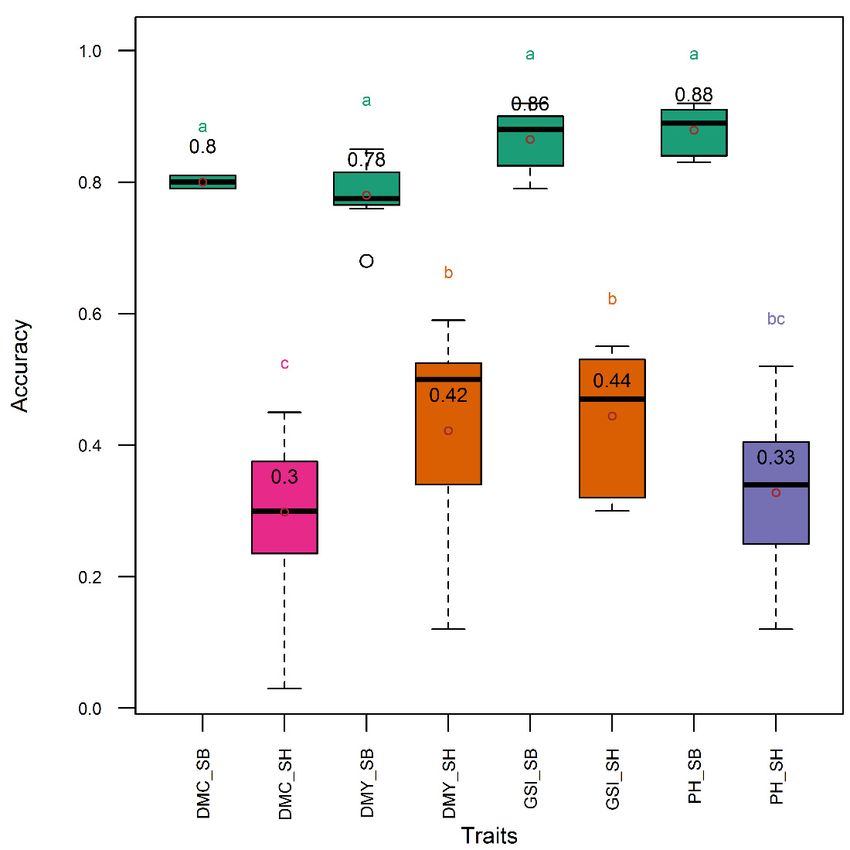
Figure
Figure 5.5. Distribution
Distribution (boxplot)
(boxplot) ofof genetic
genetic correlation
correlation between
between the
the phenotypic
phenotypic indices
indices and
and the
the net
net
genetic merit in the entire panel. DMC, DMY, GSI, and PH, respectively, denote selection
genetic merit in the entire panel. DMC, DMY, GSI, and PH, respectively, denote selection indices relative indices
relative to dry
to dry mass mass of
fraction fraction of fresh aboveground
fresh material, material, aboveground
dry biomass dryyield,
biomass yield, (DMC,
three-trait three-trait
DMY,(DMC,
PH),
DMY, PH),height.
and plant and plant
Meansheight. Means are
are indicated byindicated
open dotsbyand
openaredots and are
included included
within within the
the boxplot. boxplot.
Means with
Means withare
same letter samenotletter are not significantly
significantly different at different at the
the 5% level 5% level
using using the
the Tukey’s HSDTukey’s HSDsignificant
(honestly (honestly
significant difference) test. Refer to text for the description
difference) test. Refer to text for the description of the GS models.of the GS models.Genes 2020, 11, 61 10 of 16
Genes 2019, 10, x FOR PEER REVIEW 10 of 16
Figure
Figure 6.6. Distribution
Distribution (boxplot)
(boxplot)ofof genomic
genomic selection
selection index
index accuracy
accuracyusing
usingsingle
single traits
traits and
and allall three
three
traits
traits of
of interest
interest simultaneously
simultaneously in in the
the entire
entire panel.
panel. DMC,
DMC,DMY,DMY, GSI,
GSI, and
and PH,
PH, respectively,
respectively, denote
denote
selection indices
selection indices relative
relative to
to dry
dry mass
mass fraction
fraction of
of fresh
fresh material,
material, aboveground
aboveground dry dry biomass
biomass yield,
yield, all
all
the three
the three traits
traits simultaneously,
simultaneously, and plant height. Means Means are
are indicated
indicated by
by open
open dots
dots and
and are
are included
included
within the
within the boxplot.
boxplot. Means
Meanswithwithsame
sameletter
letterare
arenot
not significantly
significantlydifferent
different at
at the
the 5%
5% level
level using
using the the
Tukey 0 s HSD (honestly significant difference) test. Refer to text for the description of the GS models.
Tukey′s HSD (honestly significant
The heritability
The heritability and and thethe genetic
genetic correlation
correlation were
were higher
higher in Sorghum bicolor
in Sorghum bicolor than
than in S. bicolor
in S. bicolor ××S.
S.
halepense. Genetic
halepense. Geneticcorrelation Sorghumbicolor
correlationininSorghum bicolorvs.
vs.S. S. bicolor
bicolor × halepense
× S. S. halepense waswas
0.860.86
vs. vs.
0.40,0.40,
0.820.82
vs.
vs. 0.54, 0.92 vs. 0.43, and 0.91 vs. 0.57, respectively for the dry mass fraction
0.54, 0.92 vs. 0.43, and 0.91 vs. 0.57, respectively for the dry mass fraction of the fresh material, of the fresh material,
aboveground biomass
aboveground biomass yield,
yield, plant
plant height,
height, and
and the
the three-trait
three-trait genomic
genomic selection
selection index.
index. Heritability
Heritability inin
Sorghum bicolor
Sorghum bicolorvs.vs.S.S.bicolor
bicolor× ×
S. S. halepense
halepense waswas 0.86
0.86 vs.vs. 0.55,
0.55, 0.900.90 vs. 0.60,
vs. 0.60, 0.92 0.92 vs. and
vs. 0.57, 0.57,0.91
andvs.0.91 vs.
0.59,
0.59, respectively for the dry mass fraction of the fresh material, aboveground
respectively for the dry mass fraction of the fresh material, aboveground biomass yield, plant height, biomass yield, plant
height,
and theand the three-trait
three-trait genomic genomic selection
selection index.index. Accuracy
Accuracy in the
in the Sorghum
Sorghum bicolorsubpopulation
bicolor subpopulation was was
higher than in the S. bicolor × S. halepense subpopulation for all traits and the genomic
higher than in the S. bicolor × S. halepense subpopulation for all traits and the genomic selection index selection index
(Figure 7).
(Figure 7). In
InS.S.bicolor,
bicolor,accuracy
accuracy was was comparable
comparable (acc(acc ==0.78–0.88)
0.78–0.88)among
amongsingle
singletraits
traitsand
andthe
thegenomic
genomic
selection index,
selection index, while
while in in in S. bicolor
in S. bicolor ×× S.
S. halepense,
halepense, the
the pattern
pattern followed
followed that that of
of the
the entire
entire diversity
diversity
panel with higher and comparable accuracy (acc = 0.33–0.44) in genomic selection
panel with higher and comparable accuracy (acc = 0.33–0.44) in genomic selection index, aboveground index, aboveground
dry biomass
dry biomass yieldyield and
and plant
plant height,
height, while
while the
the accuracy
accuracy waswas lower (acc == 0.30)
lower (acc 0.30) for
forthe
thedry
drymass
massfraction
fraction
of the
of the fresh
fresh weight
weight (Figure
(Figure 7). 7).Genes 2020, 11, 61 11 of 16
Genes 2019, 10, x FOR PEER REVIEW 11 of 16
Figure 7.7. Distribution
Distribution (boxplot)
(boxplot) of of genomic
genomic selection
selection accuracy
accuracy using
using single
single traits
traits and all traits
simultaneously in Sorghum bicolor and S. S. bicolor
bicolor ×× S. halepense
halepense lines.
lines. DMC,
DMC, DMY,
DMY, GSI,GSI, and
and PH,
respectively, denote selection indices relative to dry mass fraction of fresh mass
respectively, denote selection indices relative to dry mass fraction of fresh mass material, material, aboveground
dry biomass yield,
aboveground all the three
dry biomass traits
yield, simultaneously,
all the and plant height.
three traits simultaneously, andTraits
plantsuffixed
height.with “_SB”
Traits and
suffixed
“_SH”, respectively,
with “_SB” and “_SH”,were collected from
respectively, wereSorghum
collected bicolor
fromand S. bicolor
Sorghum × S.and
bicolor halepense lines.
S. bicolor × S.Means are
halepense
indicated by open
lines. Means dots and by
are indicated areopen
included
dotswithin
and are theincluded
boxplot.within
Meansthewith same letter
boxplot. Meansare with
not significantly
same letter
different at the 5% level
are not significantly usingat
different the Tukey’s
the 5% levelHSD (honestly
using significant
the Tukey’s HSD difference) test. Referdifference)
(honestly significant to text for
the
test.description offor
Refer to text thethe
GSdescription
models. of the GS models.
3.2. Predicting Regrowth Performance in Perennial Sorghum Bicolor × Sorghum Halepense
3.2. Predicting Regrowth Performance in Perennial Sorghum Bicolor × Sorghum Halepense
The information from the Sorghum bicolor × Sorghum halepense trial sown in 2016 was used to
The information from the Sorghum bicolor × Sorghum halepense trial sown in 2016 was used to
predict the performance of the overwintered (regrowth) populations in 2017 and 2018 (Figure 8). For
predict the performance of the overwintered (regrowth) populations in 2017 and 2018 (Figure 8). For
plant height, genetic correlation and accuracy were 0.58 and 0.47, respectively, in 2017 and decreased
plant height, genetic correlation and accuracy were 0.58 and 0.47, respectively, in 2017 and decreased
by 48% and 47%, respectively, in 2018. For the dry mass fraction of the fresh mass material, genetic
by 48% and 47%, respectively, in 2018. For the dry mass fraction of the fresh mass material, genetic
correlation and accuracy were 0.43 and 0.35, respectively, in 2017 and decreased by 37% and 40%,
correlation and accuracy were 0.43 and 0.35, respectively, in 2017 and decreased by 37% and 40%,
respectively, in 2018. For the aboveground dry biomass yield, the genetic correlation and accuracy
respectively, in 2018. For the aboveground dry biomass yield, the genetic correlation and accuracy
remained stable from 2017 to 2018 with respective ranges of 0.53–0.55 and 0.45–0.46. The heritability
remained stable from 2017 to 2018 with respective ranges of 0.53–0.55 and 0.45–0.46. The heritability
of the above three traits remained stable from 2017 to 2018 decreasing or increasing by one to five
of the above three traits remained stable from 2017 to 2018 decreasing or increasing by one to five
hundredths. The genetic correlation and accuracy obtained with the genomic selection index were
hundredths. The genetic correlation and accuracy obtained with the genomic selection index were
higher than the best values obtained with a single trait. On the other hand, the heritability obtained
higher than the best values obtained with a single trait. On the other hand, the heritability obtained
with the genomic selection index was comparable to that obtained with the aboveground dry biomass
with the genomic selection index was comparable to that obtained with the aboveground dry biomass
and higher than the heritability realized in other traits.
and higher than the heritability realized in other traits.Genes 2020, 11, 61 12 of 16
Genes 2019, 10, x FOR PEER REVIEW 12 of 16
Figure 8. Accuracy
Figure 8. Accuracy ofof
genomic
genomicprediction
predictionofofthe
theperformance bicolor××S.S.halepense
performance of S. bicolor halepenseregrown
regrown from
from
rhizomes
rhizomes(testing set)set)
(testing using trials
using grown
trials from
grown seeds
from as training
seeds set. set.
as training US16DS
US16DSS. bicolor × S. ×halepense
S. bicolor sown
S. halepense
andsown and evaluated
evaluated in 2016; US16RG17
in 2016; US16RG17 S. bicolor ×S.S.bicolor
halepense× S.sown
halepense sown
in 2016 andinregrown
2016 andand regrown and in
evaluated
evaluated
2017; US16RG18 in 2017; US16RG18
S. bicolor S. bicolorsown
× S. halepense × S. halepense
in 2016sown in 2016 and
and regrown andregrown
evaluatedandinevaluated
2018. DMC, in 2018.
DMY,
DMC,
ALL, andDMY, ALL, and PH,
PH, respectively, respectively,
denote denote
selection indicesselection
relativeindices
to dryrelative to dry mass
mass fraction of thefraction of the
fresh material,
fresh material,
aboveground dryaboveground
biomass yield, dry
allbiomass
the threeyield,
traitsallsimultaneously,
the three traits simultaneously,
and plant height. and plant height.
Numbers on the
topNumbers
of the barson are
the mean
top of accuracies.
the bars are mean
Refer accuracies.
to text for the Refer to text for the
description description
of the GS models. of the GS models.
4. Discussion
4. Discussion
A diversity
A diversity panelmade
panel madeup upofofaamixture
mixture ofof Sorghum
Sorghum bicolor
bicolor lines
lines and
andlandraces
landracesandandSorghum
Sorghum
bicolor
bicolor × Sorghum
× Sorghum halepenseadvanced
halepense advancedrecombinant
recombinant inbred
inbred lines
lines was
wasused
usedininthis
thiswork
workininorder
ordertoto
setset
up up
thethe groundwork
groundwork upon
upon whichtotobuild
which buildfuture
futuregermplasm
germplasm improvement
improvementand andcultivar
cultivardevelopment
development
programs.
programs. A similar
A similar panelpanel waspreviously
was used used previously in a genome-wide
in a genome-wide linkage disequilibrium
linkage disequilibrium investigation
investigation in sorghum, and in genomic prediction and selection for antioxidant
in sorghum, and in genomic prediction and selection for antioxidant production in sorghum production in
[10,44].
sorghum
In these [10,44].
previous In these
studies, previous
mixing studies,
Sorghum mixing
bicolor andSorghum
Sorghumbicolor
bicolorand Sorghumhalepense
× Sorghum bicolor × genotypes
Sorghum
halepense genotypes was motivated mainly by the observed weak structure of the resulting
was motivated mainly by the observed weak structure of the resulting diversity panel. In addition, in diversity
panel. In addition, in these investigations and in the present work, Sorghum bicolor relevant
these investigations and in the present work, Sorghum bicolor relevant information was used as the
information was used as the molecular marker information used was derived by aligning the
molecular marker information used was derived by aligning the sequencing reads to the sorghum
sequencing reads to the sorghum reference genome (Sorghum_bicolor NCBIv3) to enable variants
reference genome (Sorghum_bicolor NCBIv3) to enable variants discovery. It was also shown that the
discovery. It was also shown that the use of Sorghum bicolor × Sorghum halepense recombinant inbred
use of Sorghum bicolor × Sorghum halepense recombinant inbred lines in the diversity panel brought
lines in the diversity panel brought novel useful polymorphism [44].
novel useful polymorphism [44].Genes 2020, 11, 61 13 of 16
The correlation observed among the evaluated traits was not in full agreement with Habyarimana
et al. [1] except for the relationship between plant height and the aboveground dry biomass yield. The
differences between the two works can be attributed to different types of populations evaluated. In
this work a panel of Sorghum bicolor and S. bicolor × S. halepense was evaluated, while the correlation
reported in Habyarimana et al. [1] referred only to S. bicolor × S. halepense. The high pairwise correlation
between plant height and the aboveground dry biomass yield implied that the proportion of variance
shared by these traits was mostly explained by genetic causes. A perfect correlation between plant
characteristics implies that genetic effects on the traits of interest are identical, which can indicate the
existence of either linkage disequilibrium, pleiotropy or causal overlap, or ascertainment bias deriving
from biased sampling [10].
The lower correlation coefficients observed in this work between the dry mass fraction of the
fresh material and the plant height, on the one hand, and the aboveground dry biomass yield on the
other hand implies that dry mass fraction of the fresh material can be improved independently of
plant height and aboveground dry biomass yield. This can have important implications in terms of
sustainability because high-yielding genotypes can be bred that contain less moisture in biomass at
harvest, which means less energy would be spent on biomass conversion and transportation from the
field to the bioreactor.
When faced with the necessity to simultaneously improve more than one trait, a breeder can use
three approaches: tandem selection, independent culling levels, and index selection [45]. In tandem
selection, only one character is selected in each cycle; in independent culling levels, all genotypes with a
phenotypic value below the culling threshold for at least one characteristic are discarded; the selection
index aims at improving several traits simultaneously in such a way as to make the biggest possible
improvement in overall genetic merit [35]. In this work, we implemented the Optimum selection
Index of Smith [32] the performance of which was demonstrated in previous studies [35,37]. In our
optimum index selection, both desirable and undesirable (e.g., plant height vs. dry mass fraction of the
fresh material) correlations were observed between traits (Figure 2) but, as Bradshaw [35] put it, these
were accommodated by the index accounting for the simultaneous improvement of the traits on the
index. In the process of computing the optimum index selection, equal weights in terms of phenotypic
standard deviations (1/σP ) were used as suggested by Bradshaw [35] and supported by Saeidnia et
al. [46]. The later authors used optimum index and compared several economic weights including
unit, phenotypic correlation, genotypic correlation, heritability, direct effects in path analysis and first
factor loading in factor analysis. They found out that using unit coefficient in the optimum selection
index allowed the highest genetic advance for all traits making up the index. In the same work the
selection index with equal weights showed high correlation with the net genetic merit.
The accuracy was more associated with genetic correlation than heritability because heritability
was generally high and did not show high variability across trials. This relationship among heritability,
genetic correlation and accuracy of selection was consistently observed both in Pearson correlation
analysis (Figure 3) and in post hoc analytics through mean separation (Figures 2–4). From the high
heritability values of the index selection it can be inferred that the indices described in this work can be
effectively used in breeding programs without significant environmental noise. The genetic correlation
and accuracy were statistically comparable between the three-trait index selection, aboveground dry
biomass yield and plant height, but these metrics were significantly lower for the dry mass fraction
of the fresh material (Figures 3 and 4). It can therefore be inferred that the use of the three traits in
the index selection can simultaneously improve the accuracy for selecting aboveground dry biomass
yield, plant height, and particularly, the dry mass fraction of fresh material. Indeed, this is the inherent
characteristics of a linear selection index as it is expected to allow extra merit in one trait to offset
defects that existed in another. As Hazel and Lush [19,21] showed, by the use of a linear selection
index, individuals with very high merit in one trait are saved for breeding, even when they are inferior
in other traits.Genes 2020, 11, 61 14 of 16
The higher accuracy of selection observed in Sorghum bicolor relative to S. bicolor × S. halepense can
be explained by the lower genetic variability in the S. bicolor × S. halepense materials as confirmed by
their observed lower heritability of the index and lower genetic correlation between the index and the
net genetic merit. The low genetic variability in S. bicolor × S. halepense lines might have resulted from
the low number of parents used during early hybridizations [47] that led to a relatively narrow genetic
base in the current progeny. On the other hand, higher genetic variability in S. bicolor was expected as
these genotypes were derived from African and Asian landraces, and are expected to harbor a high
level of genetic diversity for breeding purposes inasmuch as Africa and Asia represent, respectively,
the primary and secondary sorghum centers of diversity [2].
The results from the regrowth trials were encouraging. Heritability was consistently higher
across years for all selection indices, implying that effective selection can be carried out even several
overwintering generations after the original seed sown trials. Among single trait genomic selection
indices, the aboveground dry biomass yield showed better accuracy relative to other traits, and
maintained the good accuracy across years. The accuracy for the dry mass fraction of the fresh material
and the accuracy for plant height decreased over years. For these traits, the accuracy in regrowth
trials can probably be improved by either re-training the models including the information from the
immediately precedent generation or integrating the single traits of interest in a multi-trait index
selection. The observed higher accuracy for the three-trait genomic selection holds therefore good
promise for improving aboveground dry biomass yields and its auxiliary traits like plant height and
the dry mass fraction of the fresh material in S. bicolor × S. halepense.
5. Conclusions
In this work, extensive experimental breeding data were used to demonstrate for the first time
that the optimum index selection can be implemented in genomic selection predictive analytics for
index selection including aboveground dry biomass yield, plant height, and dry mass fraction of the
fresh material in biomass sorghum crop. Furthermore, this work shed light for the first time on the
promising potential of using the information from the trial grown from seed to predict the performance
of the populations regrown from the rhizomes even two winter seasons after the original trial was sown.
For these particular populations established from regrowths, using multi-trait index selection was the
recommended option to improve traits such as plant height and the dry mass fraction of the fresh
material that were weakly predicted when the selection target was regrown from the rhizomes. Since
the plant characteristics evaluated herein are routinely measured in cereal and other plant species of
agricultural interest, it can be inferred that our findings can be harnessed in other major crops as well.
Author Contributions: Conceptualization, E.H.; methodology, E.H. and M.L.-C.; software, E.H. and M.L.-C.;
formal analysis, E.H.; investigation, E.H., M.L.-C., and F.S.B.; data curation, E.H.; writing—original draft
preparation, E.H.; writing—review and editing, E.H., M.L.-C., and F.S.B.; visualization, E.H.; supervision, E.H.;
project administration, E.H.; funding acquisition, E.H. All authors have read and agreed to the published version
of the manuscript.
Funding: This research was funded by the European Union, grant number 732064 (H2020-ICT-2016-1-innovation
action) and the APC was funded by the European Union through the project Data-driven Bioeconomy (www.
databio.eu) and the Ministero delle Politiche Agricole, Alimentari, Forestali e del Turismo (Rome, Italy) through
the project Risorse GeneticheVegetali (RGV/FAO) 2014–2016.
Conflicts of Interest: The authors declare no conflict of interest. The funders had no role in the design of the
study; in the collection, analyses, or interpretation of data; in the writing of the manuscript, or in the decision to
publish the results.
References
1. Habyarimana, E.; Lorenzoni, C.; Marudelli, M.; Redaelli, R.; Amaducci, S. A meta-analysis of bioenergy
conversion relevant traits in sorghum landraces, lines and hybrids in the Mediterranean region. Ind. Crops
Prod. 2016, 81, 100–109. [CrossRef]Genes 2020, 11, 61 15 of 16
2. Habyarimana, E.; Lorenzoni, C.; Redaelli, R.; Alfieri, M.; Amaducci, S.; Cox, S. Towards a perennial biomass
sorghum crop: A comparative investigation of biomass yields and overwintering of Sorghum bicolor × S.
halepense lines relative to long term S. bicolor trials in northern Italy. Biomass Bioenergy 2018, 111, 187–195.
[CrossRef]
3. Fernandes, S.B.; Dias, K.O.G.; Ferreira, D.F.; Brown, P.J. Efficiency of multi-trait, indirect, and trait-assisted
genomic selection for improvement of biomass sorghum. Theor. Appl. Genet. 2018, 131, 747–755. [CrossRef]
[PubMed]
4. Bernardo, R. Breeding for Quantitative Traits in Plants; Stemma Pr: Woodbury, MN, USA, 2002; ISBN
978-0-9720724-0-3.
5. Lynch, M.; Walsh, B. Genetics and Analysis of Quantitative Traits, 1st ed.; Sinauer Associates is an Imprint of
Oxford University Press: Sunderland, MA, USA, 1998; ISBN 978-0-87893-481-2.
6. Habyarimana, E. Genomic prediction for yield improvement and safeguarding genetic diversity in CIMMYT
spring wheat (Triticum aestivum L.). Aust. J. Crop Sci. 2016, 10, 127–136.
7. Habyarimana, E.; Parisi, B.; Mandolino, G. Genomic prediction for yields, processing and nutritional quality
traits in cultivated potato (Solanum tuberosum L.). Plant Breed. 2017, 136, 245–252. [CrossRef]
8. Meuwissen, T.; Hayes, B.; Goddard, M. Genomic selection: A paradigm shift in animal breeding. Anim.
Front. 2016, 6, 6–14. [CrossRef]
9. Crossa, J.; Pérez-Rodríguez, P.; Cuevas, J.; Montesinos-López, O.; Jarquín, D.; de Los Campos, G.; Burgueño, J.;
González-Camacho, J.M.; Pérez-Elizalde, S.; Beyene, Y.; et al. Genomic Selection in Plant Breeding: Methods,
Models, and Perspectives. Trends Plant Sci. 2017, 22, 961–975. [CrossRef]
10. Habyarimana, E.; Lopez-Cruz, M. Genomic Selection for Antioxidant Production in a Panel of Sorghum
bicolor and S. bicolor × S. halepense Lines. Genes 2019, 10, 841. [CrossRef]
11. Meuwissen, T.H.; Hayes, B.J.; Goddard, M.E. Prediction of total genetic value using genome-wide dense
marker maps. Genetics 2001, 157, 1819–1829.
12. Velazco, J.G.; Jordan, D.R.; Mace, E.S.; Hunt, C.H.; Malosetti, M.; van Eeuwijk, F.A. Genomic Prediction of
Grain Yield and Drought-Adaptation Capacity in Sorghum Is Enhanced by Multi-Trait Analysis. Front. Plant
Sci. 2019, 10, 997. [CrossRef]
13. De los Campos, G.; Gianola, D.; Rosa, G.J.M.; Weigel, K.A.; Crossa, J. Semi-parametric genomic-enabled
prediction of genetic values using reproducing kernel Hilbert spaces methods. Genet. Res. 2010, 92, 295–308.
[CrossRef]
14. Pérez, P.; de los Campos, G. Genome-wide regression and prediction with the BGLR statistical package.
Genetics 2014, 198, 483–495. [CrossRef]
15. Gianola, D. Priors in Whole-Genome Regression: The Bayesian Alphabet Returns. Genetics 2013, 194, 573–596.
[CrossRef] [PubMed]
16. Kulwal, P.L. Association Mapping and Genomic Selection—Where Does Sorghum Stand. In The Sorghum
Genome; Rakshit, S., Wang, Y.-H., Eds.; Compendium of Plant Genomes; Springer International Publishing:
Cham, Switzerland, 2016; pp. 137–148. ISBN 978-3-319-47789-3.
17. Hunt, C.H.; van Eeuwijk, F.A.; Mace, E.S.; Hayes, B.J.; Jordan, D.R. Development of Genomic Prediction in
Sorghum. Crop Sci. 2018, 58, 690–700. [CrossRef]
18. Ceron-Rojas, J.J.; Crossa, J.; Arief, V.N.; Basford, K.; Rutkoski, J.; Jarquín, D.; Alvarado, G.; Beyene, Y.;
Semagn, K.; DeLacy, I. A Genomic Selection Index Applied to Simulated and Real Data. G3 2015, 5, 2155–2164.
[CrossRef] [PubMed]
19. Céron-Rojas, J.J.; Hiriart, J.C. Linear Selection Indices in Modern Plant Breeding; Springer International Publishing:
Cham, Switzerland, 2018; ISBN 978-3-319-91222-6.
20. Safari, P.; Honarnejad, R.; Esfahani, M. Indirect selection for increased oil yield in peanut: Comparison
selection indices and biplot analysis for simultaneous improvement multiple traits. Int. J. Biosci. 2013, 3,
87–96.
21. Hazel, L.N.; Lush, J.L. The efficiency of three methods of selection. J. Hered. 1942, 33, 393–399. [CrossRef]
22. Henderson, C.R.; Quaas, R.L. Multiple Trait Evaluation Using Relatives’ Records. J. Anim. Sci. 1976, 43,
1188–1197. [CrossRef]
23. Thompson, R.; Meyer, K. A review of theoretical aspects in the estimation of breeding values for multi-trait
selection. Livest. Prod. Sci. 1986, 15, 299–313. [CrossRef]
24. Mrode, R.A. Linear Models for the Prediction of Animal Breeding Values, 3rd ed.; CABI: Boston, MA, USA, 2014.Genes 2020, 11, 61 16 of 16
25. Calus, M.P.; Veerkamp, R.F. Accuracy of multi-trait genomic selection using different methods. Genet. Sel.
Evol. 2011, 43, 26. [CrossRef]
26. Jia, Y.; Jannink, J.-L. Multiple-trait genomic selection methods increase genetic value prediction accuracy.
Genetics 2012, 192, 1513–1522. [CrossRef]
27. Wang, X.; Li, L.; Yang, Z.; Zheng, X.; Yu, S.; Xu, C.; Hu, Z. Predicting rice hybrid performance using univariate
and multivariate GBLUP models based on North Carolina mating design II. Heredity 2017, 118, 302–310.
[CrossRef] [PubMed]
28. Schulthess, A.W.; Zhao, Y.; Longin, C.F.H.; Reif, J.C. Advantages and limitations of multiple-trait genomic
prediction for Fusarium head blight severity in hybrid wheat (Triticum aestivum L.). Theor. Appl. Genet. 2018,
131, 685–701. [CrossRef] [PubMed]
29. dos Santos, J.P.R.; de Castro Vasconcellos, R.C.; Pires, L.P.M.; Balestre, M.; Von Pinho, R.G. Inclusion of
Dominance Effects in the Multivariate GBLUP Model. PLoS ONE 2016, 11, e0152045. [CrossRef] [PubMed]
30. Federer, W.T.; Cornell University, Biometrics Unit; Cornell University, Dept. of Biometrics; Cornell University,
Dept. of Biological Statistics and Computational Biology. Augmented (or Hoonuiaku) Designs. Biom. Unit
Tech. Rep. 1956, 33, 1.
31. Descriptors for Sorghum [Sorghum bicolor (L.) Moench]. Available online: https://www.bioversityinternational.
org/e-library/publications/detail/descriptors-for-sorghum-sorghum-bicolor-l-moench/ (accessed on 24
November 2019).
32. Smith, H.F. A Discriminant Function for Plant Selection. Ann. Eugen. 1936, 7, 240–250. [CrossRef]
33. Tomar, S.S. Restricted selection index in animal system—A review. Agric. Rev. 1983, 4, 109–118.
34. Cartuche Macas, L. Economic weights in rabbit meat production. World Rabbit Sci. 2014, 22, 165–177.
[CrossRef]
35. Bradshaw, J.E. Plant breeding: Past, present and future. Euphytica 2017, 213, 60. [CrossRef]
36. Kang, M.S. Applied Quantitative Genetics; Kang, M.S., Ed.; MS Kang: Baton Rouge, LA, USA, 1994; ISBN
978-0-9642970-4-3.
37. Baker, R.J. Selection Indices in Plant Breeding; CRC Press: Boca Raton, FL, USA, 1986; ISBN 978-0-8493-6377-1.
38. de Los Campos, G.; Grüneberg, A. QuantGen/MTM: MTM Version 1.0.0 from GitHub. Available online:
https://rdrr.io/github/QuantGen/MTM/ (accessed on 24 November 2019).
39. Montesinos-López, O.A.; Montesinos-López, A.; Luna-Vázquez, F.J.; Toledo, F.H.; Pérez-Rodríguez, P.;
Lillemo, M.; Crossa, J. An R Package for Bayesian Analysis of Multi-environment and Multi-trait
Multi-environment Data for Genome-Based Prediction. G3 2019, 9, 1355–1369. [CrossRef]
40. Scutari, M.; Mackay, I.; Balding, D. Using Genetic Distance to Infer the Accuracy of Genomic Prediction.
PLoS Genet. 2016, 12, e1006288. [CrossRef] [PubMed]
41. Raschka, S. Model Evaluation, Model Selection, and Algorithm Selection in Machine Learning. arXiv 2018,
arXiv:1811.12808.
42. R Core Team. R: A Language and Environment for Statistical Computing. Available online: https:
//www.r-project.org/ (accessed on 27 September 2019).
43. Gomez, K.A.; Gomez, A.A. Statistical Procedures for Agricultural Research, 2nd ed.; Wiley-Interscience: New
York, NY, USA, 1984; ISBN 978-0-471-87092-0.
44. Habyarimana, E.; Dall’Agata, M.; De Franceschi, P.; Baloch, F.S. Genome-wide association mapping of total
antioxidant capacity, phenols, tannins, and flavonoids in a panel of Sorghum bicolor and S. bicolor × S.
halepense populations using multi-locus models. PLoS ONE 2019, 14, e0225979. [CrossRef] [PubMed]
45. Wricke, G.; Weber, E. Quantitative Genetics and Selection in Plant Breeding, Reprint 2010 ed.; De Gruyter: Berlin,
Germany, 1986; ISBN 978-3-11-007561-8.
46. Saeidnia, M.; Emami, H.; Honarnejad, R.; Esfahani, M. Comparing Economical Coefficients to Select the Best
Optimum Selection Index in Peanut. Am. Eurasian J. Agric. Environ. Sci. 2012, 12, 393–398.
47. Piper, J.; Kulakow, P. Seed yield and biomass allocation in Sorghum bicolor and F1 and backcross generations
of S. bicolor × S. halepense hybrids. Can. J. Bot. 2011, 72, 468–474. [CrossRef]
© 2020 by the authors. Licensee MDPI, Basel, Switzerland. This article is an open access
article distributed under the terms and conditions of the Creative Commons Attribution
(CC BY) license (http://creativecommons.org/licenses/by/4.0/).You can also read