Breath biopsy of breast cancer using sensor array signals and machine learning analysis - Nature
←
→
Page content transcription
If your browser does not render page correctly, please read the page content below
www.nature.com/scientificreports
OPEN Breath biopsy of breast cancer
using sensor array signals
and machine learning analysis
Hsiao‑Yu Yang1,2, Yi‑Chia Wang3,4, Hsin‑Yi Peng1 & Chi‑Hsiang Huang3,4*
Breast cancer causes metabolic alteration, and volatile metabolites in the breath of patients may be
used to diagnose breast cancer. The objective of this study was to develop a new breath test for breast
cancer by analyzing volatile metabolites in the exhaled breath. We collected alveolar air from breast
cancer patients and non-cancer controls and analyzed the volatile metabolites with an electronic nose
composed of 32 carbon nanotubes sensors. We used machine learning techniques to build prediction
models for breast cancer and its molecular phenotyping. Between July 2016 and June 2018, we
enrolled a total of 899 subjects. Using the random forest model, the prediction accuracy of breast
cancer in the test set was 91% (95% CI: 0.85–0.95), sensitivity was 86%, specificity was 97%, positive
predictive value was 97%, negative predictive value was 97%, the area under the receiver operating
curve was 0.99 (95% CI: 0.99–1.00), and the kappa value was 0.83. The leave-one-out cross-validated
discrimination accuracy and reliability of molecular phenotyping of breast cancer were 88.5 ± 12.1%
and 0.77 ± 0.23, respectively. Breath tests with electronic noses can be applied intraoperatively to
discriminate breast cancer and molecular subtype and support the medical staff to choose the best
therapeutic decision.
Breast cancer is the most commonly diagnosed cancer and the leading cause of cancer death among f emales1.
Early detection can improve treatment and decrease m ortality2. The molecular subtype is an independent prog-
nostic factor of breast c ancer3,4. Detecting the expression of estrogen receptor (ER) and progesterone receptor
(PR), and overexpression of human epidermal growth factor receptor 2 (HER2) has been used to guide the
therapy decisions5,6. Based on the expression of receptors, breast cancer can be further classified into distinct
molecular subtypes, which include luminal A, luminal B, HER2, and triple-negative7. Metabolic alterations are
observed in different molecular subtypes and histological types of breast c ancer8. Fan et al. analyzed the metabo-
lites in plasma of breast cancer and identified eight metabolites for the classification of breast cancer s ubtypes9.
An in vitro study showed that breast cancer cells of different statuses could generate specific volatile metabolites10.
Breathomics is an emerging science to diagnose diseases by analyzing volatile metabolites produced by
changes in metabolic processes caused by d isease11. The volatile metabolites produced during the physiologi-
cal and pathological processes of the lung diseases are released into the alveolar a ir12. The volatile metabolites
produced by tumors have the potential to serve as noninvasive biomarkers11. The gas chromatography-mass
spectrometry (GC–MS) and electronic nose (E-nose) are two methods to analyze these volatile metabolites. The
electronic nose uses a fingerprinting approach to explore the exhaled breath by sensor arrays. When the volatile
metabolites from a breath sample are presented to the E-nose sensor array, the chemicals interact with the sensors
and change their electric resistance. The data are processed by machine learning techniques to predict the prob-
ability of the diagnosis of a d isease13. Due to non-invasiveness and rapid diagnosis, there is increasing interest
in the analysis of volatile metabolites in exhaled breath to diagnose d iseases14. The objective of this study was
to develop a breath test to detect breast cancer and its molecular subtype. We analyzed the patient’s alveolar air
through an electronic nose and applied machine learning statistics to build a predictive model for the diagnosis
of breast cancer (Fig. 1).
1
Institute of Environmental and Occupational Health Sciences, National Taiwan University College of Public
Health, Taipei, Taiwan. 2Department of Environmental and Occupational Medicine, National Taiwan University
Hospital, Taipei, Taiwan. 3Department of Anesthesiology, National Taiwan University College of Medicine, Taipei,
Taiwan. 4Department of Anesthesiology, National Taiwan University Hospital, Taipei, Taiwan. *email: tee.ntuh@
gmail.com
Scientific Reports | (2021) 11:103 | https://doi.org/10.1038/s41598-020-80570-0 1
Vol.:(0123456789)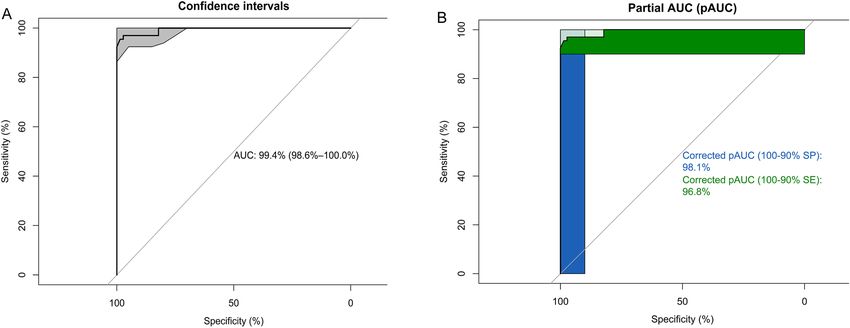
www.nature.com/scientificreports/
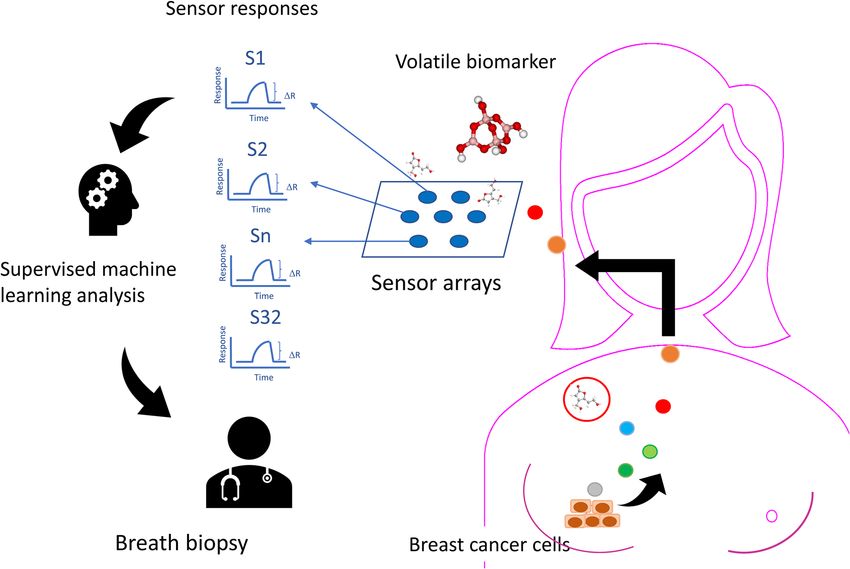
Figure 1. Graphical abstract showing the principle of breath biopsy. Legends: Volatile metabolites produced
by breast cancer cells circulate to the lungs and are released into the breath. Using the sensor array to detect
the pattern of exhaled volatile biomarkers, we can detect the molecular type of breast cancer early by collecting
alveolar air during surgery.
Results
Between July 2016 and June 2018, a total of 899 subjects were screened and assessed. Based on the defined
inclusion and exclusion criteria, we eliminated six study subjects who did not have sensor data for technical
reasons, 122 male subjects, 222 benign breast tumors, 40 subjects who had received chemotherapy, 57 current
smokers, 19 former smokers, 23 second-hand smokers, 63 subjects with diabetes mellitus, and ten subjects with
asthma, a total of 439 study subjects were used in the final analyses that included 351 cases of malignant breast
tumor and 88 controls. The mean age of study subjects was 55.03 (SD 12.08) years. There were no statistically
significant differences in age, renal and liver functions, and inflammatory status between the case group and the
control group (Table 1). Using a random forest model, the prediction accuracy of breast cancer in the test set
was 91%, sensitivity was 86%, specificity was 97%, positive predictive value (PPV) was 97%, negative predictive
value (NPV) was 97%, and the area under the receiver operator characteristic curve (AUC) was 0.99 (95% CI:
0.97–1.00). The reliability of prediction as measured by the kappa value was 0.83 (Table 2). The 95% confidence
interval of receiver operating characteristic (ROC) using bootstrap resampling for 2000 replicates was shown
in Fig. 2. The partial area under the receiver operating curve (pAUC) between 90 and 100% for specificity was
98.1%, and the pAUC between 90 and 100% for sensitivity was 96.8%. In the identification of molecular subtypes
of breast cancer, the random forest model had the highest accuracy. The mean value of leave-one-out cross-
validation accuracy was 88.5 ± 12.1%, and the kappa reliability was 0.77 ± 0.23 (Table 3).
To evaluate the influence of comorbidities and confounding factors on diagnostic accuracy, we have used all
the population and conducted additional analyses to compare the effects of comorbidities and confounding fac-
tors on diagnostic accuracy. The results showed that the inclusion of study subjects with a history of asthma did
not significantly affect diagnostic accuracy. The inclusion of subjects with a history of smoking, chemotherapy,
or diabetes had a moderate impact on accuracy. The inclusion of male gender and benign breast tumor signifi-
cantly influenced the accuracy (Fig. 3). When we included study subjects with a history of asthma (n = 10), the
diagnostic odds ratio (DOR) was 10.62. When we included study subjects with a history of smoking (n = 99), the
DOR was 9.12. When we included study subjects with a history of chemotherapy (n = 40), the DOR was 8.62.
When we included study subjects with diabetes (n = 63), the DOR was 8.51. When we included the male gender
(n = 122), the DOR was 3.48. When we included benign breast tumors (n = 222), the DOR was 1.39. When we
included all study population without excluding any comorbidity or confounding factor, the AUC was 0.72 (95%
CI: 0.71–0.76). We provided the summary receiver operating characteristic (SROC) curve to show the joint
estimate of the false positive rate and sensitivity for the electronic nose (Fig. 4).
Scientific Reports | (2021) 11:103 | https://doi.org/10.1038/s41598-020-80570-0 2
Vol:.(1234567890)www.nature.com/scientificreports/
Characteristics Case group (n = 351) Control group (n = 88) p value
Age (year), mean (SD) 55.35 (11.58) 55.69 (13.96) 0.31
White blood cell (103/µL), mean (SD) 6.19 (1.80) 6.52 (1.67) 0.12
Blood urea nitrogen (mg/dL), mean (SD) 13.51 (5.71) 14.39 (3.91) 0.09
Creatinine (mg/dL), mean (SD) 0.67 (0.14) 0.78 (0.56) 0.07
Alanine aminotransferase (U/L), mean (SD) 18.74 (17.61) 17.00 (9.99) 0.23
Fasting sugar 100.4 (54.69) 93.88 (16.02) 0.07
Cholesterol (mg/dL) 182.6(57.90) 201.4(18.89) 0.12
Pathology
Invasive carcinoma (%) 249 (63.55) N/A
Mucinous carcinoma (%) 5 (1.14) N/A
Metaplastic carcinoma (%) 2 (0.46) N/A
Paget disease (%) 2 (0.46) N/A
Ductal carcinoma in situ (DCIS) (%) 41 (9.34) N/A
Non-comedo DCIS (%) 1 (0.23) N/A
DCIS with microinvasion (%) 10 (2.28) N/A
Lobular Carcinoma in Situ (%) 5 (1.14) N/A
Molecular subtypes
Luminal A (%) 106 (44.92) N/A
Luminal B (%) 81 (34.32) N/A
HER2/neu (%) 33 (13.98) N/A
Triple-Negative (%) 16 (6.78) N/A
Table 1. Demographic characteristics of the study subjects.
Model and parameters Accuracy (95% CI) Sensitivity Specificity PPV NPV Kappa AUC (95% CI)
k-nearest neighbors (k = 5) 0.66 (0.58–0.74) 0.48 0.86 0.80 0.60 0.34 0.78 (0.71–0.86)
Naive Bayes (fL = 0, usekernel = TRUE, adjust = 1) 0.66 (0.58–0.74) 0.79 0.52 0.64 0.69 0.31 0.78 (0.71–0.85)
Decision tree (trials = 20, model = tree, window = FALSE) 0.91 (0.85–0.95) 0.86 0.97 0.97 0.86 0.82 0.98 (0.76–1.00)
Neural network (size = 1, decay = 1e−04) 0.67 (0.61–0.77) 0.71 0.62 0.68 0.66 0.33 0.98 (0. 96–1.00)
Support vector machines (linear kernel) (C = 1) 0.65 (0.51–0.68) 0.78 0.52 0.64 0.68 0.29 0.98 (0.96–1.00)
Support vector machines (radial kernel) (sigma = 0.1040273, C = 1) 0.68 (0.59–0.75) 0.60 0.76 0.73 0.63 0.36 0.98 (0.96–1.00)
Support vector machines (polynomial kernel) (degree = 3,
0.65 (0.60–0.73) 0.78 0.52 0.64 0.68 0.30 0.98 (0. 96–1.00)
scale = 0.1, C = 1)
Random forest (mtry = 2) 0.91 (0.85–0.95) 0.86 0.97 0.97 0.97 0.83 0.99 (0.99–1.00)
Mean value (SD) 0.72 (0.12) 0.73 (0.13) 0.72 (0.20) 0.76 (0.14) 0.72 (0.13) 0.45 (0.23) 0.93 (0.09)
Table 2. Prediction accuracy of the electronic nose in the test set of machine learning algorithms. PPV
positive predictive value, NPV negative predictive value, AUCarea under the receiver operating curve.
Discussion
To the best of our knowledge, this is the first study to provide evidence that the breath test can predict breast
cancer and its molecular subtype with good accuracy and reliability. The breath test uses the latest breathomics
and artificial intelligence (AI) technologies to assist physicians in making treatment decisions during surgery.
The strength of this study is that we sampled alveolar air directly from the tracheal tube to prevent contamina-
tion from the respiratory dead space, upper airway, and gastroenteric tract. The inclusion of dead space air in a
breath sample may lead to variable dilution of breath sample and contamination from exogenous volatile organic
compounds18. All subjects refrained from eating for at least eight hours before sampling and then underwent
endotracheal intubation for surgery. This design can largely prevent contamination from the food odors in the
gastroenteric tract and the oral cavity. We used a mainstream carbon dioxide monitor to guide the sampling
of alveolar air. The anesthesiologist collected air only when the concentration of CO2 reached the highest level
to ensure that the air came from the alveolar space. Compared with other studies, our sampling procedure can
obtain the purest alveolar air with the highest concentration of volatile metabolites. Because humidity and tem-
perature may have an influence on the electrical conductivity of the sensors and affect the m easurement19, we
connected a heat-moisture exchanger to keep a constant humidity and temperature (Fig. 5)20. Cigarette smoking
affects volatile organic compounds in exhaled b reath21. The study excluded subjects with a history of smoking or
second-hand smoke. The purpose of strict exclusion criteria was to prevent the influence of smoking and other
diseases and to provide the most reliable assessment of the breath test for breast cancer.
Scientific Reports | (2021) 11:103 | https://doi.org/10.1038/s41598-020-80570-0 3
Vol.:(0123456789)www.nature.com/scientificreports/
Figure 2. Statistical model performance of the random forest algorithm to diagnose breast cancer. Legends:
(A) The discriminatory accuracy is expressed as AUC with the 95% confidence interval. The grey area is the
95% confidence intervals using bootstrap resampling for 2000 replicates. (B) The partial area under the receiver
operating curve (pAUC). The blue area corresponds to the pAUC region between 90 and 100% for specificity
(SP), and the green area corresponds to the pAUC region between 90 and 100% for sensitivity (SE). The
corrected pAUCs are printed in the middle of the plot.
Luminal A Luminal B HER2/neu Triple-negative
Model Accuracy Kappa Accuracy Kappa Accuracy Kappa Accuracy Kappa
k-nearest neighbors 0.61 0.22 0.60 0.20 0.67 0.34 0.84 0.69
Naive Bayes 0.59 0.18 0.53 0.06 0.64 0.28 0.68 0.36
Decision tree 0.62 0.27 0.71 0.41 0.97 0.94 0.99 0.98
Neural network 0.55 0.11 0.56 0.12 0.65 0.29 0.77 0.54
Support vector machines (linear kernel) 0.51 0.02 0.54 0.08 0.60 0.20 0.77 0.54
Support vector machines (radial kernel) 0.57 0.15 0.59 0.18 0.59 0.19 0.84 0.67
Support vector machines (polynomial kernel) 0.63 0.26 0.63 0.25 0.66 0.32 0.85 0.69
Random forest 0.74 0.49 0.83 0.66 0.98 0.95 0.99 0.97
Table 3. Leave-one-out cross-validated discrimination accuracy and reliability of molecular phenotyping of
breast cancer using machine learning algorithms.
AI has gradually been used in the treatment decision support for breast cancer among oncologists with vary-
ing expertise22. Ha et al. developed a convolutional neural network algorithm to predict the molecular subtype
of a breast cancer based on MRI features, and the test set accuracy was 70%, and the ROC was 0.85323. Park
et al. conducted a radio-genomics study that investigated the accuracy of combing low-dose perfusion com-
puted tomography and five machine learning models to predict molecular subtypes of invasive breast cancer,
and results showed that the use of the random forest model had the best accuracy (66%) and AUC (0.82) to
predict molecular subtype24. In the application of machine learning techniques in human studies, imbalance
in class distribution may influence the performance of a classifier, and the random forest algorithm is suitable
for class imbalance problems. Guo et al. compared the performance of four commonly used machine learning
algorithms in high-dimensional omics data. They showed that the random forest was the best method when class
distributions were u nbalanced25. For sensor array data with imbalanced class distribution, Tan et al. reported
that the random forest combined with the oversampling is an effective solution to improve the performance of
the prediction m odel26. In this study, we also observed that the application of the random forest model had the
highest accuracy to predict the molecular subtype of breast cancer.
To develop a new diagnostic test, it is important to assess not only the accuracy but also the reproducibility
of results. Phillips et al. analyzed volatile organic compounds (VOCs) in the breath to diagnose breast cancer by
GC–MS. At that study, five breath biomarkers (2-propanol, 2,3-dihydro-1-phenyl-4(1H)-quinazolinone, 1-phe-
nyl-ethanone, heptanal, and isopropyl myristate) were identified and used to establish a prediction model that
showed high accuracy27. Peng et al. conducted a similar study to explore the breath biomarkers (3,3-dimethyl pen-
tane, 2-amino-5-isopropyl-8-methyl-1-azulenecarbonitrile, 5-(2-methylpropyl)nonane, 2,3,4-trimethyl, 6-ethyl-
3-octyl ester 2-trifluoromethyl benzoic acid) of breast cancer by GC–MS28; however, the identified biomarkers
were inconsistent with Phillips’s results27. Possible explanations for the discrepancy may include the effectiveness
of VOC filters in preventing environmental contamination, subjective selection of candidate biomarkers, and the
time interval between sampling and analysis that might change the composition or concentration of V OCs27,28.
Scientific Reports | (2021) 11:103 | https://doi.org/10.1038/s41598-020-80570-0 4
Vol:.(1234567890)www.nature.com/scientificreports/
Figure 3. Summary receiver operating characteristic (SROC) cures for diagnostic accuracy that includes
confounding factors or comorbidities. Legends: This figure shows a joint estimate of false positive rate and
sensitivity for the electronic nose data with 95% confidence and prediction regions. Scatter points are the
accuracy obtained from different machine learning models, and the solid closed curve is the 95% confidence
region.
Figure 4. The joint estimate of false positive rate and sensitivity for the electronic nose data with 95%
confidence and prediction regions. Legends: This figure shows the data that includes all study population
without excluding any confounding factor or comorbidity. Scatter points are the data. A solid closed curve is the
95% confidence region. The dotted closed curve is the 95% prediction region. Three summary ROC curves are
seen. The short solid line is the curve proposed by Rutter and Gatsonis15. The dashed line is the curve proposed
by Moses et al.16; the dotted line is the curve proposed by Rücker and S chumacher17.
In this study, we applied alveolar air sampling and collected air from the lower respiratory tract to prevent any
contamination from dead space or gastrointestinal tract, and all samples were analyzed immediately within
30 min. We have established standardized methods for the breath test, and all the procedures followed the STARD
guideline to report a diagnostic accuracy s tudy29. We have conducted a systemic review. We selected related stud-
ies published before November 20th, 2020, by searching PubMed and Web of Science. All relevant articles were
retrieved without language or geographic limitations. The search terms breast cancer, breast tumor, sensor, and
electronic nose were used in combination with the Boolean operators AND and OR. Studies were included if
they met the following criteria: (1) observational studies: cross-sectional, case–control, or prospective designs;
(2) population: breast cancer patients diagnosed according to the pathological report and established diagnostic
systems; (3) studies that provided sufficient information of sensitivity, specificity, and accuracy; (4) studies that
use an electronic nose to analyze endogenous VOC in feces, blood, exhaled breath, or urine to screen or assess
Scientific Reports | (2021) 11:103 | https://doi.org/10.1038/s41598-020-80570-0 5
Vol.:(0123456789)www.nature.com/scientificreports/
Figure 5. An alveolar air sampling by applying mainstream carbon dioxide monitoring and heat-moisture
exchanger to remove dead space air and humidity of exhaled breath.
breast cancer. The exclusion criteria were (1) duplicate publications; (2) letters or review articles; (3) cell or animal
studies; (4) non-gas sensor. Our databases retrieved 699 articles. We excluded 652 articles by screening through
the titles and abstracts. After a full-text review, we excluded a further 650, leaving two studies for i nclusion16,30.
Full details of the search results are provided in Supplementary Table S1. Because some confounding factors and
comorbidities will affect diagnostic accuracy, and different studies used different exclusion criteria. We suggest
that future studies could conduct a sensitivity analysis to show the impact of exclusion criteria and provide read-
ers with an overall estimate of diagnostic accuracy.
The advantage of the electronic nose system is that it can perform rapid breath biopsy during the operation.
We collected the alveolar air from the laryngeal mask airway and storage in a Tedlar air sampling bag and ana-
lyzed the sampled air offline in a room next to the operation room. We collected the air before surgery within a
few minutes, and the analysis can be completed within 30 min during the surgery. Traditionally, it takes a week
to get pathological and molecular studies reports.
However, there are some limitations. In this study, all subjects received anesthetics for surgery. Saraoglu et al.
used quartz crystal microbalance E-nose sensors to predict the anesthetic dose level, and results showed that
the anesthetics could be detected by the electronic n ose31. In this study, we administered all study subjects with
the anesthetic drug 2% Sevoflurane. We conservatively thought that the exhaled volatile organic compounds
that distinguished the case group and the control group are not derived from the anesthetics. We recommend
that future studies should also consider the possible effects of drugs during surgery. The intraoperative result
obtained in this study cannot be directly applied outside the operating room.
Conclusions
Cancer causes metabolic alteration to sustain fast cell growth and proliferation. The estrogen, progesterone, and
human epidermal growth factor receptor 2 hormone receptors have a unique metabolomic expression in breast
cancer patients. Analysis of the volatile metabolites in the breath of patients can be used to develop a breath test
for breast cancer. This study used sensor array and machine learning algorithms to analyze breath samples from
breast cancer patients. The results showed high accuracy and reliability in the discrimination of breast cancer
and the molecular subtype. The novel breath test has great potential to develop a rapid breast cancer diagnostic
tool during surgery.
Methods
Participants. We designed a case–control study to recruit cases of breast cancer and non-cancer controls.
We consecutively recruited breast tumor patients who underwent breast tumor resection at the National Taiwan
University Hospital. During the same period, we recruited a control group of subjects who underwent surgery
Scientific Reports | (2021) 11:103 | https://doi.org/10.1038/s41598-020-80570-0 6
Vol:.(1234567890)www.nature.com/scientificreports/
for gall bladder stone, hernia, fractures, urinary incontinence, and uterine prolapse at the same hospital. The
exclusion criteria included male gender, the history of a sthma14, diabetes mellitus14, cigarette smoking21, receiv-
ing chemotherapy that may affect metabolism and influence volatile organic compounds in exhaled breath. We
obtained medical history, occupational history, smoking history, medications, and dietary habits through face-
to-face interviews and medical records. All subjects received blood tests of white blood cells, fasting sugar, blood
urea nitrogen, creatinine, and alanine aminotransferase after eight hours of fasting.
All methods were carried out following relevant guidelines and regulations. The ethics committee of the
National Taiwan University Hospital approved the research protocol (No. 201512102RINC). All subjects provided
written informed consent before the study.
Molecular subtype. This study used immunohistochemistry (IHC) to determine the status of ER, PR, and
HER2. IHC was performed on formalin-fixed, paraffin-embedded tissue sections (thickness 4 μm) in the Central
Pathology Laboratory at the hospital. ER and PR were determined using the Ventana Benchmark system (Ven-
tana Medical Systems)32. The percentage of positive-staining nuclei was recorded. In this study, we applied the
National Comprehensive Cancer Network (NCCN) criteria to determine breast cancer’s molecular phenotype.
Both ER and PR status were determined for all invasive breast cancer and ductal carcinoma in situ (DCIS) using
a cutoff value of ≥ 1% as a positive result33. HER2 status was reported as strong positive when the IHC score
was 3 +34. We defined the molecular subtype of breast cancer as (1) luminal A (ER-positive and/or PR-positive,
and HER2-negative), (2) luminal B (ER-positive and/or PR-positive, and HER2-positive), (3) HER2/neu (ER-
negative, PR-negative, and HER2-positive), and triple-negative (ER-negative, PR-negative, and HER2-negative).
Collection of the breath sample. To avoid contamination from the dead space, we collected alveolar air
sampling by applying mainstream carbon dioxide ( CO2) monitoring35. All study subjects received a fixed dose
of intravenous drugs for anesthetic induction. Sevoflurane 2% was administered after insertion of the laryngeal
mask airway initially. The exhaled gas sampling was then performed. A heat-moisture exchanger was connected
to the airway instrument to remove the humidity of exhaled breath. The anesthesiologist collected one-litter of
alveolar air under the monitoring of the mainstream end-tidal CO2 analyzer before surgery. When the end-tidal
CO2 concentration reached the plateau, the anesthesiologist opened the entrance of the three-way valve to sam-
ple the alveolar air into a Tedlar bag (Fig. 5).
Analysis of E‑nose. The collected air was analyzed using Cyranose 320 E-nose (Sensigent, California, USA)
within 30 min, according to the established method36. The E-nose consists of 32 carbon nanotubes sensors that
can measure the volatile organic compounds in the breath by the changes in sensor r esistance37 (Supplementary
Fig. 1). We analyzed all samples in the same room with a temperature of 19.5–23.9℃ and a humidity of 53–64%.
The E-nose analyzed the air sample in each Tedlar bag ten times. According to the manufacturer’s suggestion and
previous studies36, we eliminated the first measurement data and obtained the mean of the remaining measure-
ments. The mean intra-class correlation coefficient (ICC) of sensor responses was 0.99 (SD 0.22) (Supplemen-
tary Table S2).
Reference standard. This study confirmed the diagnosis of breast cancer based on pathology and immu-
nohistochemistry reports. Using pathology and immunohistochemistry reports as the golden standard, we eval-
uated the validity and reliability of the breath test.
Statistics. This study used eight machine learning algorithms to build prediction models, including k-near-
est neighbors, naive Bayes, decision tree, neural network, support vector machines (SVMs) (including the linear
kernel, polynomial kernel, and radial basis kernel), and random forest38. We randomly divided the data into a
training set (80% of data) for model derivation and a test set (20% of data) for validation. We used the model-
Lookup function of the R caret package for automated parameter tuning to improve model p erformance39. We
used a bootstrap method and calculated the accuracy of 100 iterations to decide the parameters of machine
learning methods that had the highest prediction accuracy. Then, the optimized models were further tested in
the independent test set to evaluate the accuracy. To prevent the influence of an unequal proportion of cases in
each group, we adopted an oversampling method that replicates the observations of the minority class to bal-
ata40. We used the R package “class” to build the k-nearest neighbors model, “klaR” to build the naive
ance the d
Bayes model, “C50” to build the decision tree model, “neuralnet” to build the neural network model, “kernlab”
to build the SVMs model, and “randomForest” to build the random forest model. We determined the validity
of the breath test by accuracy, sensitivity, specificity, PPV, NPV, and AUC. AUC values of 0.7–0.8, 0.8–0.9, and
0.9–1.0 are regarded as good, very good, and excellent diagnostic accuracy, respectively41. To adjust accuracy by
accounting for the possibility of a correct prediction by chance only, we also calculated an AUC with 2000 boot-
strap replicates and the pAUC to assess the variability of the measure. The formula of pAUC was:
1 pAUC − min
pROC = 1+
2 max − min
where min is the pAUC over the same region of the diagonal ROC curve, and max is the pAUC over the same
region of the perfect ROC curve42. Because we were interested in a diagnostic test with a high specificity and
sensitivity, we also examined the partial AUC between 90 and 100% for specificity and sensitivity. We assessed
the reliability by leave-one-out cross-validation and the kappa statistic. Kappa expresses the extent to which the
observed agreement exceeds that would be expected by chance alone43. A kappa greater than 0.75 represents
Scientific Reports | (2021) 11:103 | https://doi.org/10.1038/s41598-020-80570-0 7
Vol.:(0123456789)www.nature.com/scientificreports/
excellent agreement beyond chance, a kappa below 0.40 represents a poor agreement, and a kappa of 0.40 to 0.75
represents intermediate to good agreement.
To evaluate the influence of comorbidities and confounding factors on diagnostic accuracy, we conducted
additional analyses to compare the effects of comorbidities and confounding factors on diagnostic accuracy. We
included each potential confounding factor or comorbidity, used eight machine learning algorithms, and applied
meta-analyses of diagnostic accuracy to generate pooled point estimates of the accuracy and S ROC44. We used
the DOR to quantify the impact of confounding factors on accuracy:
(1)
DOR = True positive/False negative / False positive/True negative
A DOR value ranges from 0 to infinity, with higher values indicating better discriminatory test performance.
A value of 1 means that a test does not discriminate between patients with the disorder and those without i t45. A
test with a DOR of 10 is considered to be an excellent t est46. Also, we included all subjects and did not exclude
any confounding factor or comorbidity for readers to judge the worst-case scenario accuracy. The software used
for this analysis was R-package mada.
Data availability
De-identified volatilome data is available upon request to the corresponding author.
Received: 22 September 2020; Accepted: 16 December 2020
References
1. Bray, F. et al. Global cancer statistics 2018: GLOBOCAN estimates of incidence and mortality worldwide for 36 cancers in 185
countries. CA Cancer J. Clin. 68, 394–424. https://doi.org/10.3322/caac.21492 (2018).
2. Althuis, M. D., Dozier, J. M., Anderson, W. F., Devesa, S. S. & Brinton, L. A. Global trends in breast cancer incidence and mortality
1973–1997. Int. J. Epidemiol. 34, 405–412. https://doi.org/10.1093/ije/dyh414 (2005).
3. Plevritis, S. K. et al. Association of screening and treatment with breast cancer mortality by molecular subtype in US women,
2000–2012. Jama J. Am. Med. Assoc. 319, 154–164. https://doi.org/10.1001/jama.2017.19130 (2018).
4. Gaudet, M. M. et al. Pooled analysis of nine cohorts reveals breast cancer risk factors by tumor molecular subtype. Cancer Res. 78,
6011–6021. https://doi.org/10.1158/0008-5472.Can-18-0502 (2018).
5. Hammond, M. E., Hayes, D. F., Wolff, A. C., Mangu, P. B. & Temin, S. American society of clinical oncology/college of american
pathologists guideline recommendations for immunohistochemical testing of estrogen and progesterone receptors in breast cancer.
J. Oncol. Pract. 6, 195–197. https://doi.org/10.1200/JOP.777003 (2010).
6. Gogineni, K. & DeMichele, A. Current approaches to the management of Her2-negative metastatic breast cancer. Breast Cancer
Res. 14, 205. https://doi.org/10.1186/bcr3064 (2012).
7. Deyarmin, B. et al. Effect of ASCO/CAP guidelines for determining ER status on molecular subtype. Ann. Surg. Oncol. 20, 87–93.
https://doi.org/10.1245/s10434-012-2588-8 (2013).
8. Cappelletti, V. et al. Metabolic footprints and molecular subtypes in breast cancer. Dis. Markers https: //doi.org/10.1155/2017/76878
51 (2017).
9. Fan, Y. et al. Human plasma metabolomics for identifying differential metabolites and predicting molecular subtypes of breast
cancer. Oncotarget 7, 9925–9938. https://doi.org/10.18632/oncotarget.7155 (2016).
10. Lavra, L. et al. Investigation of VOCs associated with different characteristics of breast cancer cells. Sci. Rep. 5, 13246. https://doi.
org/10.1038/srep13246 (2015).
11. van der Schee, M. P. et al. Breathomics in lung disease. Chest 147, 224–231. https://doi.org/10.1378/chest.14-0781 (2015).
12. Buszewski, B., Kesy, M., Ligor, T. & Amann, A. Human exhaled air analytics: biomarkers of diseases. Biomed. Chromatogr. 21,
553–566. https://doi.org/10.1002/bmc.835 (2007).
13. Queralto, N. et al. Detecting cancer by breath volatile organic compound analysis: a review of array-based sensors. J Breath Res.
8, 027112. https://doi.org/10.1088/1752-7155/8/2/027112 (2014).
14. Shirasu, M. & Touhara, K. The scent of disease: volatile organic compounds of the human body related to disease and disorder. J.
Biochem. 150, 257–266. https://doi.org/10.1093/jb/mvr090 (2011).
15. Rutter, C. M. & Gatsonis, C. A. A hierarchical regression approach to meta-analysis of diagnostic test accuracy evaluations. Stat.
Med. 20, 2865–2884. https://doi.org/10.1002/sim.942 (2001).
16. Moses, L. E., Shapiro, D. & Littenberg, B. Combining independent studies of a diagnostic-test into a summary roc curve: data-
analytic approaches and some additional considerations. Stat. Med. 12, 1293–1316. https: //doi.org/10.1002/sim.478012 1403 (1993).
17. Rucker, G. & Schumacher, M. Summary ROC curve based on a weighted Youden index for selecting an optimal cutpoint in meta-
analysis of diagnostic accuracy. Stat. Med. 29, 3069–3078. https://doi.org/10.1002/sim.3937 (2010).
18. de Silva, G. & Beyette, F. R. Alveolar air volatile organic compound extractor for clinical breath sampling. Conf. Proc. IEEE Eng.
Med. Biol. Soc. 5369–5372, 2014. https://doi.org/10.1109/EMBC.2014.6944839 (2014).
19. Bikov, A., Lazar, Z. & Horvath, I. Established methodological issues in electronic nose research: how far are we from using these
instruments in clinical settings of breath analysis?. J. Breath Res. 9, 034001. https://doi.org/10.1088/1752-7155/9/3/034001 (2015).
20. Johansson, A., Lundberg, D. & Luttropp, H. H. The effect of heat and moisture exchanger on humidity and body temperature in a
low-flow anaesthesia system. Acta Anaesthesiol. Scand. 47, 564–568. https://doi.org/10.1034/j.1399-6576.2003.00108.x (2003).
21. Filipiak, W. et al. Dependence of exhaled breath composition on exogenous factors, smoking habits and exposure to air pollutants.
J. Breath Res. 6, 036008. https://doi.org/10.1088/1752-7155/6/3/036008 (2012).
22. Xu, F. et al. Artificial intelligence treatment decision support for complex breast cancer among oncologists with varying expertise.
JCO Clin. Cancer Inform. 3, 1–15. https://doi.org/10.1200/CCI.18.00159 (2019).
23. Ha, R. et al. Predicting breast cancer molecular subtype with MRI dataset utilizing convolutional neural network algorithm. J.
Digit. Imaging 32, 276–282. https://doi.org/10.1007/s10278-019-00179-2 (2019).
24. Park, E. K. et al. Machine learning spproaches to radiogenomics of breast cancer using low-dose perfusion computed tomography:
predicting prognostic biomarkers and molecular subtypes. Sci. Rep. https://doi.org/10.1038/s41598-019-54371-z (2019).
25. Guo, Y., Graber, A., McBurney, R. N. & Balasubramanian, R. Sample size and statistical power considerations in high-dimension-
ality data settings: a comparative study of classification algorithms. BMC Bioinform. 11, 447. https://doi.org/10.1186/1471-2105-
11-447 (2010).
26. Tan, X. et al. Wireless sensor networks intrusion detection based on SMOTE and the random forest algorithm. Sensors (Basel)
https://doi.org/10.3390/s19010203 (2019).
Scientific Reports | (2021) 11:103 | https://doi.org/10.1038/s41598-020-80570-0 8
Vol:.(1234567890)www.nature.com/scientificreports/
27. Phillips, M. et al. Prediction of breast cancer using volatile biomarkers in the breath. Breast Cancer Res. Treat 99, 19–21. https://
doi.org/10.1007/s10549-006-9176-1 (2006).
28. Peng, G. et al. Detection of lung, breast, colorectal, and prostate cancers from exhaled breath using a single array of nanosensors.
Br. J. Cancer 103, 542–551. https://doi.org/10.1038/sj.bjc.6605810 (2010).
29. Bossuyt, P. M. et al. Towards complete and accurate reporting of studies of diagnostic accuracy: the STARD initiative. Standards
for Reporting of Diagnostic Accuracy. Clin. Chem. 49, 1–6 (2003).
30. Diaz de Leon-Martinez, L. et al. Identification of profiles of volatile organic compounds in exhaled breath by means of an elec-
tronic nose as a proposal for a screening method for breast cancer: a case-control study. J. Breath Res. 14, 046009. https://doi.
org/10.1088/1752-7163/aba83f (2020).
31. Saraoglu, H. M. & Edin, B. E-Nose system for anesthetic dose level detection using artificial neural network. J. Med. Syst. 31,
475–482. https://doi.org/10.1007/s10916-007-9087-7 (2007).
32. Lin, C. H. et al. Molecular subtypes of breast cancer emerging in young women in Taiwan: evidence for more than just westerni-
zation as a reason for the disease in Asia. Cancer Epidemiol. Biomark. Prev. 18, 1807–1814. https://doi.org/10.1158/1055-9965.
EPI-09-0096 (2009).
33. Allred, D. C. et al. NCCN task force report: estrogen receptor and progesterone receptor testing in breast cancer by immunohis-
tochemistry. J. Natl. Compr. Canc. Netw. 7(Suppl 6), S22–S23 (2009).
34. Carlson, R. W. et al. HER2 testing in breast cancer: NCCN task force report and recommendations. J. Natl. Compr. Canc. Netw.
4(Suppl 3), S1–S22 (2006).
35. Schubert, J. K., Spittler, K. H., Braun, G., Geiger, K. & Guttmann, J. CO(2)-controlled sampling of alveolar gas in mechanically
ventilated patients. J. Appl. Physiol. 1985(90), 486–492 (2001).
36. Bofan, M. et al. Within-day and between-day repeatability of measurements with an electronic nose in patients with COPD. J.
Breath Res. 7, 017103. https://doi.org/10.1088/1752-7155/7/1/017103 (2013).
37. Lu, Y. P., Meyyappan, M. & Li, J. A carbon nanotube sensor array for sensitive gas discrimination using principal component
analysis. J. Electroanal. Chem. 593, 105–110 (2006).
38. Lantz, B. Machine Learning with R 2nd edn. (Packt Publishing Ltd., Birmingham, 2015).
39. Kuhn, M. Building predictive models in R using the caret package. J. Stat. Softw. 28, 1–26. https://doi.org/10.18637/jss.v028.i05
(2008).
40. Wei, Q. & Dunbrack, R. L. Jr. The role of balanced training and testing data sets for binary classifiers in bioinformatics. PLoS ONE
8, e67863. https://doi.org/10.1371/journal.pone.0067863 (2013).
41. Simundic, A. M. Measures of diagnostic accuracy: basic definitions. EJIFCC 19, 203–211 (2009).
42. Robin, X. et al. pROC: an open-source package for R and S+ to analyze and compare ROC curves. BMC Bioinform. 12, 77. https
://doi.org/10.1186/1471-2105-12-77 (2011).
43. Tooth, L. R. & Ottenbacher, K. J. The kappa statistic in rehabilitation research: an examination. Arch. Phys. Med. Rehabil. 85,
1371–1376. https://doi.org/10.1016/j.apmr.2003.12.002 (2004).
44. Shim, S. R., Kim, S. J. & Lee, J. Diagnostic test accuracy: application and practice using R software. Epidemiol. Health 41, e2019007.
https://doi.org/10.4178/epih.e2019007 (2019).
45. Glas, A. S., Lijmer, J. G., Prins, M. H., Bonsel, G. J. & Bossuyt, P. M. The diagnostic odds ratio: a single indicator of test performance.
J. Clin. Epidemiol. 56, 1129–1135. https://doi.org/10.1016/s0895-4356(03)00177-x (2003).
46. Blackman, N. J. Systematic reviews of evaluations of diagnostic and screening tests. Odds ratio is not independent of prevalence.
BMJ 323, 1188 (2001).
Author contributions
Conceptualization, H.-Y.Y. and C.-H.H.; methodology, C.-H.H. and H.-Y.Y.; software, H.-Y.Y.; validation, H.-Y.Y.;
formal analysis, H.-Y.P. and H.-Y.Y.; resources, C.-H.H.; data curation, Y.-C. W.; writing—original draft prepara-
tion, H.-Y.P.; writing—review and editing, H.-Y.Y.; supervision, H.-Y.Y. and C.-H.H.; project administration,
H.-Y.P.; funding acquisition, H.-Y.Y.. All authors read and approved the final manuscript.
Funding
This research was funded by the Ministry of Science and Technology, Taiwan, grant numbers [MOST 106-2314-
B-002-107, 107-2314-B-002-198, 108-2918-I-002-031, 109-2314-B-002-166-MY3, 109-2511-H-002-014].
Competing interests
The authors declare no competing interests.
Additional information
Supplementary Information The online version contains supplementary material available at https://doi.
org/10.1038/s41598-020-80570-0.
Correspondence and requests for materials should be addressed to C.-H.H.
Reprints and permissions information is available at www.nature.com/reprints.
Publisher’s note Springer Nature remains neutral with regard to jurisdictional claims in published maps and
institutional affiliations.
Open Access This article is licensed under a Creative Commons Attribution 4.0 International
License, which permits use, sharing, adaptation, distribution and reproduction in any medium or
format, as long as you give appropriate credit to the original author(s) and the source, provide a link to the
Creative Commons licence, and indicate if changes were made. The images or other third party material in this
article are included in the article’s Creative Commons licence, unless indicated otherwise in a credit line to the
material. If material is not included in the article’s Creative Commons licence and your intended use is not
permitted by statutory regulation or exceeds the permitted use, you will need to obtain permission directly from
the copyright holder. To view a copy of this licence, visit http://creativecommons.org/licenses/by/4.0/.
© The Author(s) 2021
Scientific Reports | (2021) 11:103 | https://doi.org/10.1038/s41598-020-80570-0 9
Vol.:(0123456789)You can also read