Magnetic resonance imaging and ultrasound for prediction of residual tumor size in early breast cancer within the ADAP T subtrials
←
→
Page content transcription
If your browser does not render page correctly, please read the page content below
Graeser et al. Breast Cancer Research   (2021) 23:36
https://doi.org/10.1186/s13058-021-01413-y

 RESEARCH ARTICLE                                                                                                                                   Open Access

Magnetic resonance imaging and
ultrasound for prediction of residual tumor
size in early breast cancer within the ADAP
T subtrials
Monika Graeser1,2,3*† , Simone Schrading4†, Oleg Gluz1,2,5, Kevin Strobel4, Christopher Herzog6, Lale Umutlu7,
Alex Frydrychowicz8, Dorothea Rjosk-Dendorfer9, Rachel Würstlein1,10, Ralph Culemann11, Christine Eulenburg1,
Jascha Adams12, Henrik Nitzsche2, Anna Prange13, Sherko Kümmel1,14,15, Eva-Maria Grischke16, Helmut Forstbauer17,
Michael Braun18, Jochem Potenberg19, Raquel von Schumann2, Bahriye Aktas20,21, Cornelia Kolberg-Liedtke15,20,
Nadia Harbeck1,10, Christiane K. Kuhl4 and Ulrike Nitz1,2

  Abstract
  Background: Prediction of histological tumor size by post-neoadjuvant therapy (NAT) ultrasound and magnetic
  resonance imaging (MRI) was evaluated in different breast cancer subtypes.
  Methods: Imaging was performed after 12-week NAT in patients enrolled into three neoadjuvant WSG ADAPT
  subtrials. Imaging performance was analyzed for prediction of residual tumor measuring ≤10 mm and summarized
  using positive (PPV) and negative (NPV) predictive values.
  Results: A total of 248 and 588 patients had MRI and ultrasound, respectively. Tumor size was over- or
  underestimated by < 10 mm in 4.4% and 21.8% of patients by MRI and in 10.2% and 15.8% by ultrasound. Overall,
  NPV (proportion of correctly predicted tumor size ≤10 mm) of MRI and ultrasound was 0.92 and 0.83; PPV (correctly
  predicted tumor size > 10 mm) was 0.52 and 0.61. MRI demonstrated a higher NPV and lower PPV than ultrasound
  in hormone receptor (HR)-positive/human epidermal growth factor receptor 2 (HER2)-positive and in HR−/HER2+
  tumors. Both methods had a comparable NPV and PPV in HR−/HER2− tumors.
  Conclusions: In HR+/HER2+ and HR−/HER2+ breast cancer, MRI is less likely than ultrasound to underestimate
  while ultrasound is associated with a lower risk to overestimate tumor size. These findings may help to select the
  most optimal imaging approach for planning surgery after NAT.
  Trial registration: Clinicaltrials.gov, NCT01815242 (registered on March 21, 2013), NCT01817452 (registered on
  March 25, 2013), and NCT01779206 (registered on January 30, 2013).
  Keywords: Breast cancer, Neoadjuvant therapy, Magnetic resonance imaging, Ultrasound, Residual tumor size

* Correspondence: monika.graeser@wsg-online.com
†
 Monika Graeser and Simone Schrading contributed equally to this work.
1
 West German Study Group, Ludwig-Weber-Strasse 15, 41061
Moenchengladbach, Germany
2
 Ev. Hospital Bethesda, Breast Center Niederrhein, Ludwig-Weber-Strasse 15,
41061 Moenchengladbach, Germany
Full list of author information is available at the end of the article

                                        © The Author(s). 2021 Open Access This article is licensed under a Creative Commons Attribution 4.0 International License,
                                        which permits use, sharing, adaptation, distribution and reproduction in any medium or format, as long as you give
                                        appropriate credit to the original author(s) and the source, provide a link to the Creative Commons licence, and indicate if
                                        changes were made. The images or other third party material in this article are included in the article's Creative Commons
                                        licence, unless indicated otherwise in a credit line to the material. If material is not included in the article's Creative Commons
                                        licence and your intended use is not permitted by statutory regulation or exceeds the permitted use, you will need to obtain
                                        permission directly from the copyright holder. To view a copy of this licence, visit http://creativecommons.org/licenses/by/4.0/.
                                        The Creative Commons Public Domain Dedication waiver (http://creativecommons.org/publicdomain/zero/1.0/) applies to the
                                        data made available in this article, unless otherwise stated in a credit line to the data.
Graeser et al. Breast Cancer Research (2021) 23:36 Page 2 of 13 Background response to individualize NAT by avoiding over- and Neoadjuvant therapy (NAT) allows monitoring of tumor under-treatment. The primary objective of this analysis response to treatment, provides important prognostic in- was to compare the value of MRI versus US performed formation, and may permit breast-conserving surgery by at the end of neoadjuvant therapy (EoT) for prediction downstaging cancer [1]. Efficacy of NAT can be mea- of pCR and residual disease and their accuracy in pre- sured using pathological complete response (pCR), most dicting histological tumor size in hormone receptor- commonly defined as the absence of invasive cancer and positive, human epidermal growth factor receptor-2 in situ cancer in the breast and axillary nodes (ypT0 positive (HR+/HER2+), HR−/HER2−, and HR−/HER2+ ypN0); absence of invasive cancer in the breast and axil- tumors from the respective ADAPT substudies. lary nodes, irrespective of ductal carcinoma in situ (ypT0/is ypN0); and absence of invasive cancer in the Methods breast irrespective of ductal carcinoma in situ or nodal Study design involvement (ypT0/is). A meta-analysis by Cortazar et al. Details on the design of WSG-ADAPT, a prospective, demonstrated that pCR defined as either ypT0/is ypN0 controlled, randomized, non-blinded, multi-center, and or ypT0 ypN0 was associated with improved overall sur- investigator-initiated umbrella clinical trial, and the re- vival and event-free survival compared to ypT0/is with- sults of three substudies, ADAPT triple-negative (TN, out information on the nodal status. Nowadays, NCT01815242), ADAPT HER2+/HR+ (NCT01817452), ultrasound (US) and magnetic resonance imaging (MRI) and ADAPT HER2+/HR− substudies (NCT01779206), are commonly used to monitor tumor response to NAT, have been previously reported [10–13]. With regard to and several studies have investigated their application this analysis, three breast cancer subtypes were investi- for the prediction of pCR and measurement of residual gated: (i) HR+/HER2+ tumors after NAT including tras- tumor. Assessment of tumor size after NAT allows to tuzumab emtansine monotherapy (T-DM1), T-DM1+ determine the best surgical approach, or alternatively, it endocrine therapy (ET), or trastuzumab+ET; (ii) HR may provide evidence to continue the same systemic −/HER2− tumors after neoadjuvant nab-paclitaxel+gem- therapy or switch to another regimen [2, 3]. However, citabine or nab-paclitaxel+carboplatin; and (iii) HR there is conflicting evidence regarding the accuracy of −/HER2+ tumors after neoadjuvant trastuzumab+pertu- these two methods for the evaluation of residual tumors zumab treatment with or without paclitaxel. Enrolled pa- with some studies indicating the superiority of MRI [4, tients were examined with US (mandatory) and MRI 5] while other reports suggest comparable accuracy of (optional) before systemic therapy, at 3 and 6 weeks after MRI and US [6–8]. The accuracy of the employed the start of NAT and at EoT. Here, we investigated only method in estimating tumor size has a profound impact those patients with MRI and/or US performed at EoT. on the success of surgery in terms of long-term out- After neoadjuvant therapy, surgery within 3 weeks or comes and good cosmetic results. Only the most precise histologic confirmation of non-pCR by core needle bi- evaluation of the lesion allows complete tumor resection opsy was obligatory. In case of a histologically confirmed while keeping the removal of surrounding tissue to a residual invasive tumor by core needle biopsy, patients minimum. Underestimation of lesion size carries the risk received standard NAT according to the national guide- of resection with tumor-positive margins thus potentially lines and underwent surgery afterwards. Clinically node- worsening patient prognosis and requiring repeat sur- positive patients underwent axillary dissection after com- gery. Overestimation, however, may increase the likeli- pletion of NAT. Sentinel node biopsy in clinically node- hood of mastectomy in cases where breast-conserving negative patients was performed either before or after surgery would have normally been recommended [9]. NAT, at the investigator’s discretion. Adjuvant therapy Therefore, the accuracy of the imaging method is of pro- was administered according to the national guidelines. found importance for disease prognosis and for patients’ quality of life. Thus far, only a few studies have com- Eligibility criteria for enrollment of the patients pared the post-NAT assessment of tumor size by MRI Women aged ≥18 years, with histologically confirmed and US with histological measurements as the gold unilateral, primary invasive BC, and HR/HER2 status standard. centrally confirmed at Institute of Pathology, Univer- The present imaging subproject was performed within sity of Hannover, Germany, were eligible to partici- the framework of the Adjuvant Dynamic Marker- pate in the study. HR-positive (≥1% of tumor nuclei Adjusted Personalized Therapy Trial Optimizing Risk staining positive for estrogen receptor and/or proges- Assessment and Therapy Response Prediction in Early terone receptor) and HER2-positive status (immuno- Breast Cancer (ADAPT) umbrella trial conducted by the histochemistry (IHC) 3+ positive or in situ West German Study Group (WSG). The aim of the hybridization (ISH) positive) was required for partici- ADAPT study was to identify early markers for therapy pation in the ADAPT HER2+/HR+ substudy, HR-
Graeser et al. Breast Cancer Research   (2021) 23:36                                                          Page 3 of 13

negative (< 1% of tumor nuclei staining positive for         MRI interpretation
estrogen receptor and progesterone receptor) and             A blinded analysis of locally acquired MRI images was
HER2-positive status was required for the ADAPT              conducted at the central reading site by two specialized
HER2+/HR− substudy, and HR-negative and HER2-                breast radiologists with 13 (SS) and 23 years (CK) of ex-
negative (IHC 1+ negative or IHC 0 negative, or ISH          perience in interpreting breast MRI images. Images were
negative) status was required for participation in the       read according to BI-RADS guidelines (5th edition, [14]).
ADAPT TN substudy. Eastern Cooperative Oncology              Initially, the first (early) post-contrast subtracted or fat-
Group Performance Status ≤1 or Karnofsky Perform-            suppressed T1 image was read for an overview of enhan-
ance Status ≥80%, normal organ function, and ad-             cing lesions and to access background enhancement.
equate hematologic parameters were required for              Afterwards, the complete unsubtracted dynamic series
inclusion. Detailed inclusion and exclusion criteria for     pre- and post-contrast at each slice was thoroughly ana-
participation in the ADAPT study have been de-               lyzed for characteristics of any enhancing lesion and
scribed elsewhere [10–13]. All patients provided writ-       evaluation of enhancing residual disease. Then, the T2-
ten informed consent prior to study enrollment.              weighted series was analyzed for any structural changes
                                                             and fluid containing lesions/edema. Any lesions in the
MRI technique                                                dynamic contrast-enhanced images were correlated with
Breast MRI was performed at 43 sites thus providing an       the T2-weighted series for morphology and signal inten-
overview regarding radiology practice in Germany. In         sity. Final evaluation for complete imaging response was
order to obtain images of comparable quality across all      based on the whole dynamic series, at which enhance-
study locations, the central MRI reading site (Depart-       ment characteristic and morphologic criteria at T1 pre-
ment of Diagnostic and Interventional Radiology, Uni-        and post-contrast considering the early and late phase
versity Hospital, RWTH Aachen, Germany) provided a           and also on the signal intensity on T2. Lesion size was
standardized imaging protocol which consisted of basic       measured in the longest diameter on the unsubtracted
sequences; there was no need for special hardware or         images. In patients with no visible tumor after NAT,
software. Prior to study participation, images provided      anatomic landmarks in non-subtracted T1- and T2-
by local reading sites were evaluated by the central read-   weighted images were analyzed to identify the site of the
ing site to ensure that the required MRI technique stan-     lesion.
dards were met.
  The standardized imaging protocol of 1.5-T and             US imaging
3.0-T systems with a dedicated breast multichannel           Before the first NAT cycle, patients underwent a system-
surface coil consisted of an axial bilateral two-            atic sonographic examination of both breasts and axillae
dimensional multi-section gradient-echo dynamic              by experienced gynecologists using breast US systems
series (repetition time 250 ms; echo time 4.6 ms (1.5        with at least 7.5 MHz and an electronic linear US probe.
T) or 2.3 ms (3 T); flip angle 90°) with a section           If possible, the tumor was measured in one to three di-
thickness of 3 mm and full 512 × 512 acquisition             ameters, and measurements were registered in the elec-
matrix. The voxel size of all scans was kept constant        tronic case report forms. US was then repeated after one
along all exams with a maximum of 0.8. To ensure a           and two cycles of NAT and at EoT. All US images were
high spatial resolution, the field of view was adapted       read and interpreted at the local study site by experi-
to the individual breast size of the patient with a          enced gynecologists. The lesions were described, and
minimum of 280 mm and a maximum of 350 mm                    tumor size measured. The tumor was marked with a clip
keeping the voxel size within the intended range.            before the first cycle of NAT to be able to reliably iden-
The dynamic sequence was performed prior to and              tify the tumor region at the subsequent examinations.
four times after bolus injection of macrocyclic gado-
linium agent, gadobutrol (Gadovist®/Gadavist®, Bayer         Histological assessment
AG, Leverkusen, Germany; 0.1 mmol/kg body                    Post-NAT surgical specimens underwent local histo-
weight), followed by a saline flush. Depending on the        pathological assessment, and the longest diameter of the
site preference, fat suppression or image subtraction        residual tumor was documented. No histopathological
was used for visualization of enhancement in the T1          evidence of residual invasive tumor cells, either in the
gradient-echo sequence. A standard center of k-space         breast or the axillary lymph nodes (ypT0/is ypN0), was
between 60 and 90 s was used in all exams. In                denoted as pCR.
addition, an axial T2-weighted fast spin-echo se-
quence without fat suppression and with identical            Statistical analyses
anatomic parameters as the T1-gradient echo se-              Accuracy of post-NAT US and MRI was analyzed for
quence was performed.                                        prediction of residual tumor size of ≥10 mm (the gold
Graeser et al. Breast Cancer Research (2021) 23:36 Page 4 of 13 standard). The concordance between imaging and histo- a ≤ 10 mm difference in tumor size between imaging and logical assessment was summarized by computing Spear- histological assessments. man’s correlation coefficient, graphically displaying the Available data were analyzed and compared between difference in tumor diameter (mm) between imaging the three groups: patients who underwent MRI (MRI and histological assessment, as well as comparing the group), patients who underwent US (US group), and pa- positive predictive value (PPV), negative predictive value tients who underwent both MRI and US (MRI and US (NPV), sensitivity, and specificity in each tumor subtype. group). PPV was defined as the proportion of correctly predicted Statistical data analyses were performed with SAS soft- tumors measuring > 10 mm on post-NAT imaging com- ware (version 9.4, SAS Institute, NC) and Stata (version pared to the final pathology specimen. NPV was defined 16.1/ SE, StataCorp LLC, TX). Graphs, including the as the proportion of correctly predicted tumors measur- quadratic curves, were plotted using the GraphPad ing ≤10 mm by imaging. In addition, we analyzed the Prism 8 software (GraphPad Software, CA). value of US and MRI for the prediction of pCR by calcu- lating PPV (probability that non-pCR was documented Results when no complete response was observed), NPV (prob- Patient characteristics ability that pCR was actually achieved following A total of 845 patients at 58 sites in Germany were en- complete response on imaging), sensitivity, and specifi- rolled from October 2012 to December 2015, of which city. Receiver operating characteristic (ROC) curves and 375 were randomized into the ADAPT HR+/HER2+ ROC area under the curve (AUC) predicting a residual substudy, 336 into the ADAPT HR−/HER2− substudy, tumor from imaging were computed. Furthermore, pa- and 134 into the ADAPT HR−/HER2+ substudy (Fig. 1). tient characteristics at baseline were compared between A total of 662 patients were investigated with MRI and/ the cohorts with tumor size overestimation or underesti- or US at EoT, of whom 588 patients had US, 248 had mation by imaging (difference > 10 mm for both) or with MRI, and 174 had both imaging techniques. Data on Fig. 1 CONSORT diagram. EoT, end of therapy; ET, endocrine therapy; MRI, magnetic resonance imaging, pCR, pathological complete response; T- DM1, trastuzumab emtansine; US, ultrasound
Graeser et al. Breast Cancer Research             (2021) 23:36                                                                  Page 5 of 13

tumor length were available in 229/248 MRI measure-                            patients (n = 159/248, Table 1). Histological tumor size
ments, 577/588 US measurements, and in 808/845                                 was overestimated by MRI by > 10 mm only in 4.4% of
pathological evaluations (243/248 within the MRI group,                        patients (n = 11/248) and underestimated by > 10 mm in
571 within the US group, and 169/174 within the group                          21.8% of patients (n = 54/248). There were no HR
of both US and MRI evaluations).                                               −/HER2+ tumors with size overestimation by MRI,
  The baseline characteristics were comparable between                         whereas tumor size was underestimated in 22% of pa-
patients from the MRI group (Table 1) and the US group                         tients with this BC subtype (n = 11/50). Tumor size was
(Table 2) with a median age of 52 and 51 years, rates of                       underestimated in only 14.1% of HR−/HER2− (n = 13/
T1 at 44.0% and 40.1%, T2 at 51.2% and 53.6%, N0 at                            92) and in 28.3% of HR+/HER2+ tumors (n = 30/106).
66.1% and 70.4%, and N1 at 29.4% and 26.2%, respectively.                         In the US group, estimated tumor size differed from
  In the MRI group, the difference in tumor size be-                           histology by ≤10 mm in 69.2% of patients (n = 407/
tween MRI and histology was ≤10 mm in 64.1% of                                 588, Table 2). US overestimated and underestimated

Table 1 Patient characteristics (MRI group) according to tumor size estimation and discordance between MRI and histology
                                       Overestimation            Difference                Underestimation         Unknown       Total
                                       MRI – Histol. > 10 mm     MRI – Histol. ≤10 mm      MRI – Histol. > 10 mm
Number of patients (% of total)        11 (4.44)                 159 (64.11)               54 (21.77)              24 (9.68)     248 (100.00)
Age at initial visit [years]
  Mean                                 43.27                     52.06                     52.19                   49.33         51.43
  SD                                   6.18                      11.31                     11.29                   9.47          11.08
  Median                               44.00                     52.00                     53.00                   50.00         52.00
  Min                                  26.00                     25.00                     30.00                   34.00         25.00
  Max                                  50.00                     78.00                     75.00                   70.00         78.00
  N.d.                                 0                         2                         0                       0             2
Central grade, N (%)
  1                                    0 (0.00)                  4 (80.00)                 1 (20.00)               0 (0.00)      5 (100.00)
  2                                    5 (4.49)                  66 (65.35)                22 (21.78)              8 (7.92)      101 (100.00)
  3                                    6 (4.29)                  88 (62.86)                30 (21.43)              16 (11.43)    140 (100.00)
  N.d.                                 0 (0.00)                  1 (50.00)                 1 (50.00)               0 (0.00)      2 (100.00)
Clinical baseline characteristics, N (%)
  cT
       1                               5 (4.59)                  80 (73.39)                19 (17.43)              5 (4.59)      109 (100.00)
       2                               6 (4.72)                  78 (61.42)                29 (22.83)              14 (11.02)    127 (100.00)
       3                               0 (0.00)                  1 (10.00)                 5 (50.00)               4 (40.00)     10 (100.00)
       4                               0 (0.00)                  0 (0.00)                  1 (50.00)               1 (50.00)     2 (100.00)
  cN
       0                               6 (3.66)                  121 (73.78)               30 (18.29)              7 (4.27)      164 (100.00)
       1                               5 (6.85)                  34 (46.58)                21 (28.77)              13 (17.81)    73 (100.00)
       2                               0 (0.00)                  4 (40.00)                 3 (30.00)               3 (30.00)     10 (100.00)
       3                               0 (0.00)                  0 (0.00)                  0 (0.00)                1 (100.00)    1 (100.00)
Menopausal status, N (%)
  Premenopausal                        11 (9.24)                 72 (60.50)                23 (19.84)              13 (10.92)    119 (100.00)
  Postmenopausal                       0 (0.00)                  80 (67.23)                28 (23.53)              11 (9.24)     119 (100.00)
  Unknown/unclear                      0 (0.00)                  7 (70.00)                 3 (30.00)               0 (0.00)      10 (100.00)
BC subtype, N (%)
  HR+/HER2+                            5 (4.72)                  66 (62.26)                30 (28.30)              5 (4.72)      106 (100.00)
  HR−/HER2−                            6 (6.52)                  62 (67.39)                13 (14.13)              11 (11.96)    92 (100.00)
  HR−/HER2+                            0 (0.00)                  31 (62.00)                11 (22.00)              8 (16.00)     50 (100.00)
Graeser et al. Breast Cancer Research (2021) 23:36 Page 6 of 13
Table 2 Patient characteristics (US group) according to tumor size estimation and discordance between US and histology
Overestimation Difference Underestimation Unknown Total
US – Histol. > 10 mm US – Histol. ≤10 mm US – Histol. > 10 mm
Number of patients (% of total) 60 (10.20) 407 (69.22) 93 (15.82) 28 (4.76) 588 (100.00)
Age at initial visit [years]
Mean 53.13 51.16 52.89 52.46 51.70
SD 12.49 11.71 9.54 10.84 11.44
Median 50.00 51.00 53.00 50.00 51.00
Min 31.00 21.00 32.00 30.00 21.00
Max 75.00 77.00 78.00 74.00 78.00
N.d. 0 2 0 0 2
Central grade, N (%)
1 0 (0.00) 8 (80.00) 2 (20.00) 0 (0.00) 10 (100.00)
2 32 (13.60) 168 (71.19) 27 (11.44) 9 (3.81) 236 (100.00)
3 28 (8.26) 228 (67.26) 64 (18.88) 19 (5.60) 339 (100.00)
N.d. 0 (0.00) 3 (100.00) 0 (0.00) 0 (0.00) 3 (100.00)
Clinical baseline characteristics, N (%)
cT
1 15 (6.36) 196 (83.05) 14 (5.93) 11 (46.61) 236 (100.00)
2 35 (11.11) 196 (62.22) 68 (21.59) 16 (5.08) 315 (100.00)
3 7 (23.33) 12 (40.00) 10 (33.33) 1 (3.33) 30 (100.00)
4 3 (42.86) 3 (42.86) 1 (14.29) 0 (0.00) 7 (100.00)
cN
0 33 (7.97) 304 (73.43) 58 (14.01) 19 (4.59) 414 (100.00)
1 25 (16.23) 93 (60.39) 30 (19.48) 6 (3.90) 154 (100.00)
2 2 (10.53) 9 (47.37) 5 (26.32) 3 (15.79) 19 (100.00)
3 0 (0.00) 1 (100.00) 0 (0.00) 0 (0.00) 1 (100.00)
Menopausal status, N (%)
Premenopausal 31 (10.99) 199 (70.57) 38 (13.48) 14 (4.96) 282 (100.00)
Postmenopausal 28 (10.07) 189 (67.99) 49 (17.63) 12 (4.32) 278 (100.00)
Unknown/unclear 1 (3.57) 19 (67.86) 6 (21.43) 2 (7.14) 28 (100.00)
BC subtype, N (%)
HR+/HER2+ 28 (10.98) 187 (73.33) 31 (12.16) 9 (3.53) 255 (100.00)
HR−/HER2− 26 (10.44) 166 (66.67) 45 (18.07) 12 (4.82) 249 (100.00)
HR−/HER2+ 6 (7.14) 54 (64.29) 17 (20.24) 7 (8.33) 84 (100.00)
by > 10 mm in 10.2% (n = 60) and 15.8% of patients group, and in 171/174 patients with MRI and US). pCR
(n = 93), respectively. A similar proportion of HR+/ was achieved in 36.5% of patients in the MRI (n = 89/
HER2+ tumors had tumor size over- and underesti- 244), 37.7% in the US group (n = 218/578), and 37.4%
mation (11%, n = 28/255 and 12.2%, n = 31). However, (n = 64/171) in the MRI and US group. The sensitivity of
underestimation by US was more frequent than over- US and MRI was similar overall and in HR+/HER2+ tu-
estimation in the HR−/HER2− (18.1%, n = 45/249, vs mors while sensitivity was higher for US in HR−/HER2−
10.4%, n = 26) and in the HR−/HER2+ group (20.2%, tumors (0.89 vs 0.73 for MRI) and higher for MRI in HR
n = 17/84, vs 7.1%, n = 6/84). −/HER2+ tumors (0.96 vs 0.81 for US, Table 3). MRI
yielded a higher specificity than US in all tumors (0.69
Prediction of pCR and presence of residual tumor vs 0.46) and in HR+/HER2+ (0.56 vs 0.47), HR−/HER2−
Data on pCR was available in 815 patients (in 244/248 (0.71 vs 0.52), and HR−/HER2+ tumors (0.83 vs 0.33).
patients in the MRI group, in 578/588 patients in the US Overall, NPV was similar between MRI and US;Graeser et al. Breast Cancer Research (2021) 23:36 Page 7 of 13
Table 3 Prediction of pCR and residual tumor size in the MRI group and in the US group
Group pCR, N CR, N TN, FP, TP, FN, Specificity Sensitivity NPV (CL) PPV (CL)
N N N N (CL) (CL)
Overall MRI 89 84 61 28 132 23 0.69 0.85 0.73 0.83
(N = 244) (0.58–0.78) (0.79–0.90) (0.62–0.82) (0.76–0.88)
US 218 149 101 117 312 48 0.46 0.87 0.68 0.73
(N = 578) (0.40–0.53) (0.83–0.90) (0.60–0.75) (0.68–0.77)
HR+/ MRI 34 25 19 15 63 6 0.56 0.91 0.76 0.81
HER2+ (N = 103) (0.38–0.73) (0.82–0.97) (0.55–0.91) (0.70–0.89)
US 83 62 39 44 146 23 0.47 0.86 0.63 0.77
(N = 252) (0.36–0.58) (0.80–0.91) (0.50–0.75) (0.70–0.83)
HR MRI 31 38 22 9 44 15 0.71 0.73 0.58 0.83
−/HER2− (N = 91) (0.52–0.86) (0.60–0.84) (0.41–0.74) (0.70–0.92)
US 93 65 48 45 132 17 0.52 0.89 0.74 0.75
(N = 242) (0.41–0.62) (0.82–0.93) (0.62–0.84) (0.68–0.81)
HR MRI 24 21 20 4 25 1 0.83 0.96 0.95 0.86
−/HER2+ (N = 50) (0.63–0.95) (0.80–1) (0.76–1) (0.68–0.96)
US 42 22 14 28 34 8 0.33 0.81 0.64 0.55
(N = 84) (0.20–0.50) (0.66–0.91) (0.41–0.83) (0.42–0.68)
Group ≤10 mm at ≤10 mm at TN, FP, TP, FN, Specificity Sensitivity NPV (CL) PPV (CL)
histology, N imaging, N N N N N (CL) (CL)
Overall MRI 151 100 92 59 65 8 0.61 0.89 0.92 0.52
(N = 224) (0.53–0.69) (0.80–0.95) (0.85–0.96) (0.43–0.62)
US 353 306 253 100 154 53 0.72 0.74 0.83 0.61
(N = 560) (0.67–0.76) (0.68–0.80) (0.78–0.87) (0.54–0.67)
HR+/ MRI 61 30 27 34 37 3 0.44 0.93 0.90 0.52
HER2+ (N = 101) (0.32–0.58) (0.80–0.98) (0.74–0.98) (0.40–0.64)
US 142 138 106 36 72 32 0.75 0.69 0.77 0.67
(N = 246) (0.67–0.82) (0.59–0.78) (0.69–0.84) (0.57–0.75)
HR MRI 55 45 40 15 21 5 0.73 0.81 0.89 0.58
−/HER2− (N = 81) (0.59–0.84) (0.61–0.93) (0.76–0.96) (0.41–0.74)
US 156 124 107 49 64 17 0.69 0.79 0.86 0.57
(N = 237) (0.61–0.76) (0.69–0.87) (0.79–0.92) (0.47–0.66)
HR MRI 35 25 25 10 7 0 0.71 1 (0.59–1) 1 (0.86–1) 0.41
−/HER2+ (N = 42) (0.54–0.85) (0.18–0.67)
US 55 44 40 15 18 4 0.73 0.82 0.91 0.55
(N = 77) (0.59–0.84) (0.60–0.95) (0.78–0.98) (0.36–0.72)
TP, true-positive examination; FP, false-positive examination; TN, true-negative examination and FN; false-negative examination. For pCR, TN was defined as CR at
imaging and pCR, FP as no CR at imaging and pCR, TP as no CR at imaging and no pCR, and FN as CR at imaging and no pCR. For residual tumor at histology, TN
was defined as tumor size of ≤10 mm by imaging and equivalent tumor size at histology, FP was defined as tumor size of > 10 mm by imaging and tumor size of
≤10 mm at histology; TP was defined as tumor size of > 10 mm by imaging and equivalent tumor size at histology, and FN was defined as tumor size of ≤10 mm
by imaging and tumor size of > 10 mm at histology. PPV, positive predictive value, defined as P(P = 1|I = 1); NPV, negative predictive value, defined as P(P = 0|I = 0);
SENS, sensitivity, defined as P(I = 1|P = 1); SPEC, specificity, defined as P(I = 0|P = 0 where P(A|B) denotes the conditional probability of event A given that event B
has occurred. P = 1 denotes a residual invasive tumor size of > 10 mm at histology, and I = 1 denotes tumor size of > 10 mm at imaging; CL, exact 95% confidence
limits (Clopper-Pearson)
however, MRI had a higher NPV in HR+/HER2+ (0.76 (0.82 and 0.77). Comparable predictive values were ob-
vs 0.63) and HR−/HER2+ tumors (0.95 vs 0.64), while tained in the MRI and US group (Supplementary Table 1
US had a higher NPV in HR−/HER2− tumors (0.74 vs and Supplementary Figure 1).
0.58). MRI had a higher PPV than US in all tumors (0.83
vs 0.73) and in HR−/HER2+ BC (0.86 vs 0.55) while both Prediction of residual tumor size > 10 mm by MRI and US
methods had a similar PPV in HR+/HER2+ and HR US yielded a higher specificity than MRI overall (0.72 vs
−/HER2− tumors. 0.61) and in HR+/HER2+ tumors (0.75 vs 0.44) while
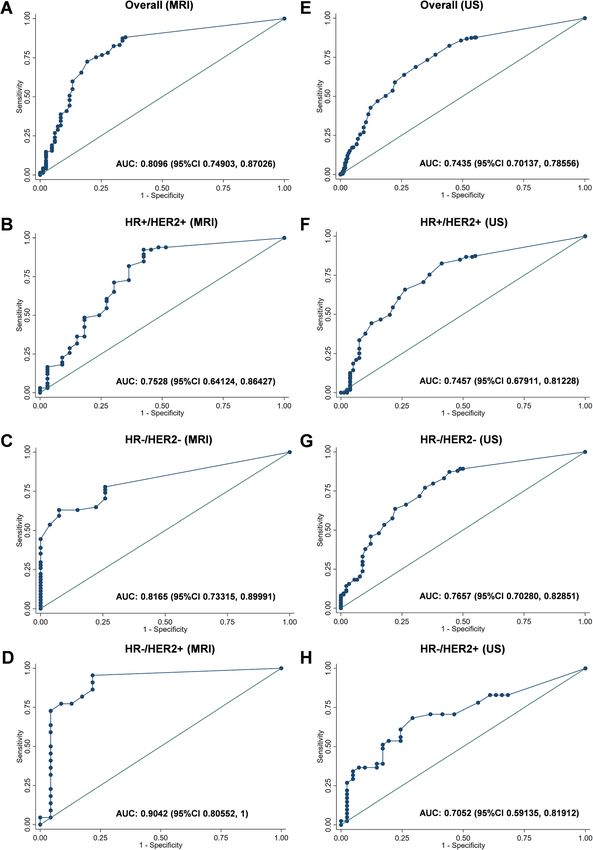
In the ROC analysis, MRI demonstrated a larger AUC both methods were comparable in HR−/HER2− and HR
than US in all tumors (0.80 vs 0.74) and in HR−/HER2+ −/HER2+ BC (Table 3). MRI demonstrated a higher sen-
BC (0.90 vs 0.71, Fig. 2). AUC was similar for MRI and sitivity and NPV than US among all tumors (sensitivity
US in HR+/HER2+ (0.75, both) and HR−/HER2− tumors 0.89 vs 0.74; NPV 0.92 vs 0.83) and in HR+/HER2+Graeser et al. Breast Cancer Research (2021) 23:36 Page 8 of 13 Fig. 2 ROC curves for detecting pCR by MRI (a–d) and by US (e–h). Data are shown for all tumors (a, e) and for patients with HR+/HER2+ (b, f), HR−/HER2− (c, g), and HR−/HER2+ (d, h) tumors
Graeser et al. Breast Cancer Research   (2021) 23:36                                                       Page 9 of 13

(sensitivity 0.93 vs 0.69; NPV 0.9 vs 0.77) and HR         fewer cases of non-pCR than US and appears to be a
−/HER2+ BC (sensitivity 1 vs 0.82; NPV 1 vs 0.91). MRI     method of choice particularly in HR−/HER2+ BC.
and US had similar sensitivity and NPV in HR−/HER2−        Nevertheless, other studies demonstrated a variable ac-
tumors. PPV was higher for US than for MRI in HR+/         curacy of MRI and US for residual disease prediction.
HER2+ (0.67 vs 0.52) and HR−/HER2+ BC (0.55 vs             For example, both US and MRI were shown to be more
0.41); both methods had a similar PPV overall and in       accurate for non-pCR prediction in HR+ than in HR−
HR−/HER2− tumors. In general, predictive values ob-        tumors [18]. Furthermore, Gampenrieder et al. found
tained in the MRI and US group were in line with the       that MRI correctly predicted non-pCR much less fre-
results obtained for the MRI group and US group (Sup-      quently in HR−/HER2+ than in HR+/HER2+ and HR
plementary Table 1).                                       −/HER2− tumors [16]. However, the number of patients
                                                           with HR−/HER2+ tumors was low in that study and in
Correlation in tumor size between imaging and              our analysis, which could impact the relative differences
histological assessment                                    in predictive values between this and other BC subtypes.
Spearman correlation coefficients between pathological       The evidence regarding the optimal imaging method
tumor size and measurements by MRI and US were 0.55        (MRI versus US) for the prediction of residual tumor
and 0.51 for all tumors, 0.43 and 0.51 for HR+/HER2+,      size after NAT is conflicting. Studies investigating the
0.67 and 0.53 for HR−/HER2−, and 0.61 and 0.43 for HR      correlation between tumor size by imaging and by hist-
−/HER2+ BC. Slightly lower correlation coefficients were   ology have reported discrepant results with some show-
obtained in patients with both imaging measurements        ing a higher accuracy for MRI vs US [4, 8, 19] and
(Supplementary Figure 2). Both MRI and US underesti-       others demonstrating a similar performance of both
mated and overestimated histological tumor size (Fig. 3,   methods [6, 18, 20]. In our study, the correlation be-
Supplementary Figure 3). There was a tendency towards      tween imaging measurement and final pathology size
underestimating tumor size in larger tumors which ap-      was similar in the analysis of all tumors. However, we
peared to be more pronounced for US than for MRI.          found that US measurements correlated with residual
                                                           tumor size more closely than MRI in HR+/HER2+ tu-
Discussion                                                 mors, whereas better correlation coefficients were ob-
The assessment of tumor response to NAT is of import-      tained with MRI than with US in HR−/HER2+ and
ance when planning surgery. In this study, we investi-     particularly in HR−/HER2− BC. Our results thus corrob-
gated post-NAT MRI and US for the prediction of pCR        orate available evidence suggesting that the correlation
and analyzed the accuracy of these methods in the deter-   between MRI-measured and histological tumor size is
mination of residual tumor size. We found that MRI         highest in HR−/HER2− tumors [21, 22]. However, in a
more often correctly predicted pCR in HR−/HER2+            study by Scheel et al., the correlation between tumor size
followed by HR+/HER2+ than in HR−/HER2− tumors.            estimated by MRI and final pathology measurement was
Conversely, US more frequently correctly predicted pCR     not affected by BC subtype [17]. Previously, MRI was
in HR−/HER2− tumors than in HR+/HER2+ and HR               shown to overestimate and US to underestimate residual
−/HER2+ BC, thus corroborating previously published        tumor size [6] while in other analyses, both methods
results [15]. This suggests that MRI may less reliably     demonstrated a similar degree of overestimation [23].
identify pCR in HR−/HER2− tumors and that assess-          According to the NPV values obtained in our study,
ment of tumor response to NAT should rather be per-        MRI more often than US correctly predicted the pres-
formed by US in this BC subtype. In contrast,              ence of residual tumors measuring 0–10 mm in HR+/
Gampenrieder and colleagues reported that MRI cor-         HER2+ and HR−/HER2+ tumors. Conversely, US was
rectly predicted pCR more often in HR−/HER2− and           superior to MRI in terms of correctly estimating the
HR−/HER2+ tumors than in HR+/HER2+ BC [16].                tumor size in lesions measuring > 10 mm in these BC
Moreover, Scheel et al. found no impact of BC subtype      subtypes (as demonstrated by PPV values). Therefore,
on the prediction of pCR by MRI in the ACRIN 6657/I-       our results imply that MRI confers a lower risk of under-
SPY trial [17].                                            estimating while US is less likely to overestimate residual
  In our study, residual disease was correctly predicted   tumor size in HR+/HER2+ and HR−/HER2+ BC. Com-
by US in 77% of HR+/HER2+ and 75% of HR−/HER2−             pared to our study, Vriens et al. reported slightly higher
tumors; however, this approach identified only 55% of      risks of underestimation and lower probability of over-
the cases of non-pCR in HR−/HER2+ BC. In contrast,         estimation of residual tumor size by MRI and US. They
MRI consistently displayed a high accuracy for the pre-    reported that MRI and US were less likely to underesti-
diction of residual tumor presence across all BC sub-      mate lesion size in HR− than in HR+ tumors measuring
types analyzed (81–86%) with the highest value obtained    0–10 mm (with results favoring US over MRI in this BC
in HR−/HER2+ tumors. This indicates that MRI misses        subtype, [18]). Conversely, the size of HR+ tumors in
Graeser et al. Breast Cancer Research (2021) 23:36 Page 10 of 13 Fig. 3 Difference between tumor size according to imaging and residual tumor size versus histological tumor size. Data are shown for all patients with MRI (a) and US (e) and for HR+/HER2+ (b, f), HR−/HER2− (c, g), and HR−/HER2+ tumors (d, h). Quadratic curve was fitted using the least- squares method; shaded areas represent the 95% confidence interval for fitted curves
Graeser et al. Breast Cancer Research   (2021) 23:36                                                                         Page 11 of 13

that study was less often overestimated than in HR− BC,        study did not provide an insight into the impact of ac-
particularly by US. Evaluation of residual disease by MRI      curacy in the prediction of residual tumor size on suc-
was previously shown to depend on tumor phenotype              cessful breast conservation and unnecessary mastectomy
with a lower rate of underestimation in solid tumors           rates.
positive for HER2, negative for HR, and triple-negative
subtype compared to HR+/HER2− tumors that fre-                 Conclusions
quently present as non-mass/diffuse enhancement [24,           Our study demonstrated that US and MRI were similarly
25]. Moreover, the extent of the response to NAT was           accurate in predicting the presence of residual tumor
proposed to affect the rates of overestimation by MRI          after NAT in HR+/HER2+ and HR−/HER2− BC while
[24]. The presence of enhancing tissue could be misin-         MRI was more predictive in HR−/HER2+ tumors. The
terpreted as a residual disease, particularly in HR            size of HR+/HER2+ and HR−/HER2+ tumors was less
−/HER2− tumors with fibrosis and inflammation-                 likely to be underestimated by MRI while US conferred
induced during the response to neoadjuvant chemother-          a lower risk of overestimation in these BC subtypes. The
apy thus leading to size overestimation. Furthermore,          risk of underestimating the size of HR−/HER2− tumors
treatment type could impact the imaging accuracy. For          was similarly low for both MRI and US. However, both
example, MRI may less accurately predict pCR after             methods were prone to overestimate the size of each BC
taxane-based therapy due to reduction of contrast en-          subtype, and particularly in HR−/HER2+ tumors. Our
hancement [26]. This limitation should be taken into           findings are clinically relevant for selecting the optimal
consideration in assessing the predictive value of MRI in      imaging modality, interpretation of imaging results, and
HR−/HER2− tumors. Moreover, given the heterogeneity            subsequent planning of the surgery in patients with in-
of NAT regimens in our combined analysis of three sub-         complete imaging response to NAT.
studies, the findings attributed to tumor subtypes may in
                                                               Abbreviations
fact be at least partly attributable to the therapy adminis-   BC: Breast cancer; EoT: End of treatment; ET: Endocrine therapy;
tered. The NPV values obtained here suggest that MRI           MRI: Magnetic resonance imaging; NAT: Neoadjuvant therapy; NPV: Negative
and US may underestimate the size of tumors measuring          predictive value; pCR: Pathological complete response; PPV: Positive
                                                               predictive value; T-DM1: Trastuzumab emtansine; TN: Triple-negative;
0–10 mm in 8% and 17% of cases, respectively. However,         US: Ultrasound
the PPV values indicate that the risk of tumor size over-
estimation by MRI and US is far greater and may affect         Supplementary Information
48% and 39% of cases, respectively. The highest risk of        The online version contains supplementary material available at https://doi.
tumor size overestimation was observed in HR−/HER2+            org/10.1186/s13058-021-01413-y.
BC in which as much as 59% and 45% of tumors may be
smaller in pathologic examination than on MRI and US,           Additional file 1: Table S1. Prediction of pCR and residual tumor size
                                                                in MRI and US group.
respectively. Inaccurate estimation of residual tumor size
                                                                Additional file 2: Figure S1. ROC curves for detecting pCR by MRI and
has implications for the success of the surgery. On the         US among patients with both imaging assessments. Data are shown for
one hand, overestimation may result in excessive resec-         all tumors (A) and for patients with HR+/HER2+ (B), HR-/HER2- (C) and
tion leading to poor cosmetic outcomes or even the de-          HR-/HER2+ (D) tumors.

cision for mastectomy instead of breast-conserving              Additional file 3: Figure S2. Correlation between tumor size by
                                                                imaging and pathological tumor size according to breast cancer subtype.
surgery. On the other hand, underestimation may lead            Data are shown for tumor size estimations by (A) MRI in all patients with
to excision with tumor-positive margins which may re-           MRI, (B) US in all patients with US, (C) MRI and (D) US in patients with
quire additional surgery or have a negative impact on           both MRI and US.

long-term outcomes.                                             Additional file 4: Figure S3. Difference between tumor size according
                                                                to imaging and residual tumor size versus residual tumor size. Data are
  Our study has some limitations. First, although the US        shown for all patients with both MRI and US (A) and for HR+/HER2+ (B),
was mandatory for tumor evaluation, not all patients            HR-/HER2- (C) and HR-/HER2+ tumors (D). Quadratic curve was fitted
could be included in this analysis due to missing data.         using the least squares method.

Moreover, both MRI and US were only performed in
174/662 patients which could influence the relative value      Acknowledgements
                                                               Medical writing and editorial support were provided by Lukasz Wujak, Lukasz
of these techniques for the prediction of pCR and re-          Wujak MedComms, Warsaw, Poland, and were funded by WSG GmbH,
sidual tumor size. Furthermore, although the central           Moenchengladbach, Germany.
reading radiologists were blinded to the US results, the
                                                               Authors’ contributions
study protocol did not prespecify that the gynecologists       MG participated in the conception and design of the study, collection and
should have been blinded to MRI results. Additionally,         assembly of the data, data analysis and interpretation, and manuscript
the quality of MRI image interpretation was ensured by         writing. SS participated in the conception and design of the study, collection
                                                               and assembly of the data, data analysis and interpretation, and manuscript
specialized central radiologists, however, the US was per-     writing. OG participated in the conception and design of the study,
formed and interpreted by site gynecologists. Lastly, our      collection and assembly of the data, data analysis and interpretation, and
Graeser et al. Breast Cancer Research (2021) 23:36 Page 12 of 13
manuscript writing. KS participated in the collection and assembly of the Celgene, Clinsol, Daiichi-Sankyo, Esai, Genomic Health, Glaxo Smith Kline,
data and manuscript writing. CH participated in the collection and assembly Hexal, Lilly, Medstrom Medical, MSD, Mundipharma, Nanostring, Novartis,
of the data and manuscript writing. LU participated in the collection and Odonate, Paxman, Palleos, Pfizer, Pierre Fabre, PumaBiotechnolgogy, Riemser,
assembly of the data and manuscript writing. AF participated in the Roche, Sandoz/Hexal, Seattle Genetics, Tesaro Bio, and Teva.
collection and assembly of the data. DRD participated in the collection and JA is an employee of Alcedis GmbH, Giessen, Germany.
assembly of the data and manuscript writing. RW participated in the SK has an ownership interest in WSG GmbH; served in consulting/advisory
conception and design of the study, data analysis and interpretation, and role for Roche, Genomic Health, Novartis, AstraZeneca, Amgen, Celgene,
manuscript writing. RC participated in the data analysis and interpretation, SOMATEX Medical Technologies, Daiichi Sankyo, pfm medical, Pfizer, MSD,
manuscript writing, and collection and assembly of the data and provided Lilly, and Sonoscape; and received travel support from Roche, Daiichi Sankyo,
study materials or patients. CE participated in the data analysis and and Sonoscope.
interpretation and manuscript writing. JA participated in the data analysis HF received honoraria and travel support and served in consulting/advisory
and interpretation and manuscript writing. HN participated in the collection role for Roche, Celgene.
and assembly of the data and manuscript writing. AP participated in the MB received honoraria from AstraZeneca, Exact Sciences, Novartis, Pfizer,
data analysis and interpretation and manuscript writing. SK participated in Roche, Teva, travel support from AstraZeneca, Celgene, Medac, Novartis, and
the data analysis and interpretation and provided study materials or patients. Roche and served in consulting/advisory role for AstraZeneca, Exact Sciences,
EMG participated in the collection and assembly of the data and data Novartis, Puma, and Roche.
analysis and interpretation. HF participated in the collection and assembly of BA received honoraria from Pfizer, Roche Pharma, Novartis Pharma,
the data and provided study materials or patients. MB participated in the AstraZeneca, Amgen, Tesaro Bio Germany, PharmaMar, and Eisei; served in
collection and assembly of the data and manuscript writing. JP participated consulting/advisory role for Novartis Pharma, Roche Pharma, Pfizer, and
in the data analysis and interpretation and provided study materials or Tesaro Bio; and received travel support from AstraZeneca, Amgen, Roche
patients. RS participated in the collection and assembly of the data. BA Pharma, Pfizer, Novartis Pharma, Tesaro Bio Germany, PharmaMar, and Eisei.
participated in the collection and assembly of the data and manuscript CKL has an ownership interest in Theraklion and Phaon Scientific; received
writing. CKL participated in the data analysis and interpretation and honoraria from Roche, AstraZeneca, Celgene, Novartis, Pfizer, Lilly, Hexal,
manuscript writing. NH participated in the conception and design of the Amgen, SonoScape, Pfizer, Novartis, Roche, Genomic Health, Amgen,
study, collection and assembly of data, data analysis and interpretation, and AstraZeneca, Riemser, Carl Zeiss MediTec, TEVA Pharmaceuticals Industries,
manuscript writing and provided study materials or patients. CKK Theraklion, Janssen-Cilag, GlaxoSmithKline, and LIV Pharma; served in consult-
participated in the conception and design of the study, collection and ing/advisory role for Roche, Novartis, Pfizer, Celgene, Phaon Scientific, Pfizer,
assembly of the data, data analysis and interpretation, and manuscript Novartis, SurgVision, CarlZeissMeditec, Amgen, and Onkowissen; received re-
writing. UN participated in the conception and design of the study, search funding from Roche, Novartis, and Pfizer; and received travel support
collection and assembly of data, data analysis and interpretation, manuscript from Roche, Daiichi Sankyo, Novartis, Carl Zeiss Meditec, LIV Pharma, Novartis,
writing, and administrative support and provided study materials or patients. Amgen, Pfizer, and Daiichi Sankyo.
All authors read and approved the final manuscript. NH has an ownership interest in WSG GmbH; received honoraria from
Amgen, AstraZeneca, Genomic Health, Novartis, Pfizer, Pierre Fabre, Roche,
Funding and Zodiac Pharma; served in consulting/advisory role for Agendia,
The analysis of MRI data presented in this manuscript was funded by Bayer AstraZeneca, Celgene, Daiichi Sankyo, Lilly, Merck Sharp & Dohme, Novartis,
AG Germany. ADAPT HER2+/HR+ and WSG-ADAPT HER2+/HR− trials were fi- Odonate Therapeutics, Pfizer, Pierre Fabre, Roche/Genentech, Sandoz, Seattle
nancially supported by Hoffmann la Roche; the WSG-ADAPT TN trial was fi- Genetics, and West German Study Group; and received research funding
nancially supported by Celgene and Teva. The industry sponsors of the from Lilly, Merck Sharp & Dohme, Novartis, Pfizer, and Roche/Genentech.
ADAPT trials had no role in the trial design, data collection, analysis, data in- CKK received honoraria from Bayer Healthcare.
terpretation, writing, or decision to submit the manuscript. Open Access UN has an ownership interest in WSG GmbH; received honoraria from
funding enabled and organized by Projekt DEAL. Agendia, Amgen, Celgene, Genomic Health, NanoString Technologies,
Novartis pharma SAS, Pfizer Pharmaceuticals Israel, Roche/Genentech, and
Availability of data and materials Teva; served in consulting/advisory role for Genomic Health and Roche;
Data used for this analysis are available upon reasonable request to the received research funding from Agendia, Amgen, Celgene, Genomic Health,
corresponding author. NanoString Technologies, Roche, and Sanofi; provided expert testimony for
Genomic Health; and received travel support from Genomic Health, Pfizer
Declarations Pharmaceuticals Israel, and Roche.
Ethics approval and consent to participate Author details
1
The ADAPT study was performed in accordance with the Declaration of West German Study Group, Ludwig-Weber-Strasse 15, 41061
Helsinki. The substudy protocols were approved by the Ethics Committee of Moenchengladbach, Germany. 2Ev. Hospital Bethesda, Breast Center
the Medical Faculty of the University of Cologne, Germany (approval Niederrhein, Ludwig-Weber-Strasse 15, 41061 Moenchengladbach, Germany.
3
number: 11-283), and national authorities. Written informed consent was ob- Department of Gynecology, University Medical Center Hamburg,
tained from each patient prior to study participation. Martinistrasse 52, 20251 Hamburg, Germany. 4Department of Diagnostic and
Interventional Radiology, Hospital of the University of Aachen, RWTH,
Pauwelsstrasse 30, 52074 Aachen, Germany. 5University Hospital Cologne,
Consent for publication
Kerpener Strasse 62, 50937 Cologne, Germany. 6Radiology, Burgstrasse 7,
Not applicable.
80331 Munich, Germany. 7Department of Diagnostic and Interventional
Radiology and Neuroradiology, University Hospital Essen, University
Competing interests Duisburg-Essen, Hufelandstrasse 55, 45147 Essen, Germany. 8Department of
MG received honoraria from AstraZeneca and travel support from Daiichi Radiology and Nuclear Medicine, Schleswig-Holstein University Hospital,
Sanyko. Campus Lübeck, Ratzeburger Allee 160, 23562 Lübeck, Germany.
OG has an ownership interest in WSG GmbH; received honoraria from 9
Department of Radiology, University Hospital, LMU Munich,
Genomic Health, Roche, Celgene, Pfizer, Novartis, NanoString Technologies, Marchioninistrasse. 15, 81377 Munich, Germany. 10Department of Gynecology
and AstraZeneca; served in consulting/advisory role for Celgene, Exact and Obstetrics, Breast Center, University of Munich (LMU) and CCCLMU,
Sciences, Lilly, MSD Brazil, Novartis pharma SAS, Pfizer Pharmaceuticals Israel, Marchioninistrasse 15, 81377 Munich, Germany. 11Medizinisches
and Roche; and received travel support from Roche. Versorgungszentrum Radiologie Rhein-Sieg, GFO Kliniken Troisdorf,
LU received honoraria, travel support and served in consulting/advisory role Hospitalstrasse 45, 53840 Troisdorf, Germany. 12Alcedis GmbH,
for Siemens Healthcare, Bayer Healthcare, and received research funding Winchesterstrasse 3, 35394 Giessen, Germany. 13Department of Radiology,
from Siemens Healthcare. Clinics Essen-Mitte, Breast Centre, Henricistrasse 92, 45136 Essen, Germany.
RW served in consulting/advisory role and received travel support from 14
Clinics Essen-Mitte, Breast Centre, Henricistrasse 92, 45136 Essen, Germany.
Agendia, Amgen, Aristo, AstraZeneca, Boeringer Ingelheim, Carl Zeiss,Graeser et al. Breast Cancer Research (2021) 23:36 Page 13 of 13
15
University Hospital Charité, Women’s Clinic, Berlin, Charitéplatz 1, 10117 14. Breast Imaging Reporting & Data System | American College of Radiology.
Berlin, Germany. 16University Clinic Tuebingen, Women’s Clinic, Calwerstrasse ACR BI-RADS Atlas® 5th Edition. https://www.acr.org/Clinical-Resources/
7, 72076 Tuebingen, Germany. 17Practice Network Troisdorf, Schlossstrasse Reporting-and-Data-Systems/Bi-Rads#MRI [Internet].
18, 53840 Troisdorf, Germany. 18Red Cross Women’s Hospital, 15. Baumgartner A, Tausch C, Hosch S, Papassotiropoulos B, Varga Z, Rageth C,
Nymphenburger Strasse 163, 80634 Munich, Germany. 19Ev. et al. Ultrasound-based prediction of pathologic response to neoadjuvant
Waldkrankenhaus Berlin, Stadtrandstrasse 555, 13589 Berlin, Germany. chemotherapy in breast cancer patients. Breast. 2018;39:19–23.
20
Department of Gynecology and Obstetrics, University Hospital Essen, 16. Gampenrieder SP, Peer A, Weismann C, Meissnitzer M, Rinnerthaler G,
Hufelandstrasse 55, 45147 Essen, Germany. 21Department of Gynecology, Webhofer J, et al. Radiologic complete response (rCR) in contrast-enhanced
University Hospital Leipzig, Liebeigstrasse 20A, 04103 Leipzig, Germany. magnetic resonance imaging (CE-MRI) after neoadjuvant chemotherapy for
early breast cancer predicts recurrence-free survival but not pathologic
Received: 30 July 2020 Accepted: 24 February 2021 complete response (pCR). Breast Cancer Res. 2019;21(1):19.
17. Scheel JR, Kim E, Partridge SC, Lehman CD, Rosen MA, Bernreuter WK, et al.
MRI, clinical examination, and mammography for preoperative assessment
of residual disease and pathologic complete response after neoadjuvant
References chemotherapy for breast cancer: ACRIN 6657 trial. Am J Roentgenol. 2018;
1. Arnaout A, Lee J, Gelmon K, Poirier B, Lu FI, Akra M, et al. Neoadjuvant 210(6):1376–85.
therapy for breast cancer: updates and proceedings from the seventh 18. Vriens BEPJ, De Vries B, Lobbes MBI, Van Gastel SM, Van Den Berkmortel
annual meeting of the Canadian Consortium for Locally Advanced Breast FWPJ, Smilde TJ, et al. Ultrasound is at least as good as magnetic resonance
Cancer. Curr Oncol. 2018;25(5):e490. imaging in predicting tumour size post-neoadjuvant chemotherapy in
2. Maur M, Guarneri V, Frassoldati A, Conte PF. Primary systemic therapy in breast cancer. Eur J Cancer. 2016;52:67–76.
operable breast cancer: clinical data and biological fall-out. Ann Oncol. 19. Segara D, Krop IE, Garber JE, Winer E, Harris L, Bellon JR, et al. Does MRI
2006;17(SUPPL. 5):158–64. predict pathologic tumor response in women with breast cancer
3. Untch M, Konecny GE, Paepke S, von Minckwitz G. Current and future role undergoing preoperative chemotherapy? J Surg Oncol. 2007;96(6):474–80.
of neoadjuvant therapy for breast cancer. Breast. 2014;23(5):526–37. 20. Guarneri V, Pecchi A, Piacentini F, Barbieri E, Dieci MV, Ficarra G, et al.
4. Yeh E, Slanetz P, Kopans DB, Rafferty E, Georgian-Smith D, Moy L, et al. Magnetic resonance imaging and ultrasonography in predicting infiltrating
Prospective comparison of mammography, sonography, and MRI in patients residual disease after preoperative chemotherapy in stage II-III breast cancer.
undergoing neoadjuvant chemotherapy for palpable breast cancer. Am J Ann Surg Oncol. 2011;18(8):2150–7.
Roentgenol. 2005;184(3):868–77. 21. Moon HG, Han W, Lee JW, Ko E, Kim EK, Yu JH, et al. Age and HER2
5. Croshaw R, Shapiro-Wright H, Svensson E, Erb K, Julian T. Accuracy of expression status affect MRI accuracy in predicting residual tumor extent
clinical examination, digital mammogram, ultrasound, and MRI in after neo-adjuvant systemic treatment. Ann Oncol. 2009;20(4):636–41.
determining postneoadjuvant pathologic tumor response in operable 22. Nakahara H, Yasuda Y, Machida E, Maeda Y, Furusawa H, Komaki K, et al. MR
breast cancer patients. Ann Surg Oncol. 2011;18(11):3160–3. and US imaging for breast cancer patients who underwent conservation
surgery after neoadjuvant chemotherapy: comparison of triple negative
6. Marinovich ML, Macaskill P, Irwig L, Sardanelli F, Mamounas E, von
breast cancer and other intrinsic subtypes. Breast Cancer. 2011;18(3):152–60.
Minckwitz G, et al. Agreement between MRI and pathologic breast tumor
23. Marinovich ML, Macaskill P, Irwig L, Sardanelli F, Von Minckwitz G,
size after neoadjuvant chemotherapy, and comparison with alternative tests:
Mamounas E, et al. Meta-analysis of agreement between MRI and
individual patient data meta-analysis. BMC Cancer. 2015;15(1). https://doi.
pathologic breast tumour size after neoadjuvant chemotherapy. Br J Cancer.
org/10.1186/s12885-015-1664-4.
2013;109(6):1528–36.
7. Marinovich ML, Houssami N, MacAskill P, Sardanelli F, Irwig L,
24. Chen JH, Bahri S, Mehta RS, Carpenter PM, McLaren CE, Chen WP, et al.
Mamounas EP, et al. Meta-analysis of magnetic resonance imaging in
Impact of factors affecting the residual tumor size diagnosed by MRI
detecting residual breast cancer after neoadjuvant therapy. J Natl
following neoadjuvant chemotherapy in comparison to pathology. J Surg
Cancer Inst. 2013;105(5):321–33.
Oncol. 2014;109(2):158–67.
8. Lobbes MBI, Prevos R, Smidt M, Tjan-Heijnen VCG, van Goethem M,
25. Mukhtar RA, Yau C, Rosen M, Tandon VJ, Hylton N, Esserman LJ. Clinically
Schipper R, et al. The role of magnetic resonance imaging in assessing
meaningful tumor reduction rates vary by prechemotherapy MRI phenotype
residual disease and pathologic complete response in breast cancer
and tumor subtype in the I-SPY 1 TRIAL (CALGB 150007/150012; ACRIN
patients receiving neoadjuvant chemotherapy: a systematic review. Insights
6657). Ann Surg Oncol. 2013;20(12):3823–30.
Imaging. 2013;4(2):163–75.
26. Denis F, Desbiez-Bourcier AV, Chapiron C, Arbion F, Body G, Brunereau L.
9. Haraldsdóttir KH, Jónsson, Halldórsdóttir AB, Tranberg KG, Ásgeirsson KS.
Contrast enhanced magnetic resonance imaging underestimates residual
Tumor size of invasive breast cancer on magnetic resonance imaging and
disease following neoadjuvant docetaxel based chemotherapy for breast
conventional imaging (mammogram/ultrasound): comparison with
cancer. Eur J Surg Oncol. 2004;30(10):1069–76.
pathological size and clinical implications. Scand J Surg. 2017;106(1):68–73.
10. Nitz UA, Gluz O, Christgen M, Grischke EM, Augustin D, Kuemmel S,
et al. De-escalation strategies in HER2-positive early breast cancer (EBC): Publisher’s Note
final analysis of the WSG-ADAPT HER2+/HR- phase II trial: efficacy, Springer Nature remains neutral with regard to jurisdictional claims in
safety, and predictive markers for 12 weeks of neoadjuvant dual published maps and institutional affiliations.
blockade with trastuzumab and pertuzumab ± weekly pacl. Ann Oncol.
2017;28(11):2768–72.
11. Gluz O, Nitz U, Liedtke C, Christgen M, Grischke EM, Forstbauer H, et al.
Comparison of neoadjuvant Nab-paclitaxel1carboplatin vs nab-
paclitaxel1gemcitabine in triple-negative breast cancer: randomized WSG-
ADAPT-TN trial results. J Natl Cancer Inst. 2018;110(6):628–37.
12. Hofmann D, Nitz U, Gluz O, Kates RE, Schinkoethe T, Staib P, et al. WSG
ADAPT - adjuvant dynamic marker-adjusted personalized therapy trial
optimizing risk assessment and therapy response prediction in early breast
cancer: Study protocol for a prospective, multi-center, controlled, non-
blinded, randomized, investigator in. Trials. 2013;14(1). https://doi.org/10.11
86/1745-6215-14-261.
13. Harbeck N, Gluz O, Christgen M, Kates RE, Braun M, Küemmel S, et al. De-
escalation strategies in human epidermal growth factor receptor 2 (HER2)–
positive early breast cancer (BC): final analysis of the West German Study
Group adjuvant dynamic marker-adjusted personalized therapy trial
optimizing risk assessment and therapy. J Clin Oncol. 2017;35(26):3046–54.You can also read