In-Vivo Functional and Structural Retinal Imaging Using Multiwavelength Photoacoustic Remote Sensing Microscopy and Optical Coherence Tomography
←
→
Page content transcription
If your browser does not render page correctly, please read the page content below
In-Vivo Functional and Structural Retinal Imaging Using Multiwavelength Photoacoustic Remote Sensing Microscopy and Optical Coherence Tomography Zohreh Hosseinaee University of Waterloo Nicholas Pellegrino University of Waterloo Nima Abbasi University of Waterloo Tara Amiri University of Waterloo James A. Tummon Simmons University of Waterloo Paul Fieguth University of Waterloo Parsin Haji Reza ( phajireza@uwaterloo.ca ) University of Waterloo Research Article Keywords: retinal imaging, multiwavelength, photoacoustic remote, microscopy Posted Date: September 24th, 2021 DOI: https://doi.org/10.21203/rs.3.rs-921966/v1 License: This work is licensed under a Creative Commons Attribution 4.0 International License. Read Full License
In-vivo functional and structural retinal imaging using multiwavelength photoacoustic remote
 sensing microscopy and optical coherence tomography

Zohreh Hosseinaee 1, Nicholas Pellegrino1, Nima Abbasi 1, Tara Amiri1, James A. Tummon Simmons1,

 Paul Fieguth2, Parsin Haji Reza 1*

 1. PhotoMedicine Labs, Department of System Design Engineering, University of Waterloo, 200
 University Ave W, Waterloo, ON, N2L 3G1, Canada
 2. Department of System Design Engineering, University of Waterloo, 200 University Ave W,
 Waterloo, ON, N2L 3G1, Canada
 *Email: phajireza@uwaterloo.ca

 1
Abstract.

 A multiwavelength photoacoustic remote sensing (PARS) microscope is combined with swept-

 source optical coherence tomography and applied to in-vivo, non-contact retinal imaging. Building

 on the proven strength of multiwavelength PARS imaging, the system is applied for estimating retinal

 oxygen saturation in the rat eye. The capability of the technology is demonstrated by imaging both

 microanatomy and the microvasculature of the retina in-vivo. To our knowledge, this is the first time

 a non-contact photoacoustic imaging technique is employed for in-vivo oxygen saturation

 measurement in the retina.

1. Introduction

Functional imaging techniques enable measuring alterations in biological function including metabolism,

blood flow, regional chemical composition, and biochemical processes. These methods promise to

dramatically improve the ability to study in-situ biochemistry and disease pathology1. In ophthalmology,

functional changes most often precede structural changes in major eye diseases. Detecting these

alterations aids in understanding pathogenesis, early diagnosis, and timely management of ophthalmic

disorders [2]. Retinal oxygen saturation (SO2) and metabolic rate of oxygen consumption (MRO2) are

among the most important biomarkers characterizing the pathophysiological status of the posterior eye.

Additionally, abnormal retinal SO2 levels are believed to be involved in major eye diseases such as
 2–4
diabetic retinopathy (DR) and age-related macular degeneration (AMD) . Therefore, the precise

measurement of retinal oxygen saturation can be critical in investigating these blinding diseases.

Additionally, since the retinal arterioles are derived from the central nervous system. Presuming the

retinal arterial oxygen content is identical to the systemic circulation, retinal oximetry may provide

relevant information on oxygen delivery to the central nervous system. Therefore, determination of

oxygen saturation in the retinal vessels could enhance the monitoring and treatment of critically ill

patients in the intensive care units5. Oxygen-sensitive electrodes and magnetic resonance imaging have

 2
been used to measure retinal SO2, however these methods are usually restricted to terminal experiments

and/or limited by low spatial resolution3,6. Phosphorescence lifetime imaging has been also applied to

map ocular oxygenation in animal models. Unfortunately, the need to inject fluorescent probes into

systematic circulation makes the method inappropriate for human practice7.

Recently, researchers are focused on optical imaging-based methods to evaluate retinal oxygenation.

Optical imaging methods are capable of non-invasive SO2 measurement and they can visualize the spatial

distribution of oxygenation with high resolution in ocular environment8. Optical measurement of SO2 is

possible because the two forms of hemoglobin, oxy- and deoxyhemoglobin (HbO2 and Hb), have distinct

optical absorption properties. Owing to the differences in the absorption spectra of oxy- and

deoxyhemoglobin, multi-wavelength imaging methods can assess the SO2 in retinal vessels9. Currently

available optical imaging modalities, such as fundus photography10, scanning laser ophthalmoscope

(SLO) 11, and optical coherence tomography (OCT) 12–14 are scattering based techniques and rely on the

back-scattered light from the tissue to form an image. Despite the great progress in these optical imaging

techniques, however, they use indirect methods to measure optical absorption. Therefore, the accuracy

of these methods is affected by factors such as variation in vessel size15, pigmentation16, multiple light

paths17, and vessel wall thickness9. For example, in larger vessels the amount of detected backscattered

light is much greater than in small vessels17, hence the calculation of the optical density and SO2 values

can be affected in clinical trials18,19. Additionally, it is shown that SO2 variations, induce changes in

vessel diameter9, which may further alter the amount of backscattered light from the vessel and

consequently the SO2 measurements.

Photoacoustic microscopy (PAM), has the unique capability to map the direct optical absorption

properties with high resolution in biological tissues20. The modality has the potential to overcome the

limitations of current ocular imaging methods in functional studies21. It has been shown in simulation

studies that by increasing the vessel diameter and melanin concentration, the relative error of SO2
 3
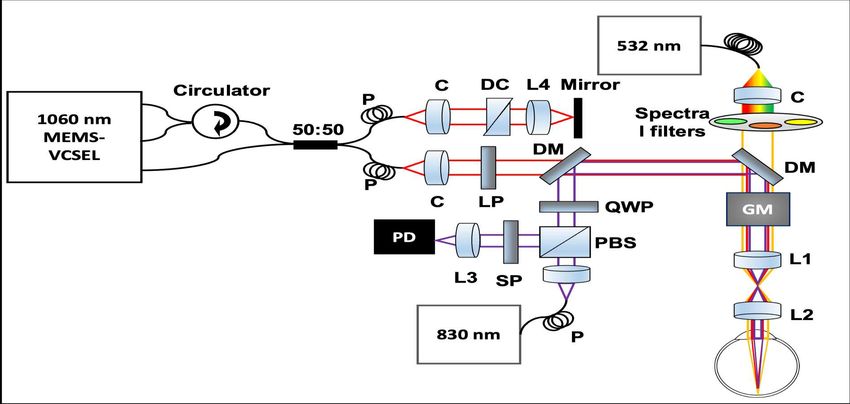
measurement in the scattering-based method increases. However, the SO2 measurement was insensitive

to these parameters in PAM 18. As these results suggest, PAM can be potentially a more accurate tool in

quantifying retinal SO2. However, the disadvantage of PAM in ophthalmic imaging arises from its need

to be in contact with the ocular tissue22. This physical contact may increase the risk of infection and may

cause patient discomfort. Additionally, it applies pressure to the eye and introduces barriers to oxygen

diffusion and alter physiological and pathophysiological balance of ocular vasculature function 8.

Additionally, the use of ultrasonic signal detection scheme poses challenges in combining the technology

with other imaging modalities22.

Recently our group at PhotoMedicine Labs for the first time demonstrated non-contact photoacoustic

imaging of the ocular tissue in murine eye using photoacoustic remote sensing (PARS) microscopy23.

Later we combined the technology with OCT and applied it for in-vivo non-contact imaging of the

anterior segment in the mouse eye8. We showed the potential of the system for estimation oxygen

saturation in the iris vasculature and visualizing melanin content in the RPE. Building on the proven

strength of PARS imaging, we further developed the technology to address the aforementioned need in

retinal oximetry. In this paper we report our latest progress on in-vivo retinal imaging and present the

capability of the reported non-contact multimodal imaging system for visualizing structural and

functional information of the rodent retina. To our knowledge, this is the first time a non-contact

photoacoustic imaging technique is applied for measuring oxygen saturation in the living retina. This

reported work has the potential to advance the diagnosis and treatment of major retinal disorders.

2. Method

2.1. System architecture

Figure demonstrates the experimental setup of the multimodal PARS-OCT system. Briefly, the output

beam of a 532-nm, ytterbium-doped laser (IPG Photonics) with 1.5 ns pulse-width is coupled to a single

mode optical fiber. At the output end of the fiber multiwavelength spectral peaks are generated through
 4
stimulated Raman scattering (SRS). SRS efficiency could be affected by temperature and airflow

changes, and random errors and drift in pulse energy24. To improve the stability of the SRS peaks, the

fiber was kept in a temperature-controlled unit to isolate the airflow and the temperature25. The laser

output was collimated into 2.1 mm diameter, then merged with the PARS probe beam centered at 830

(SLD830S-A20, Thorlabs) and the light of SS-OCT (center wavelength: 1060 nm; 100 nm spectral

bandwidth, 60 kHz swept rate, Thorlabs). A two-dimensional galvanometer scanned the combined light

beams (GVS012/M, Thorlabs) and relayed them to the eye through a telescopic lens (50:30 ratio) system.

The pivot point of the telecentric pair is properly positioned to relay the galvanometer mirrors onto the

entrance pupil of the eye, thereby minimizing vignetting. In PARS, pressure waves induced by light

absorption were detected by the probe beam. The back-reflected light from the retina is directed towards

the detection path. The quarter wave-plate transforms the reflected circularly polarized light back to

linearly polarized light, which enables the polarized beam splitter to direct the back-reflected light

towards the photodiode. The photodiode outputs are connected to a high-speed digitizer (CSE1442, Gage

Applied, Lockport, IL, USA) that performs analog to digital signal conversion. In SS-OCT, backscattered

light from the retina first interfered with the reference arm beam, then detected by the built-in dual

balanced photodetector. The OCT signal was digitized by a high-speed A/D card (ATS9351, Alazar

Technologies Inc., Pointe-Claire, QC, Canada). The raw OCT data was transmitted to a host computer

through a PCI‐Express interface. OCT system control was implemented in MATLAB platform to

automatically control all the operations including system calibration, galvo‐scanning, system

synchronization, real‐time imaging preview and data acquisition. The lateral resolutions of both PARS

and SS-OCT were around ~ 6 m in the retina with a slight difference caused by the different spectral

ranges. The axial resolutions of PARS and OCT were ~40 m and ~7.3 m, respectively.

 5
Figure 1. Simplified schematic of the multimodal PARS-OCT system. DM: Dichroic mirror, QWP:
Quarter wave plate, PBS: Polarized beam splitter, LP: Long pass filter, GM: Galvanometer mirrors, L:
Lens, C: Collimator, PD: Photodiode. DC: Dispersion compensation, P: Polarization controller.
2.2. Image reconstruction

All the PARS images shown in this manuscript were formed using a maximum amplitude projection

(MAP) of each A-scan for each pixel of the en-face image. The images were produced by direct plotting

from interpolated raw data using a Delaunay triangulation interpolation algorithm26. All images and

signal processing steps were performed in the MATLAB environment.

For each OCT data set, 500 A‐lines were acquired for each B‐scan. For each A‐line trigger, 2448

sampling points were acquired to cover the resultant spectral interferogram, providing a depth ranging

distance of ∼ 12 mm. To extract the OCT complex data, reference spectrum was subtracted from the

interference signal to remove DC bias, then Fourier transform was performed to extract the depth‐

resolved OCT signal. Images were generated from the raw OCT data and numerically dispersion

 6
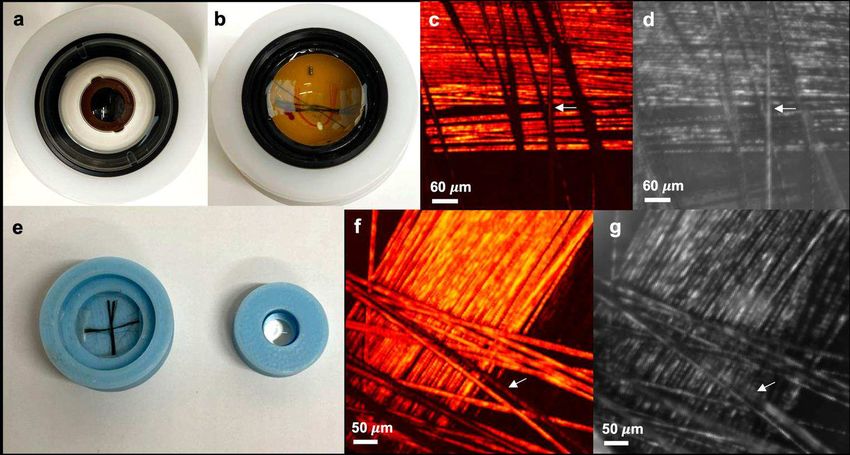
compensated up to the 5th order with a custom MATLAB algorithm27. No additional image post-

processing was used for the OCT images presented in this paper. The volumetric and en-face images

were generated from the 3D data sets with ImageJ28.

2.3. Animal preparation

All the experimental procedures were carried out in conformity with the laboratory animal protocol

approved by the Research Ethics Committee at the University of Waterloo and adhered to the ARVO

statement for use of animals in ophthalmic and vision research. All sections of this report adhere to the

ARRIVE Guidelines for reporting animal research. Albino rats (NU/NU, Charles River, MA, USA) were

imaged to demonstrate the in-vivo capabilities of the system. A custom-made animal holder was used to

restrain the animal. The base of the animal holder was lined with a thermal pad to keep the animal body

temperature between 36° and 38°C. One drop 0.5% proparacaine hydrochloride (topical anesthetic;

Alcaine, Alcon, Mississauga, ON, Canada) was applied to the eye, followed by one drop of 0.5%

tropicamide (pupillary dilator; Alcon). Artificial tears were used frequently (~ every 2 minutes) to keep

the cornea hydrated. Vital signs, such as respiration rates, heart rates and body temperature were

monitored during the experiment.

3. Results and discussion

3.1. Phantom imaging

Initial calibration of the PARS sub-system was achieved through imaging phantom eye models. First, we

used a realistic human eye model to test the feasibility of PARS on the retina. The phantom is shown in

Figure 1a, and it was modified from a commercial product (OEM-7, Ocular Instruments, Bellevue, WA).

The model consists of the cornea, crystalline lens, aqueous humor, vitreous humor, and artificial retina.

Strings of 7 carbon fibers (CF) were placed at the bottom of the model where the artificial retina is

located (Figure 1b), and they were imaged using the PARS system. Figure 1c shows representative PARS

image acquired from CF at the back of the human eye model and Figure 1d shows corresponding image
 7
acquired using PARS scattering mechanism described in our previous report8. The PARS excitation and

PARS detection are co-aligned, so that the same fibers are in focus in both absorption and scattering

contrast images (white arrow).

Then a custom rat eye model was developed to help with the alignment of PARS excitation and detection

beam for in-vivo trials. The eye model consisted of a single achromatic lens (63-817; Edmund Optics,

Inc) with numerical aperture and curvature close to that of in the rat eye, and a custom 3D printed plastic

chamber. Strings of 7 carbon fibers were located at a fix distance from the lens (Figure 1e)
 29
corresponding to the focus of the lens and was approximately equal to the path length of a rat eye .

Representative images acquired using absorption and scattering contrast of PARS system are shown in

Figure 1f-g. Similar to the human eye model, the excitation and detection beams were co-aligned so that

the same CF are in focus in both images (white arrows).

Figure 1. Imaging phantom eye models for human and rat. uman eye model consisting of the cornea,
crystalline lens, aqueous humor, vitreous humor, and artificial retina (a). Strings of 7 μm carbon fibers
are placed at the bottom of the eye model (b). CF image acquired with PARS absorption mechanism (c).
CF image acquired using PARS scattering mechanism (d). Custom rat eye model consisting of a single
achromatic lens and a 3D printed plastic chamber and strings of carbon fibers (e). PARS absorption and
 8
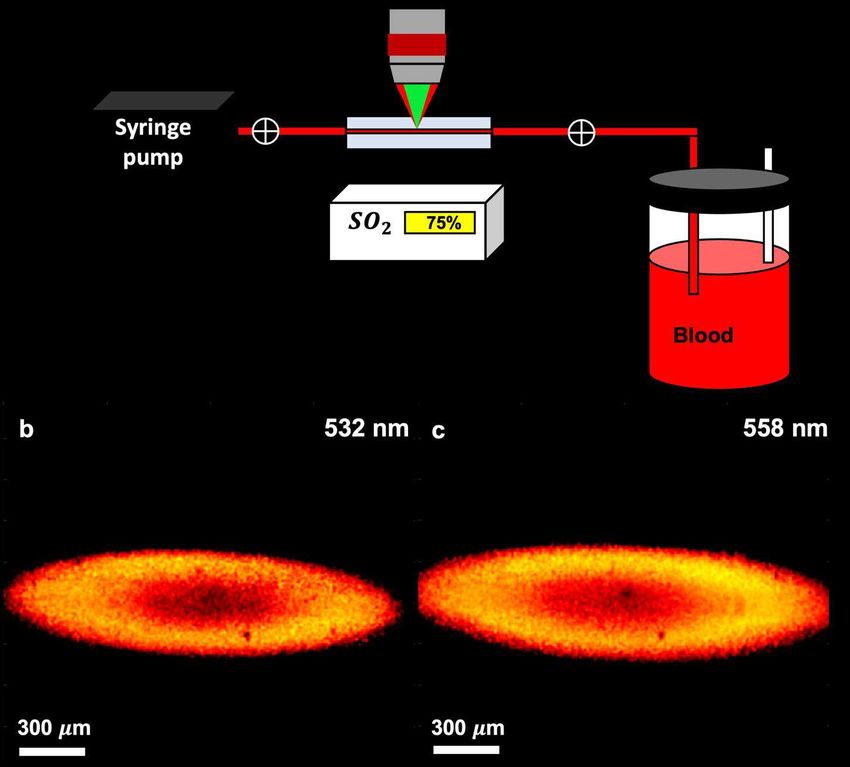
scattering contrast images, respectively (f-g). PARS excitation and detection beams are co-aligned so
that the same CF are in focus in both images (white arrows).
3.2. SO2 accuracy

The accuracy of the multiwavelength PARS sub-system in measuring oxygen saturation, was

investigated by performing in-vitro phantom experiments using freshly collected bovine blood with

Sodium Citrated anticoagulant solution. Figure 2a shows the experimental setup. The setup included a

blood reservoir, tubing, oxygen tank, oxygen meter access points and a syringe pump (NE-4000, New

Era Pump Systems, Inc.). Different levels of oxygen were delivered to the blood reservoir. Blood samples

were drawn before and after image acquisition for CO-oximetry measurements. A clinical grade CO-

oximeter (Avoximeter 4000, Instrumentation Laboratory LTD, Richmond Hill, Canada) served as a

reference device for measuring blood oxygen saturation.

Images of glass capillary with flowing blood, are acquired at 532 nm and 558 nm excitation wavelength

(Figure 2b-c). To estimate the SO2, representative signal values were extracted from the two images. It

is assumed that the SO2 is homogeneous within the capillary and the mean values are extracted.

Compared to the per-pixel basis estimation, the mean value method offers higher accuracy by reducing

the impact of random errors. Here, rather than averaging the signal intensity over the entire image, only

a sub-region where the target is adequately in-focus is used. The PARS signal intensity within the

selected region is averaged to arrive at a representative value associated with each excitation wavelength.

The relative concentrations of oxy- and deoxyhemoglobin and the corresponding SO2 value is then

calculated. The PARS measurements showed 40% and 60% oxygenation which were found to be within

6% accuracy with the oximeter results. The value is in the range reported by other photoacoustic imaging

studies 30,31, and approaches the ISO-defined acceptable performance criterion for oximeters (< 4%) 32.

To further improve the accuracy several factors can be considered in future works. For example,

nonlinear methods employing more than two optical wavelengths can be implemented to compensate for

the absorption saturation effect33. Furthermore, to reduce the effect of laser pulse energy fluctuations, a
 9
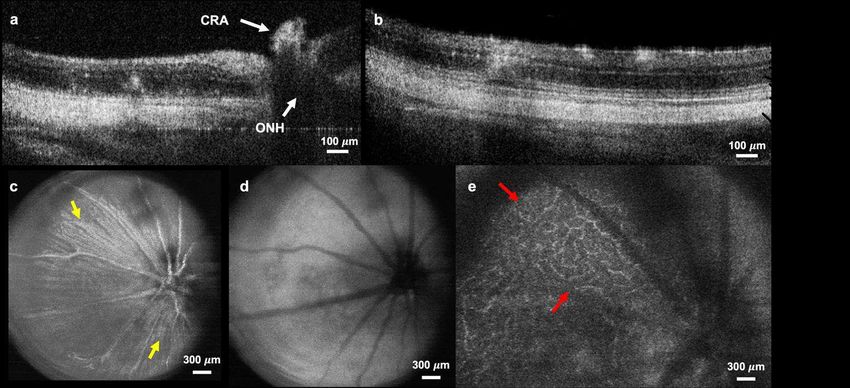
more stable tunable source can be employed and ultrashort switching time (a few hundred nanoseconds)

among wavelengths can be applied.

Figure 2. In-vitro bovine blood phantom experiment. Experimental setup of the experiment (a). Images
of glass capillary with flowing blood acquired at 532 nm and 558 nm excitation wavelengths, respectively
(b-c).
3.3 Retina imaging

First the capability of the SS-OCT system was tested on the rat retina, and it was used to guide the PARS

imaging system. Cross-sectional and volumetric OCT images of the rat retina are demonstrated in Figure

3. Each data set is acquired in ~10 seconds. Cross-sectional images enable visualization of major retinal
 10
layers. Retinal nerve fiber layer (NFL) and the retinal ganglion cell layer (GCL) form the innermost (top),

highly reflective band. Beneath this are the inner plexiform (IPL), inner nuclear (INL), outer plexiform

(OPL), and outer nuclear layer (ONL). In principle, those layers formed of nerve fibers, i.e., IPL and

OPL, show high-backscattering, whereas the nuclear layers have low-backscattering. The junction

between the inner segment and outer segment of the photoreceptors (I/OS PR) could be visualized, as

well as the highly reflective band which comprises the RPE (Figure 3b). In the OCT images central

retinal artery (CRA) remnant were also visible. (Figure 3a). OCT fundus views are also generated by

axially summing the merged OCT data set (Figure 3c-e). From the OCT fundus image, as shown in

Figure 3 (c), specific anatomy of the rat retina is visualized, including the optic nerve head, some large

retinal vessels and optic nerve fiber bundles as indicated by the yellow arrows. Figure 3e show the retinal

microvasculature in the deeper retinal layer (Red arrows).

Figure 3. Volumetric and cross-sectional OCT images. cross-sectional images acquired in-vivo from rat
retina showing distinct layers of the retina. NFL: nerve fiber layer, IPL: inner plexiform layer, INL: inner
nuclear layer, OPL: outer plexiform layer, ONL: Outer nuclear layer, IS/OS junction of inner segment
and outer segment layer. RPE retinal pigment epithelium layer, CH: choroid, CRA: central retinal artery,
ONH: optic nerve head (a-b). OCT fundus images visualizing optic nerve head, large retinal vessels,
optic nerve fiber bundle (yellow arrows), deeper retinal layer microvasculature (red arrows) (c-e).

 11
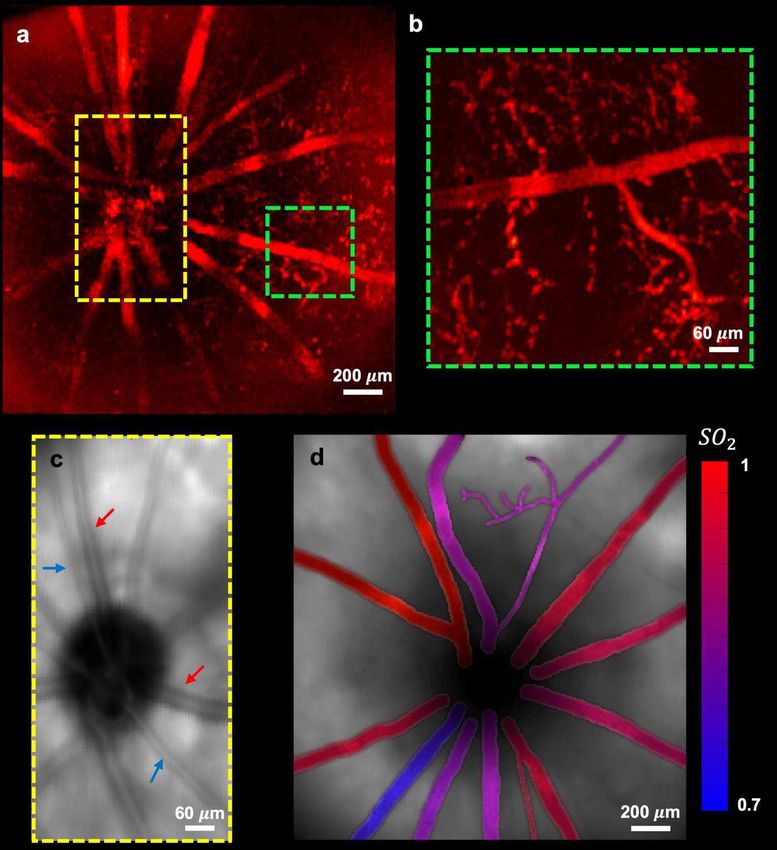
These high-definition structural information of the SS-OCT subsystem can be well complemented by

absorption based functional information obtained from PARS microscopy. The axial resolution of the

PARS system (~ 40 m), enables separating the signals of retinal blood vasculature from the RPE

melanin given the retina thickness of ~ 200 m17. As a result, PARS signals generated from major vessels

can be considered to be mainly from hemoglobin. Figure 4a demonstrates fundus PARS image acquired

from large vessels around ONH from a 2.6 mm × 2.6 mm area. Smaller vessels are also visible in the

image; however, they are slightly distorted by motion artifacts. Figure 4b shows a zoomed-in section of

one of the vessels acquired from a similar area where the smaller vasculature is more visible. In the

previous report of PARS-OCT system8, the PARS scattering contrast provided through the PARS

detection beam was introduced. In retinal imaging applications, this capability allows the PARS

microscope to be used the same way as fundus photography to image the interior surface of the eye.

Figure 4c, show a representative image acquired from the ONH using scattering contrast of the PARS

system. Since 830 nm beam used in the proposed architecture, has different absorption coefficient for

oxygenated and de-oxygenated hemoglobin (higher absorption for oxygenated hemoglobin); arteries

appear dark (red arrows), and veins are light (blue arrows) in the image. Therefore, the scattering contrast

of PARS microscope, can be used similar to retinal oximeters to measure oxygen saturation in the eye34.

Relying on the proven strength of the PARS sub-system in providing functional information, the

amplitude of multiwavelength PARS signals were employed to estimate SO2 in every vessel (Figure 4d).

The calculation is done based on the molecular extinction coefficients of HbO2 and Hb at 532 nm and

558 nm optical wavelengths. The rodent’s venous SO2 measured with PARS was around 70% which

agrees with previous reports 35. Despite the good match between measured SO2 by PARS and the preset

SO2 for blood experiments, the in-vivo rodent experiments conditions are different from those in in vitro

experiments. For example, there are eye movements during imaging, notable chromatic aberration from

the eyeball, etc. Whether such differences will affect the SO2 quantification or not require future

 12
validation 36,37. Additionally, it is reported that visual stimulus might increase the retinal vessel diameter

and blood flow, as well as affect the retinal SO2 due to retinal neurovascular coupling38. These factors

may affect the accuracy of the SO2 measurements, and they need further investigation in the future. To

our knowledge, this is the first report of optical absorption based retinal SO2 demonstrated in the fundus

view. It is important to note that PARS can provide two independent absorption contrast effect. First, is

the absorption contrast provided by the excitation laser. In this case, an isosbestic detection laser

wavelength can be used to only visualize the excitation effect. Finally, PARS detection laser can also act

as the secondary absorption contrast (Fig 5 c.). The combination of these two effects, which is unique to

PARS microscopy, can lead to more accurate measurements compared to current methods. This will be

investigated further in the future.

 13
Figure 4. PARS retinal imaging. Fundus PARS image acquired from large vessels around ONH from a
2.6 mm × 2.6 mm area (a). zoomed-in section of one of the vessels acquired from a similar area with
smaller vasculature (b). Fundus image acquired using scattering contrast of PARS system showing
arteries (red arrows) and veins (blue arrows) (c). Oxygen saturation map in the retina obtained using
multiwavelength PARS imaging (d).
3.4. Ocular light Safety

 14
Using ANSI standards, the ocular light safety for the developed multimodal PARS-OCT system can be

calculated39,40. First, the safety of PARS excitation laser is tested using the three ANSI rules: single pulse

limit, average power limit, and multiple pulse limit. The pulse duration for the IPG laser used in this

study is 1 = 1.5 . In the imaging setup, assuming that the collimated laser beam after being focused

by the eye has a maximum diameter of 20 on the retina, the angular subtense of the source:

 20
 = = 1.2 < = 1.5
 17

Where 17 mm is the focal length of human eye. Therefore, the light source can be considered as a point

source.

Rule 1 Since the pulse duration of the laser is 1.5 only the thermal effect needs to be considered and

the maximum permissible exposure (MPE) will be:

 = 5 × 10⁻⁷ / 2

Rule 2 Since the exposure time (~ 10 ) is longer than the 0.7 and the wavelength is between 400 and

600 nm, dual limits due to both thermal and photochemical effects apply here. For the photochemical

effect:

 ℎ = 4.36 × 10⁻² / 2

For the thermal effect:

 ℎ = 1.01 × 10⁻² / 2

Rule 3 tests whether an exposure by a long pulse of duration 1 is safe. Within a laser spot of 20 ,

there are at most two overlapping laser pulses (n = 2).

 = −0.25 × = 0.84 × 5 × 10−7 = 4.2 × 10⁻⁷ / 2

 15
Rule 3 is the most conservative of the three. Considering a pupil diameter of = 0.7 MPE for a

 2
single pulse would be equal to × ( ) × ≈ 160 . The acquired value is in correspondence
 2

to the values reported by other groups41,42. In this manuscript the energy of a single pulse is <

150 which is below the allowed pulse exposure limit.

For =380 – 1400 nm, a spectrally flat limit was recently introduced that recommends MP corneal

irradiances of 25t−0.75 W/cm2 for < 10 , ( = 10, = 4.4 W/cm2), and 4.0 W/cm2 for > 10 43.

Based on the proposed limit the OCT light power on the cornea ( ~1.5 ) and the PARS detection

power (~ 2 − 3 ) are well within the ANSI limits.

There are several aspects of the proposed system that can be further refined for future studies. The current

PARS-OCT system was developed using visible excitation wavelength for targeting oxygenated and de-

oxygenated hemoglobin in the blood. However, the laser safety threshold for ocular imaging is stricter

in the visible than in the NIR spectral range. Additionally, the retina is sensitive to the visible light which

poses challenges to eye fixation during imaging. Therefore, in future studies, the NIR spectral range can

be examined as the excitation wavelength to overcome these issues. Additionally, the oxygen saturation

measurement accuracy can be improved by using a more stable tunable light source and using nonlinear

methods. In future, the scanning pattern of the SS-OCT system can be modified to enable Doppler OCT

and OCT angiography and provide blood flow measurement and vasculature map, respectively. This

information can be further combined with the non-contact oxygen saturation measurements of PARS to

measure metabolic rate of oxygen consumption in the ocular environment in both small and large vessels.

The system can be further applied for evaluating the effects of visually evoked stimulus and how they

could change this functional information. It can also be used in longitudinal studies on larger animal

models like rabbit and monkeys with size of eyeballs closer to that of humans. Different eye disease

 16
models (such as Glaucoma, and DR) can be developed in these animals and the efficacy of the system be

evaluated in diagnosis and monitoring of them.

4. Conclusion

In conclusion, for the first time, a non-contact photoacoustic imaging technique was applied for in-vivo

measuring of retinal SO2. It was also the first time multimodal in-vivo imaging of retina was demonstrated

using multiwavelength PARS-OCT. The detailed structural information of OCT is well complemented

with absorption-based functional information of PARS imaging. The proposed method can be a measure

step toward non-invasive measurement of metabolic rate of oxygen consumption in retina, and it can

further improve the diagnosis and treatment of important eye diseases.

Acknowledgements:

The authors would like to thank Jean Flanagan for assistance with animal-related procedures. The authors

would also like to thank Kevan Bell, Benjamin Ecclestone for their support and help. The authors

acknowledge funding from New Frontiers in Research Fund – Exploration (NFRFE-2019-01012);

Natural Sciences and Engineering Research Council of Canada (DGECR-2019-00143, RGPIN2019-

06134); Canada Foundation for Innovation (JELF #38000); Mitacs (IT13594); Centre for Bioengineering

and Biotechnology (CBB Seed fund); University of Waterloo and illumiSonics (SRA #083181).

Additional Information

Conflict of interest:

Author P. Haji Reza has financial interests in illumiSonics Inc. IllumiSonics partially supported this

work. All other authors have no competing/conflict of interest.

References

 17
1. Chen, H., Rogalski, M. M. & Anker, J. N. Advances in functional X-ray imaging techniques and contrast

 agents. Phys Chem Chem Phys 14, 13469–13486 (2012).

2. Antonetti, D. A., Klein, R. & Gardner, T. W. Diabetic retinopathy. N Engl J Med 366, 1227–1239 (2012).

3. Wangsa-Wirawan, N. D. & Linsenmeier, R. A. Retinal oxygen: fundamental and clinical aspects. Arch

 Ophthalmol 121, 547–557 (2003).

4. Ciulla, Thomas A., Alon Harris, Hak S. Chung, Ronald P. Danis, Larry Kagemann, Lissa McNulty, Linda

 M. Pratt, and Bruce J. Martin. "Color Doppler imaging discloses reduced ocular blood flow velocities in

 nonexudative age-related macular degeneration." American journal of ophthalmology 128, no. 1 (1999): 75-

 80.

5. Eliasdottir, T. S. Retinal oximetry and systemic arterial oxygen levels. Acta Ophthalmol 96 Suppl A113, 1–

 44 (2018).

6. B. A. Berkowitz and C. A. Wilson, “Quantitative mapping of ocular oxygenation using magnetic resonance

 imaging,” Magn Reson Med, vol. 33, no. 4, pp. 579–581, Apr. 1995, doi: 10.1002/mrm.1910330419..

7. F inikova, Olga S., Artem Y. Lebedev, Alexey Aprelev, Thomas Troxler, Feng Gao, Carmen Garnacho,

 Silvia Muro, Robin M. Hochstrasser, and Sergei A. Vinogradov. "Oxygen microscopy by two-photon-

 excited phosphorescence." Chemphyschem: a European journal of chemical physics and physical

 chemistry 9, no. 12 (2008): 1673.

8. Z. Hosseinaee, Nima Abbasi, N. Pellegrino, L. Khalili, L. Mukhangaliyeva, and P. Haji Reza, “Functional

 and structural ophthalmic imaging using noncontact multimodal photoacoustic remote sensing microscopy

 and optical coherence tomography,” Sci Rep, vol. 11, no. 1, Art. no. 1, Jun. 2021, doi: 10.1038/s41598-021-

 90776-5.

9. Harris, A., Dinn, R. B., Kagemann, L. & Rechtman, E. A review of methods for human retinal oximetry.

 Ophthalmic Surg Lasers Imaging 34, 152–164 (2003).

10. Huang, Z. et al. Retinal choroidal vessel imaging based on multi-wavelength fundus imaging with the

 guidance of optical coherence tomography. Biomed. Opt. Express, BOE 11, 5212–5224 (2020).

11. Sharp, P. F., Manivannan, A., Xu, H. & Forrester, J. V. The scanning laser ophthalmoscope—a review of its

 role in bioscience and medicine. Phys. Med. Biol. 49, 1085–1096 (2004).
 18
12. Aumann, S., Donner, S., Fischer, J. & Müller, F. Optical Coherence Tomography (OCT): Principle and

 Technical Realization. in High Resolution Imaging in Microscopy and Ophthalmology: New Frontiers in

 Biomedical Optics (ed. Bille, J. F.) 59–85 (Springer International Publishing, 2019). doi:10.1007/978-3-030-

 16638-0_3.

13. Chen, C.-L. & Wang, R. K. Optical coherence tomography based angiography [Invited]. Biomed. Opt.

 Express, BOE 8, 1056–1082 (2017).

14. Drexler, W. & Fujimoto, J. G. Optical coherence tomography: technology and applications. (Springer

 Science & Business Media, 2008).

15. Buerk, D. G., Shonat, R. D., Riva, C. E. & Cranstoun, S. D. O2 gradients and countercurrent exchange in the

 cat vitreous humor near retinal arterioles and venules. Microvasc Res 45, 134–148 (1993).

16. Hammer, M., Vilser, W., Riemer, T. & Schweitzer, D. Retinal vessel oximetry-calibration, compensation for

 vessel diameter and fundus pigmentation, and reproducibility. J Biomed Opt 13, 054015 (2008).

17. Hammer, M., Leistritz, S., Leistritz, L. & Schweitzer, D. Light paths in retinal vessel oxymetry. IEEE Trans

 Biomed Eng 48, 592–598 (2001).

18. Liu, W., Jiao, S. & Zhang, H. F. Accuracy of retinal oximetry: a Monte Carlo investigation. J Biomed Opt

 18, 066003 (2013).

19. J iao, Shuliang, Minshan Jiang, Jianming Hu, Amani Fawzi, Qifa Zhou, K. Kirk Shung, Carmen A.

 Puliafito, and Hao F. Zhang. "Photoacoustic ophthalmoscopy for in vivo retinal imaging." Optics

 express 18, no. 4 (2010): 3967-3972.

20. Yao, J. & Wang, L. V. Sensitivity of photoacoustic microscopy. Photoacoustics 2, 87–101 (2014).

21. Z hang, Wei, Yanxiu Li, Yixin Yu, Katherine Derouin, Yu Qin, V. Phuc Nguyen, Xiaobo Xia, Xueding

 Wang, and Yannis M. Paulus. "Simultaneous photoacoustic microscopy, spectral-domain optical coherence

 tomography, and fluorescein microscopy multi-modality retinal imaging." Photoacoustics 20 (2020):

 100194.

22. Song, Wei, Qing Wei, Wenzhong Liu, Tan Liu, Ji Yi, Nader Sheibani, Amani A. Fawzi, Robert A.

 Linsenmeier, Shuliang Jiao, and Hao F. Zhang. "A combined method to quantify the retinal metabolic rate

 19
of oxygen using photoacoustic ophthalmoscopy and optical coherence tomography." Scientific reports 4, no.

 1 (2014): 1-7.

23. Z. Hosseinaee, L. Khalili, J. A. T. Simmons, K. Bell, K. Bell, and P. H. Reza, “Label-free, non-contact, in

 vivo ophthalmic imaging using photoacoustic remote sensing microscopy,” Opt. Lett., OL, vol. 45, no. 22,

 pp. 6254–6257, Nov. 2020, doi: 10.1364/OL.410171.

24. Liu, C., Chen, J., Zhang, Y., Zhu, J. & Wang, L. Five-wavelength optical-resolution photoacoustic

 microscopy of blood and lymphatic vessels. AP 3, 016002 (2021).

25. Hosseinaee, Zohreh, Benjamin Ecclestone, Nicholas Pellegrino, Layla Khalili, Lyazzat Mukhangaliyeva,

 Paul Fieguth, and Parsin Haji Reza. "Functional photoacoustic remote sensing microscopy using a stabilized

 temperature-regulated stimulated Raman scattering light source." Optics Express 29, no. 19 (2021): 29745-

 29754.

26. Chen, L. & Xu, J. OPTIMAL DELAUNAY TRIANGULATIONS. Journal of Computational Mathematics

 22, 299–308 (2004).

27. Cense, Barry, Nader A. Nassif, Teresa C. Chen, Mark C. Pierce, Seok-Hyun Yun, B. Hyle Park, Brett E.

 Bouma, Guillermo J. Tearney, and Johannes F. De Boer. "Ultrahigh-resolution high-speed retinal imaging

 using spectral-domain optical coherence tomography." Optics express 12, no. 11 (2004): 2435-2447.

28. Schneider, C. A., Rasband, W. S. & Eliceiri, K. W. NIH Image to ImageJ: 25 years of image analysis.

 Nature Methods 9, 671–675 (2012).

29. Lozano, D. C. & Twa, M. D. Development of a Rat Schematic Eye From In Vivo Biometry and the

 Correction of Lateral Magnification in SD-OCT Imaging. Invest. Ophthalmol. Vis. Sci. 54, 6446–6455

 (2013).

30. Gehrung, M., Bohndiek, S. E. & Brunker, J. Development of a blood oxygenation phantom for

 photoacoustic tomography combined with online pO2 detection and flow spectrometry. JBO 24, 121908

 (2019).

31. R. Bulsink, M. Kuniyil Ajith Singh, M. Xavierselvan, S. Mallidi, W. Steenbergen, and K. J. Francis,

 “Oxygen Saturation Imaging Using LED-Based Photoacoustic System,” Sensors (Basel), vol. 21, no. 1, p.

 283, Jan. 2021, doi: 10.3390/s21010283.
 20
32. ISO 80601-2-61:2017. ISO

33. Liu, C., Liang, Y. & Wang, L. Optical-resolution photoacoustic microscopy of oxygen saturation with

 nonlinear compensation. Biomed. Opt. Express 10, 3061 (2019).

34. Beach, J. Pathway to Retinal Oximetry. Transl Vis Sci Technol 3, 2 (2014).

35. Gray, L. H., and J. M. Steadman. "Determination of the oxyhaemoglobin dissociation curves for mouse and

 rat blood." The Journal of physiology 175, no. 2 (1964): 161-171.

36. Harmening, W. M., Tiruveedhula, P., Roorda, A. & Sincich, L. C. Measurement and correction of transverse

 chromatic offsets for multi-wavelength retinal microscopy in the living eye. Biomed Opt Express 3, 2066–

 2077 (2012).

37. Remtulla, S. & Hallett, P. E. A schematic eye for the mouse, and comparisons with the rat. Vision Res 25,

 21–31 (1985).

38. Radhakrishnan, H. & Srinivasan, V. J. Multiparametric optical coherence tomography imaging of the inner

 retinal hemodynamic response to visual stimulation. J Biomed Opt 18, 86010 (2013).

39. Delori, F. C., Webb, R. H. & Sliney, D. H. Maximum permissible exposures for ocular safety (ANSI 2000),

 with emphasis on ophthalmic devices. J. Opt. Soc. Am. A, JOSAA 24, 1250–1265 (2007).

40. ANSI Z136.1-2014: Safe Use of Lasers - ANSI Blog. The ANSI Blog https://blog.ansi.org/2015/07/ansi-

 z1361-2014-safe-use-of-lasers/ (2015).

41. Tian, C., Zhang, W., Mordovanakis, A., Wang, X. & Paulus, Y. M. Noninvasive chorioretinal imaging in

 living rabbits using integrated photoacoustic microscopy and optical coherence tomography. Opt. Express,

 OE 25, 15947–15955 (2017).

42. Liu, W. & Zhang, H. F. Photoacoustic imaging of the eye: A mini review. Photoacoustics 4, 112–123

 (2016).

43. Sliney, David, Danielle Aron-Rosa, Francois DeLori, Franz Fankhauser, Robert Landry, Martin Mainster,

 John Marshall et al. "Adjustment of guidelines for exposure of the eye to optical radiation from ocular

 instruments: statement from a task group of the International Commission on Non-Ionizing Radiation

 Protection (ICNIRP)." Applied optics 44, no. 11 (2005): 2162-2176

 21
Author Contributions:

Z.H. designed and constructed the PARS-OCT system, conducted the experiments, wrote the
main manuscript, and prepared the figures. N.P. developed and implemented the signal
unmixing method. N.A. constructed the software of the OCT system and helped with the
animal imaging experiments. T.A. helped with the SO2 accuracy study. J.A.T.S. helped with
the design of the rat retina phantom. P.F. contributed to the interpretation of the results and
provide guidance. P.H.R. conceived the project and acted as the primary investigator. All the
authors reviewed the manuscript.

 22
You can also read