ASSESSING THE EFFECTS OF COVID-19 ON ACCESS TO WATER, SANITATION, AND HYGIENE IN USAID HIGH PRIORITY AND STRATEGY-ALIGNED COUNTRIES - Tetra Tech
←
→
Page content transcription
If your browser does not render page correctly, please read the page content below
ASSESSING THE EFFECTS OF
COVID-19 ON ACCESS TO WATER,
SANITATION, AND HYGIENE IN
USAID HIGH PRIORITY AND
STRATEGY-ALIGNED COUNTRIES

Focus on Small Piped Providers in Ghana

JANUARY 2021

This publication was produced for review by the United States Agency for
International Development. It was prepared by Tetra Tech.
ACKNOWLEDGEMENTS
This task was managed by Rachel Peletz and Caroline Delaire (Aquaya), with conception and design by Jeff
Albert and Ranjiv Khush (Aquaya). Interviews and qualitative analysis were conducted by Jessie Press-
Williams and Bashiru Yachori of Aquaya-Ghana; Chloé Poulin and Brian Mwangi of Aquaya-Nairobi
conducted quantitative data analysis.
We extend our thanks to the national and district-level government officials in Ghana who generously offered
their time and insights. We are also grateful to the 29 rural water system operators who agreed to be
interviewed, as well as representatives of Global Communities, Safe Water Network, Water4, and World
Vision.
Finally, we thank Emmanuel Odotei of the USAID Mission in Accra for his support of this work, as well as
Ryan Mahoney, Elizabeth Jordan, Alison Macalady, Jesse Shapiro, and Brian Banks of USAID for the close and
enriching attention they have afforded the work over the course of its duration.

Prepared for the United States Agency for International Development by the Water, Sanitation, and Hygiene
Partnerships and Learning for Sustainability (WASHPaLS) project under Task Order number AID-OAA-TO-
16-00016 of the Water and Development Indefinite Delivery Indefinite Quantity Contract (WADI), contract
number AID-OAA-I-14-00068.

Tetra Tech Contacts:             Morris Israel, Project Director
                                 morris.israel@washpals.org
                                 Jeff Albert, Deputy Project Director
                                 jeff.albert@washpals.org
                                 Lucia Henry, Project Manager
                                 lucia.henry@tetratech.com

                                 Tetra Tech
                                 1320 N. Courthouse Road, Suite 600, Arlington VA 22201
                                 Tel: 703-387-2100 Fax: 703-414-5593
                                 www.tetratech.com/intdev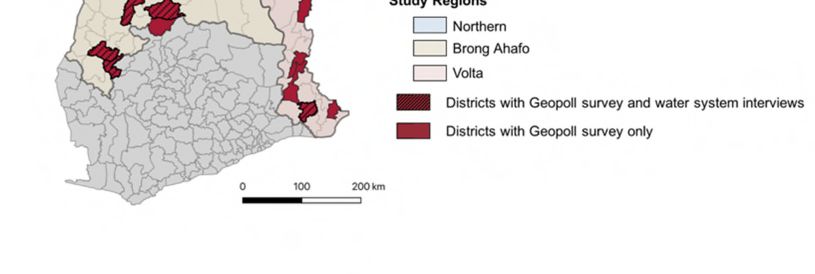
Assessing the Effects of COVID-19 on
Access to Water, Sanitation, and
Hygiene in USAID High Priority and
Strategy-Aligned Countries

Focus on Small Piped Providers in Ghana

JANUARY 2021

DISCLAIMER
The author’s views expressed in this publication do not necessarily reflect the views of the
United States Agency for International Development or the United States Government.
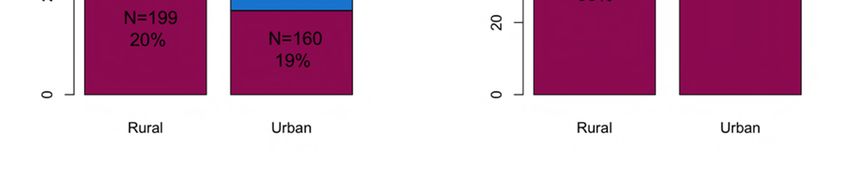
TABLE OF CONTENTS
                         EXECUTIVE SUMMARY .................................................................................... iii
                         1.  INTRODUCTION ...................................................................................... 1
                         2.  METHODS.................................................................................................. 3
                         3.  RESULTS .................................................................................................... 6
                             3.1  KEY INFORMANT INTERVIEWS .................................................................................... 6
                             3.2  SMS CONSUMER SURVEYS ........................................................................................... 9
                         4.  CONCLUSIONS ...................................................................................... 15
                         REFERENCES ..................................................................................................... 16
                         APPENDIX 1 - INTERVIEW GUIDES .............................................................. 17
                         APPENDIX 2 - SMS SURVEY INSTRUMENTS............................................... 21
                         APPENDIX 3 - ADDITIONAL TABLES .......................................................... 25
                         APPENDIX 4 - ADDITIONAL FIGURES ......................................................... 27

LIST OF FIGURES
Figure 1. Map of COVID WASH Deep Dive Countries. ......................................................................................... 2
Figure 2: Map of the study districts. .............................................................................................................................. 3
Figure 3: Distribution of SMS consumer survey respondents ................................................................................ 9
Figure 4: Drinking water sources of respondents from the District Survey ..................................................... 10
Figure 5. Sankey diagram of water source shanges ................................................................................................. 12
Figure 6: Water availability box-and-whisker plots. ................................................................................................ 13
Figure 7: Water payments box-and-whisker plots. ................................................................................................. 14

LIST OF TABLES
Table 1: Key informants interviewed. ........................................................................................................................... 4
Table 2: Small piped water system operator interviews .......................................................................................... 7

EFFECTS OF COVID-19 ON ACCESS TO WASH | SMALL PROVIDERS IN GHANA                                                                                               i
ACRONYMS AND ABBREVIATIONS
COVID-19     Coronavirus Disease 2019
CWSA         Community Water and Sanitation Agency
DA           District Assembly
GWCL         Ghana Water Company Limited
MoF          Ministry of Finance
MSWR         Ministry of Sanitation and Water Resources
SWE          Small Water Enterprises
WASH         Water, sanitation, and hygiene
WASHPaLS     Water, Sanitation, and Hygiene Partnerships and Learning for Sustainability
WSMTs        Water and Sanitation Management Teams

EFFECTS OF COVID-19 ON ACCESS TO WASH | SMALL PROVIDERS IN GHANA                           ii
EXECUTIVE SUMMARY
Between June and October 2020, the United States Agency for International Development (USAID)
Water, Sanitation, and Hygiene Partnerships and Learning for Sustainability (WASHPaLS) project
conducted a rapid assessment and forecasting analysis of the effects of the COVID-19 pandemic on
access to water, sanitation, and hygiene (WASH) services and products in USAID high priority and
strategy-aligned countries. “Deep dive” analyses were carried out in the Democratic Republic of the
Congo (DRC), Ghana, Kenya, Mozambique, Nepal, Rwanda, and Senegal. One of central findings of the
work in Ghana was that the government’s extended free water directive appeared to be combining with
the pandemic’s income shock to threaten the ability of smaller water service providers to continue
operating at acceptable performance standards. In response to this finding, USAID tasked WASHPaLS
with conducting a follow-on analysis in Ghana to gain further insights into the challenges faced by small
water providers and the ramifications on their customers.
This research sought to examine (i) the operational status of small piped water systems in Ghana, and
(ii) potential constraints on government institutions for providing reimbursement support to small
providers. Our approach was to combine interviews with rural piped system operators and other key
stakeholders with consumer surveys via SMS in communities served by these rural piped systems (as
well as elsewhere in Ghana, to provide comparisons by water supply modality).
Although operators themselves reported performance declines (with increases in the number of
days unavailable and decreases in the number of hours per day of service), rural piped water
supply systems have not yet experienced widespread shutdowns. Indeed, participants in our SMS
surveys in areas purposively sampled to capture customers of rural piped systems actually reported
significant improvements in water availability, with the average increasing from 10 hours per day to 11
hours per day after the onset of the pandemic.
There are warning signs of the medium- to long-term financial and operational soundness of
these rural systems. Operators reported increases in system water production of nearly 50 percent,
placing increasing wear on their equipment without concurrent maintenance, while the majority (62
percent) reported a cessation in revenue collection under the free water directive, reducing reported
operating reserves from an average of three months to an average of two months. In addition, we note
that the proportion of the rural population we purposively sampled (n = 1161) that reported piped
water to be their main drinking water modality dropped following the onset of COVID-19, suggesting
that some system service may have been disrupted.
Despite the free water directive, a significant fraction of small piped systems have continued to
collect revenue to support operating expenses. In addition to the 38 percent that continued to
collect revenue, 84 percent of the respondents to our SMS surveys reported still paying some amount
for water. Rural respondents reported spending an average of 47 GHS (roughly USD 8) per month and
urban respondents spent an average of 66 GHS (roughly USD11) per month.
Reimbursements by the Government of Ghana to the operators we interviewed have been
minimal to date. While 67 percent of water systems reported receiving some compensation, the
amount received was only a small fraction (4 to 16 percent) of the amount requested.

EFFECTS OF COVID-19 ON ACCESS TO WASH | SMALL PROVIDERS IN GHANA                                    iii
1. INTRODUCTION
Between June and September 2020, the United States Agency for International Development (USAID)
Water, Sanitation, and Hygiene Partnerships and Learning for Sustainability (WASHPaLS) project
conducted a rapid assessment and forecasting analysis of the effects of the COVID-19 pandemic on
access to WASH services and products in USAID high priority and strategy-aligned countries. The
central question we sought to answer was:
How will the COVID-19 pandemic (and resulting economic crisis) affect access to water
supply services, sanitation services and products, and hygiene products across the
WASH high priority and aligned countries, and how will these effects vary by subsector,
geography, and provider type?
We proceeded on the assumption that direct health effects of the pandemic in USAID high priority and
strategy-aligned countries would be exceeded by the economic shock of measures taken to contain the
pandemic (such as, restrictions of movement, closures of business, disruptions of supply chains, and so
forth).1
Our assessment was intended to provide both a snapshot of current WASH access conditions and to
forecast near-term trends. The activities comprised (1) a series of “deep dive” analyses in seven
countries and (2) the development of econometric models linking wealth indicators with WASH
outcomes. The deep dives included interviews with key informants on the supply side and SMS-based
questionnaires of hundreds of consumers with age, gender, and geographic distribution representative of
the countries’ broader populations.
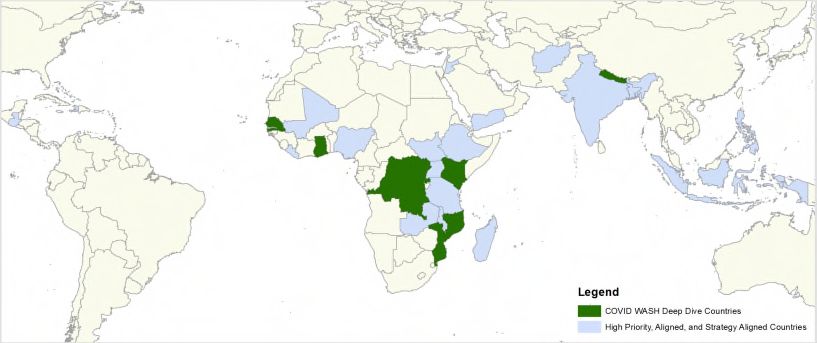
We selected seven countries for deep dive analysis based on their representation of a spectrum of
geographic, cultural, and vulnerability characteristics, as well as the confidence in our ability to secure
interviews with key informants identified via snowball sampling. The seven countries are the Democratic
Republic of the Congo (DRC), Ghana, Kenya, Mozambique, Nepal, Rwanda, and Senegal (Figure 1). For
the full analysis that combines results of the seven deep dives with the econometric analysis, we direct
readers to the WASHPaLS COVID-19 WASH Synthesis Report.
1
COVID-19 is likely to cause the first increase in global poverty in two decades, pushing some 100 million people into poverty
and 50 million into extreme poverty in 2020, with an estimated 23 million going into extreme poverty in sub-Saharan Africa
(Mahler et al. 2020). As we describe herein, the economic shocks of COVID-19 were experienced immediately and profoundly
by high priority and strategy-aligned countries, and have persisted even as some of these countries have inched back toward
pre-pandemic conditions of economic activity.
EFFECTS OF COVID-19 ON ACCESS TO WASH | SMALL PROVIDERS IN GHANA 1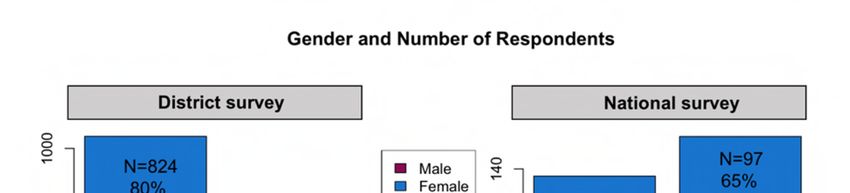
Figure 1. Map of COVID WASH Deep Dive Countries. Highlighted countries are USAID
         high priority and strategy-aligned countries, with the deep dive countries in green.

In Ghana, the government developed a multisectoral program valued at about USD 1.95 billion to
respond to the anticipated social and economic impacts of the pandemic. The majority of these funds
(USD 1.82 billion) were allocated under the Coronavirus Alleviation Programme to support selected
industries (e.g., water sector, pharmaceutical sector supplying COVID-19 drugs and equipment), support
small-to-medium enterprises, finance guarantees, build or upgrade district and regional health center
infrastructure, among others (IMF 2021). As part of the support to the WASH sector, the government
allocated USD 205 million in funds to pay, among other expenses, water bills for three months—from
April to June—and to provide water tanker services to vulnerable communities, as well as investing in
handwashing facilities in public places (Duti 2020). Ghana’s Minister of Sanitation and Water Resources
announced this free water directive in the Sanitation and Water for All Ministerial Webinar in April
2020. The government’s free water directive was subsequently extended through August and again
through December 2020 (Ministry of Sanitation and Water Resources, 2020). In January 2021, after this
study was completed, the Ghanaian president announced the extension of the free provision of water
for the Ghana Water Company Limited (GWCL) ‘lifeline customers’ (up to 5 cubic meter) until March
2021, though this has created some confusion for rural water providers, and some systems have
resumed charging customers for water (Jubilee House 2021).
One of central findings of our prior analysis for Ghana was that the government’s extended free water
directive (Ministry of Sanitation and Water Resources, 2020), sensibly intended to meet basic household
needs during a time of intense economic pressure, appeared to have exacerbated the pandemic’s income
shock to threaten the ability of smaller water service providers to continue operating at acceptable
performance standards. Smaller operators—especially those relying on grid electricity to move water
from its (usually) underground source to elevated storage and eventually through a piped network to
household and community taps—reported exhausting their cash reserves as they collected no, or
substantially reduced tariff revenue. Furthermore, these small operators were simultaneously operating
far above pre-COVID-19 levels, due to elevated consumption of tariff-free water as well as, plausibly,
increased water usage for hygiene purposes.
In response to this finding, USAID tasked WASHPaLS with conducting a follow-up analysis in Ghana to
gain further insight into this small water provider problem by interviewing a larger sample of operators
and expanding our SMS surveys to reach the largest possible sample of customers they serve. This
report presents the findings of the follow-on analysis.

EFFECTS OF COVID-19 ON ACCESS TO WASH | SMALL PROVIDERS IN GHANA                                    2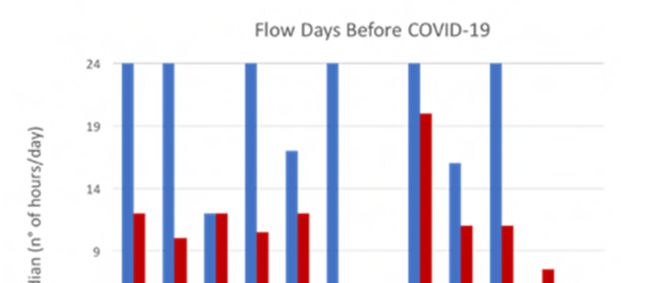
2. METHODS
This research sought to answer the following key questions:
1. What is the operational status of small piped systems in Ghana? Are service disruptions
imminent? Have they already occurred, and if so, how widespread have the disruptions been?
How are disruptions likely to increase as operating reserves are depleted?
2. What are the constraints on government institutions for tracking reimbursement needs, and
responding to reimbursement requests from small providers?
District Selection. We opted to focus on small piped water system operators and customers. Relying
on two databases maintained by the Community Water and Sanitation Agency (CWSA) (Community
Water and Sanitation Agency, n.d.; Ministry of Sanitation and Water Resources 2018) we identified
three regions with large numbers of small piped systems: Brong Ahafo, Northern, and Volta.2 We
contacted local officials in each region to select five to seven districts that satisfied two conditions: 1)
they had at least one small piped system, and 2) any urban centers in the districts were not served by
the national water supplier, Ghana Water Company Limited (GWCL). This process led us to select the
18 study districts depicted on Figure 2. We administered SMS surveys in each of these 18 districts and
conducted interviews with water system managers in a subset of 12 districts where we were able to
obtain contacts through snowball sampling (Figure 2).
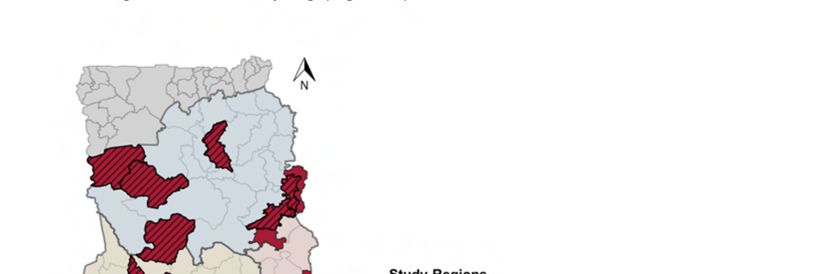
Figure 2: Map of the study districts.2 The SMS consumer survey included 18 districts: Brong
Ahafo region (six districts): Asutifi North, Asutifi South, Kintampo North, Nkoranza North,
Nkoranza South, and Wenchi; Northern region (seven districts): Kpandai, Nanton,
Nanumba South, Sawla Tuna Kalba, Tatale Sanguli, West Gonja, and Zabzugu; Volta region (five
districts): Afadzato South, Central Tongu, Ho West, Kadjebi, and Ketu. Water system interviews
were conducted in 12 of these districts.
2
We have used the old regional names and boundaries, to be consistent with the CWSA databases. The three study regions
(Northern, Brong Ahafo, Volta) were each divided into multiple regions in December 2018.
EFFECTS OF COVID-19 ON ACCESS TO WASH | SMALL PROVIDERS IN GHANA 3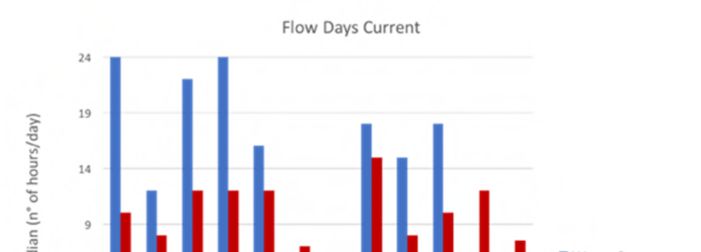
Key informant interviews. To gage the operational status of small piped systems, we conducted
structured interviews with small piped system operators, non-governmental organization (NGO)
implementers, and government institutions (Table 1). We interviewed operators and managers of 29
small piped systems covering a broad range of management modalities:
Water and Sanitation Management Teams (WSMTs) (19);
CWSA (5);
private operators (4);
schools (1); and
social enterprises (1).
We conducted the operator interviews via phone calls with an average duration of 1.5 hours each. In
three cases, our questions required interviews with multiple respondents, leading to a total of 32
respondents overall.
We also interviewed the leadership of four NGO implementers: two international NGOs operating
small water systems (World Vision and Global Communities) and two small water enterprises (SWEs:
Water4 and Safe Water Network). These interviews took place in person, lasting 30 minutes on
average. Global Communities has constructed four piped systems in the Savannah region (2), Oti region
(1), and Western region (1); these systems are now operated directly by WSMTs. Water4 operates in
the Wassa East district in the Western region. Their network comprises 182 public water points (62
handpumps and 120 kiosks) and 277 private connections (254 household connections, 7 schools, and 16
healthcare facilities). Safe Water Network operates 96 piped water systems in 12 regions.3 World
Vision has constructed a number of water systems across Ghana, including six in the Asutifi North
district which were the focus of our interview; these systems are operated by WSMTs.
To evaluate constraints on government institutions, we conducted in-depth interviews with the District
Planning Officer in Asutifi North (Brong Ahafo region) and the District Works Engineer in Wenchi
(Brong Ahafo region). These interviews sought to detail the level of assistance that District Assemblies
(DAs) provided to small piped systems under the free water directive. We also interviewed CWSA to
understand the process for rural water system reimbursements.
All interviews took place in November and December 2020, and followed pre-set interview guides
(Appendix 1). Following the small piped system operator interviews, we tabulated all responses and
computed quantitative summaries. Following the implementer and government interviews, we analyzed
interview notes qualitatively by searching for common themes. These interviews served to complement
our SMS surveying of consumers, providing a depth of observation that is not possible to gain from a
short SMS questionnaire.
Table 1: Key informants interviewed.
Key Informants Category Number
Interviewed
Operators - Operators and managers of small piped systems across 12 29
selected districts
Implementers - International NGOs: World Vision and Global Communities 4
- Small water enterprises (SWEs): Water4 and Safe Water
network
Government - District Assemblies (2) 3
- Community Water and Sanitation Agency (CWSA)
3
They are: Ahafo, Ashanti, Bono East, Brong Ahafo, Central, Eastern, Greater Accra, Oti, Savannah, Volta, Western, and
Western North.
EFFECTS OF COVID-19 ON ACCESS TO WASH | SMALL PROVIDERS IN GHANA 4SMS consumer surveys. To document household perspectives regarding the operational status of
small piped systems, we conducted a cross-sectional SMS consumer survey. Previous research
conducted by the team executing this activity found that consumers often provide more reliable
information about water services than the actual water suppliers (Acey et al. 2019). We contracted the
mobile-based research firm GeoPoll to conduct the survey, using instruments of our design (see
Appendix 2). SMS surveying is an extraordinarily efficient means of collecting consumer information;
GeoPoll has formal access to mobile subscriber databases of millions of people in Ghana. Our survey
could be easily read and filled out with a basic feature phone (non-smartphone) and was offered to
potential respondents incentivized by a modest offer of top-up credit. We implemented two similar but
distinct surveys:
1. a district-targeted survey, focused on jurisdictions with high numbers of small piped (non
GWCL) water operators, as described above; and
2. a national survey, focused on small piped water consumers generally.
The instruments each consisted of about 15 questions and were offered in English. Both surveys queried
information on water availability, source location, and costs of water. Respondents self-reported their
region (and district for the district survey), as well as their status as urban or rural dwellers. The district
survey also gathered information on water source type; for the national survey, only piped water
customers were eligible. Both surveys asked about pre-pandemic and current conditions, and were
executed from mid-November to early December 2020. We conducted all analysis in the statistical
software program R v3.6.1(R Core Team 2019) and relied on Wilcoxon tests to examine whether
differences were significant at p3. RESULTS 3.1 KEY INFORMANT INTERVIEWS System operators. The water supply systems whose operators we interviewed served a median of 4,500 people, with 123 private connections and 15 public standpipes (Table 2). Approximately 68 percent of water systems metered their production (Table 2). Under the free water directive, 69 percent of operators we interviewed reported that their production had increased, with a median change of +48 percent (Table 2). Some operators reported temporarily stopping operation under the free water directive (17 percent, 5 of 29) (Table 2). Operators also reported an increase in service interruptions under the free water directive; the median number of days with no water available increased from 0 to two days per week (Table 2). On days that water was available, operators reported that it was available for fewer hours: the median declined by six hours per day, from 24 to 18 hours (Table 2). Operators did not report changes in the number of days with scheduled outages (0 per week), though we note that they may not have been aware of all outages occurring within their networks and, at least in some cases, may not have kept accurate records of service interruptions (Table 2). It is also important to note that some customers may not have received services during the days and hours when the water system was functioning (i.e., 24 hours of water availability reported by the operator does not necessarily translate to 24 hours of service for all customers). Most small piped systems stopped collecting revenue under the free water directive (62 percent, 18 of 29 respondents). Others elected to apply tariffs to commercial customers (24 percent, 7 of 29 respondents), and/or to collect outstanding bills (17 percent, 5 of 29) (Table 2). A minority continued to apply tariffs to all customers (10 percent, 3 of 29). At the start of the free water directive in April 2020, the median duration that operators reported that their cash reserves could cover was three months; at the time of this research (November 2020), the median was two months. In the interim, 14 percent (4 of 28) of water systems reported receiving financial assistance from their District Assembly and 11 percent (3 of 28) from other sources, including a Member of Parliament and donations (Table 2). Two of the CWSA managed systems reported receiving ongoing support from the CWSA Regional Office, to ensure continued operation. Additionally, 67 percent (18 of 27) of the operators reported receiving some compensation from CWSA, though this compensation was only a portion of the amounts requested (7 percent median, ranging from 4 to 16 percent) (Table 2). Operators were unclear on whether they would receive additional reimbursements. As of November 2020, CWSA had only disbursed reimbursements for the months of April-June 2020, approximately four months after water systems had submitted their requests. During this period, many operators reported postponing expenses (57 percent, 16 out of 28 respondents). The most commonly delayed expenses were maintenance (75 percent, 12 out of 16 respondents) and salaries (64 percent, 10 out of 16 respondents) (Table 2). As electricity (required to pump water for most systems) was the biggest monthly expense and was not provided free of charge (Table 2), some systems reported experiencing challenges paying their electricity bills. One system reported postponing electricity expenses (Table 2), and another system reported that they stopped operating for three days when their electricity was cut-off because they were unable to pay their electricity bills until the DA gave them funds. NGO implementers. The two SWEs that we interviewed also reported major increases in water demand, ranging from 55 to 60 percent. To maintain consumption within production capacity and to limit waste, both SWEs instituted scheduled outages and/or rationing based on pre-COVID-19 consumption. One SWE required standpipe vendors to control the volume of water collected by each user and to limit water consumption to within a 50 percent increase over pre-COVID-19 levels. As one SWE reported, “We don’t want to limit people’s access to water, but we don’t want them to abuse it.” Both SWEs continued collecting revenue from private connections; one instituted unchanged tariffs but committed to refund customers proportionally to the CWSA reimbursements received. The other EFFECTS OF COVID-19 ON ACCESS TO WASH | SMALL PROVIDERS IN GHANA 6
applied tariffs when a user exceeded their pre-COVID-19 consumption level. Despite these measures,
and although this particular operator ran a system relying on solar power as opposed to grid power,
SWEs reported increases in operating expenses associated with maintenance linked to increased
production.
Three of the four implementing organizations we interviewed reported that the free water initiative
either had exhausted or would soon exhaust their cash reserves between November 2020 and January
2021. Nevertheless, they expected to continue operating with support from their national or
international headquarters. None of the organizations expected to receive full reimbursement from
CWSA. Additionally, all four organizations feared that the free water initiative would diminish customers
willingness-to-pay for water and jeopardize their campaigns to promote “pay-as-you-fetch”. One
respondent noted: “The fear is that people will not be willing to pay again after COVID. People will say that if
you’ve provided free water, you have the capacity to do this in the future as well.” SWEs underscored the cost
of re-sensitizing communities on payment: “We are afraid of introducing pay as you fetch again: we will have
to spend a lot of money to bring people back to pay for water.”
Table 2: Small piped water system operator interviews

                                                                           Number of
                                                                           responses       Median (min-max)
                                                                           (max: 29)
 Water system characteristics
    Estimated number of customers (people)                                 14              4,500 (1,000-9,000)
    Number of private connections                                          28              123 (0-1,245)
    Number of standpipes                                                   29              15 (0-161)
    Proportion of systems that metered their production                    22              68% (15)
    Breakdown of monthly expenses
         Electricity2                                                                      43% (0-80%)
         Salaries                                                                          30% (0-94%)
                                                                           24
         Maintenance                                                                       15% (0-44%)
         Consumables                                                                       3% (0-17%)
         Other
Number of months that water systems’ savings could cover
In April 20205 18 3 (0, 8)
In November 20206 16 2 (0, 12)
Proportion of systems that received financial assistance from1
CWSA 27 67% (18)
District Assembly 28 14% (4)
Other sources besides District Assembly and CWSA7 28 11% (3)
Financial Assistance
Amount requested from CWSA (GHS) 8 36,675 (9,000-162,670)
Amount received from CWSA (GHS) 13 4,607 (920-100,000)
Percent received from CWSA 6 7% (4%-16%)
Proportion of systems that postponed expenses:1,8 28 57% (16)
Electricity 16 6% (1)
Salaries 16 63% (10)
Maintenance 16 75% (12)
Other 16 13% (2)
1
Reported as proportions, with the number in parentheses.
2
28 out of 29 systems relied on grid power and one relied on solar power.
3
Reported when operators knew the amount or percentage of change in production. Two operators stated production had increased but did not know by
how much.
4
Scheduled outages are commonly referred to as ‘rationing’.
5
Calculated as total bank account balance divided by monthly expenses.
6
Self-reported.
7
Other sources included a Member of Parliament and donations.
8
Reported as proportion of systems who reported postponing expenses. Some systems reported postponing multiple expense categories. No system
reported postponing consumables.
Several respondents indicated concern that the government had not fully anticipated the complexity and
unintended consequences of administering a free water program in the highly fragmented and fragile
rural water sector. As one respondent explained: “We have spent a lot of time and resources to sensitize
communities on pay as you fetch…and it was working, and then there is the free water policy. The government
should have thought through this carefully, and tried to work with stakeholders to adopt a more efficient
approach to work for all types of systems.”
Government stakeholder interviews. Our interviewees suggested that the free water initiative may
initially have been intended strictly for urban water supply services, despite being announced to apply to
all water supplies in Ghana. Rural water in Ghana is currently decentralized and is supplied by a variety
of actors under different management models, including community-level water and sanitation
management teams (WSMTs) and private operators.
Once the free water policy was initiated, the sequence for CWSA reimbursing rural water suppliers was
proposed as follows:
1. Water systems submit data on expenses, production, and consumption to DAs, along with a
reimbursement request;
2. DAs vet and validate data;
3. DAs submit data to CWSA regional offices;
4. CWSA regional offices perform additional validation of data as needed;
5. CWSA submits requests from all regions simultaneously to the Ministry of Sanitation and Water
Resources (MSWR);
6. MSWR submits to Ministry of Finance (MoF);
7. MoF approves reimbursement and transfers money to CWSA;
8. CWSA distributes reimbursement to DAs;
9. DAs transfer reimbursements to the system operators.
EFFECTS OF COVID-19 ON ACCESS TO WASH | SMALL PROVIDERS IN GHANA 8DAs were responsible for compiling reimbursement amounts for water systems in their districts and submitting them to CWSA. “As a government institution, we are responsible for making sure free water is implemented,” one DA official reported. DAs found the reimbursement process to be challenging, and our key informants reported that system operators could not fill out the request forms as CWSA required. Because the Ministry of Finance could also audit the rural water reimbursement data, CWSA was tasked with validating all claims independently of DAs, a particularly time-consuming endeavor because so many operators do not keep records of production, consumption, or finances. The first three months of reimbursement claims (April-June 2020) were completed in early August 2020, but very little had been paid by November 2020, and it is unclear whether further payments will be provided. While many systems requested assistance from DAs to maintain operations under the free water directive, the DAs' ability to meet these requests depended on their own financial resources. One DA reported repairing broken handpumps and providing financial support to piped suppliers to cover electricity and operational costs, which they planned to recoup from CWSA reimbursements. Another DA official we interviewed reported that his district was unable to provide any financial assistance to water systems. Instead, he recommended water operators pre-finance expenses while waiting for reimbursements. Systems that were unable to pre-finance had to resort to selling water in violation of the free water directive. “The DA couldn’t force them to continue providing the water for free because it couldn’t support them financially,” one official said. 3.2 SMS CONSUMER SURVEYS Respondent population. We obtained a total of 2,174 responses from the SMS consumer survey: 287 from the national sample and 1,887 from the district sample (detailed results of both surveys are presented in Appendix 3, Table S3.1). Figure 3 provides the respondent distribution by region for the national survey and by district for the district survey. In both surveys, approximately half of the respondents (53 percent) were from rural areas; the remainder were from urban areas, and 80 percent were males, with an average age of 29 years (Appendix 3, Figure S4.1). In the district survey, 18 percent of the respondents had a household connection (“tap”) and 20 percent relied on public standpipes. For the national survey, where service by piped water was one of the sampling eligibility criteria, 44 percent of the respondents reported a household connection and 56 percent used standpipes. EFFECTS OF COVID-19 ON ACCESS TO WASH | SMALL PROVIDERS IN GHANA 9
National Survey (n=287) District Survey (n=1887)
Distribution
Distribution ofof respondents
respondents by Region
by Region Distributionofofrespondents
Distribution respondents
byby District
District
Ashanti Nanton
Ho West
Brong-Ahafo Nanumba South
Ketu North
Western
Zabzugu
West Gonja
Upper East
Kintampo North
Greater Accra Wenchi
Nkoranza South
Eastern Asutifi North
Central Tongu
Volta Asutifi South
Afadzato South
Upper West Kpandai
Kadjebi
Central Tatale Sanguli
Nkoranza North
Northern Sawla Tuna Kalba
Dormaa West
00 20
20 40
40 60
60 80
80 00 50
50 100
100 150
150 200
200
Number
number ofofrespondents
respondents Number of respondents
number of respondents
(a) (b)
Figure 3: Distribution of SMS consumer survey respondents. (a) By region for the National
Survey and (b) by district for the District Survey (b). The District Survey was conducted in 3 regions:
Brong-Ahafo, Volta and Northern Region, which are shaded dark red in (a).
Water Supply Sources. In the district survey, we compared respondents’ current main source of
drinking water to their main source prior to the onset of COVID-19. Approximately 40 percent of the
respondents reported currently using standpipe or tap water, with a significant urban/rural split (50
percent vs 30 percent, respectively (Figure 4)). For rural respondents, there was a net 16 percent
decrease in the use of piped water (standpipe or tap) as compared to before COVID-19,
counterbalanced by a net increase in use of rainwater (+56 percent) and spring or river (+20 percent)
(Figure 4a, Appendix 3, Table S3.1). For the urban respondents, water supply modalities remained
largely constant before and after the onset of COVID-19 (Figure 4b).
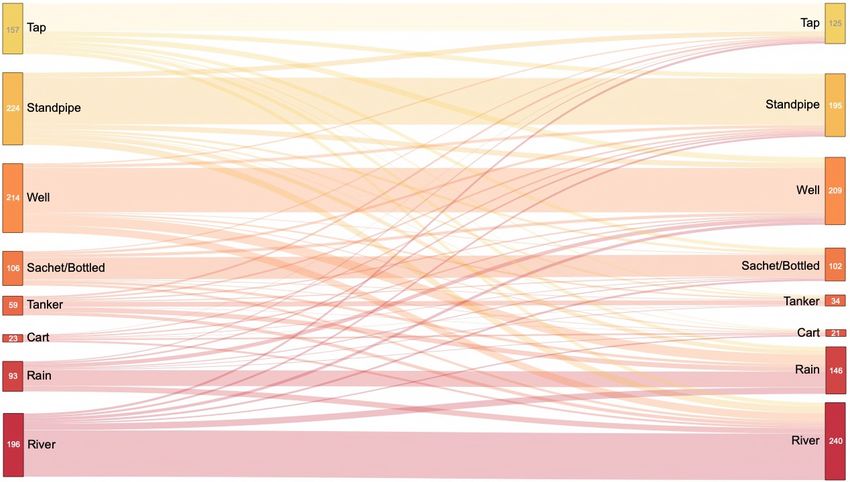
The nature of the change across each modality for rural respondents to the district-level survey is
presented in Figure 5. Roughly half (46 percent) of those who reported a household connection (“tap”)
as their main drinking water source prior to COVID-19 reported transitioning to a new source, but 31
percent of the fraction who reported their present source to be a household connection were those
who had not reported one as their pre-COVID-19 main source. Similarly, the proportion of those rural
respondents reporting reliance on public standpipes exhibited a net decline (of 17 percent), with 18
percent of the fraction reporting them as their present source transitioning to it from non-piped
modalities which they stated as their pre-pandemic main water supply sources.
Approximately half of the respondents that used standpipes or taps reported that COVID-19 did not
change their ability to get their drinking water; the remainder were approximately evenly split between
reporting that water access was currently easier or more difficult to access (Appendix 4, Figure S4.3).
These results are consistent with our prior deep dive survey in Ghana where 22% of respondents
reported that water was more difficult to access.
EFFECTS OF COVID-19 ON ACCESS TO WASH | SMALL PROVIDERS IN GHANA 10(a) (b)
Figure 4: Water sources. Drinking water sources of respondents from the District Survey before
COVID-19 and currently, for (a) rural and (b) urban respondents.
Water availability. Overall, piped water availability was higher for respondents of our national-level
survey compared to the district-level survey which we purposively sampled (Figure 6). This was true for
urban and rural respondents, both pre-COVID-19 and at present, for both metrics of piped water
availability: days per week and hours per day (pFigure 5. Sankey diagram of water source changes. Changes in drinking water modality reported by rural respondents to our district-level SMS consumer surveys. Numbers of respondents for each pre-COVID-19 modality at left, and numbers of respondents for each present modality at right. EFFECTS OF COVID-19 ON ACCESS TO WASH | SMALL PROVIDERS IN GHANA 12
Number of days per week with piped water available

                                                         National Survey                                                                         District Survey
                                              Rural (p=0.46)      Urban (p=0.09)                                                       Rural (p=0.08)        Urban (p=0.50)

                                         7

                                                                                                                              7
                                         6

                                                                                                                              6
                                                                 N=149
               Number of Days per week

                                                                                           Number of Days per week
                                         5

                                                                                                                              5
                                              N=138                         N=149
                                         4

                                                                                                                              4
                                                        N=138                                                                                    N=308               N=408
                                         3

                                                                                                                              3
                                                                                                                                       N=290               N=384
                                         2

                                                                                                                              2
                                         1

                                                                                                                              1
                                         0

                                                                                                                              0
                                                                         Before Covid-19                                           Current

                                                                                             (a)
                                                                Number of hours per day with piped water available

                                                         National Survey                                                                         District Survey
                                              Rural (p=0.57)      Urban (p=0.69)                                                        Rural (p=0.03)        Urban (p=0.24)
                                         20

                                                                                                                              20
          Number of Hours per day

                                                                                                    Number of Hours per day

                                                                                                                              15
                                         15

                                                                 N=149      N=149
                                                                                                                              10
                                         10

                                              N=138    N=138                                                                                                         N=408
                                                                                                                                                 N=290      N=384
                                                                                                                              5

                                                                                                                                       N=290
                                         5

                                                                                                                              0

                                                                      Before Covid-19                                              Current

                                                                                             (b)
          Figure 6: Water availability box-and-whisker plots. (a) Number of days per week
          and (b) number of hours per day, with piped water available for the national and the
          district survey and for rural and urban areas. Boxes represent the interquartile range
          (i.e., the middle 50 percent of the observations, 25 to 75 percent), the bold black line is
          the median, and the black diamond the mean. The whiskers represent 1.5 times the
          interquartile range (12.5 to 87.5 percent). The presented p-value is from Wilcoxon rank
          sum test.

EFFECTS OF COVID-19 ON ACCESS TO WASH | SMALL PROVIDERS IN GHANA                                                                                                               13
Water payments. Notably, most piped water users—84 percent in both national and district surveys —reported paying some amount for water despite the free water directive. Rural respondents spent an average of 47 GHS (USD 8) per month and urban respondents spent an average of 66 GHS (USD 11) per month (Appendix 3, Table S3.1). However, it is possible that these payments include alternative water sources to piped supplies, such as bottled or sachet water. Compared to pre-COVID-19, respondents to both surveys reported spending less on water (Figure 7). For the district survey, average monthly payments decreased by 30 percent (from 69 GHS to 48 GHS) for rural respondents and 20 percent (from 80 GHS to 65 GHS) for urban respondents (both p
4.        CONCLUSIONS
The COVID-19 economic shock, in tandem with the Government of Ghana’s ambitious free water
directive, have posed obvious challenges to the country’s water sector in general, and to its small water
piped systems in particular.
Rural piped water providers have collected less revenue; 62 percent of surveyed providers have stopped
collecting revenue entirely. Their cash reserves are declining, but those declines do not appear to have
yet led to widespread disruptions of service relative to before COVID-19 and the government’s
measures to alleviate the financial pressures experienced by much of the public. While consumers did
report an overall reduction in piped water use (16 percent among rural respondents, some of which
may be a result of non-functioning piped water systems), most consumers did not report significant
changes in water availability in piped water systems compared to pre-COVID-19 levels.
One plausible interpretation of these findings is that they are encouraging indications of water sector
resilience. Customers of the very systems we hypothesized to be the most vulnerable to declines in
water access report modest increases in water availability since the onset of COVID-19, increases that
were not observed more generally across Ghana. By contrast, there is suggestive evidence that the
populations we anticipated would be least affected (urban consumers) have seen a slight decline in
service (p=0.09 for a Wilcoxon rank sum test showing a decrease in number of days per week with
available water following the arrival of COVID-19).
An alternative interpretation is that the baseline, pre-pandemic rural water supply situation was such
that service was already so poor that neither the pandemic economic shock nor the government
measures that deprived suppliers of months of revenue were sufficient to greatly affect their overall
operational and financial health. In other words, it is likely that we did not observe a major change in
service delivery because cost recovery was already poor prior to COVID-19.
To whichever interpretation one might subscribe, there are clearly issues that must be tracked carefully:
both system operators and consumers report much higher system production, placing increasing wear
on equipment, coupled with revenue shortfalls from the free water directive that will at least partially
continue through March 2021. The government has been slow to reimburse small rural system
operators for foregone revenue, at least partially because the complex reimbursement process requires
substantial coordination of multiple stakeholders, and also because so many operators do not keep
records of production, consumption, or finances. More widespread system failures may be looming in
the future, especially if revenue collection following the eventual termination of the free water directive
remains difficult because consumers have become accustomed to free provision. On the other hand, the
ability of some operators to continue collecting revenue (and the recognition by consumers that their
paying of tariffs is essential to continuing service) is a positive sign, and measures to encourage that
practice should be pursued.

EFFECTS OF COVID-19 ON ACCESS TO WASH | SMALL PROVIDERS IN GHANA                                     15
REFERENCES
Acey, C., J. Kisiangani, P. Ronoh, C. Delaire, E. Makena, G. Norman, D. Levine, R. Khush, and R. Peletz.
     2019. “Cross-Subsidies for Improved Sanitation in Low Income Settlements: Assessing the
     Willingness to Pay of Water Utility Customers in Kenyan Cities.” World Development 115.
     https://doi.org/10.1016/j.worlddev.2018.11.006.
Community Water and Sanitation Agency. n.d. “CWSA Water Atlas of Rural and Small Town Water
   Services in Ghana.”
Duti, Vida. 2020. “Opinion: A Complex WASH Sector Could Hamper Ghana’s Fight against COVID-19 |
      Devex.” Devex. 2020. https://www.devex.com/news/opinion-a-complex-wash-sector-could-
      hamper-ghana-s-fight-against-covid-19-97396.
IMF. 2021. “Policy Responses to COVID-19: Ghana.” 2021. https://www.imf.org/en/Topics/imf-and-
     covid19/Policy-Responses-to-COVID-19#G.
Jubilee House. 2021. “Full Text: Akufo-Addo’s 21st Address on Measures Taken against Coronavirus.”
      2021. https://www.myjoyonline.com/full-text-akufo-addos-21st-address-on-measures-taken-against-
      coronavirus/.
Mahler, Daniel Gerszon, Christoph Lakner, R. Andres Castaneda Aguilar, and Haoyu Wu. 2020. “The
     Impact of COVID-19 (Coronavirus) on Global Poverty: Why Sub-Saharan Africa Might Be the
     Region Hardest Hit.” World Bank Blog. 2020. https://blogs.worldbank.org/opendata/impact-covid-
     19-coronavirus-global-poverty-why-sub-saharan-africa-might-be-region-hardest.
Ministry of Sanitation and Water Resources. 2018. “Community Water and Sanitation Agency (CWSA)
     2018 Annual Report.”
———. 2020. “The Government Has Extended the Free Water Intervention Policy Program to
  December 31,2020.” 2020. http://mswr.gov.gh/the-government-has-extended-the-free-water-
  intervention-policy-program-to-december-312020/.
R Core Team. 2019. “R: A Language and Environment for Statistical Computing.” Vienna, Austria: R
    Foundation for Statistical Computing.

EFFECTS OF COVID-19 ON ACCESS TO WASH | SMALL PROVIDERS IN GHANA                                   16
APPENDIX 1 - INTERVIEW GUIDES
Operator Interview Guide
Q1. Who is responsible for this scheme’s operation?
o CWSA
o WSMT
o District Assembly
o Private operator
o Institution (school, hospital)
o Social enterprise
o Other
Q2. How many customers (people) do you serve?
Q3. How many private connections in your network?
Q4. How many public standpipes in your network?
Q5. Is your system on grid power?
o If no: Solar? Diesel?
Q6. What is your water source (borehole, lake, river, pond, other)?
Q7. How many pumps do you employ?
Q8. What is the capacity of your pump?
Q9. How many elevated tanks do you have? What is the volume of your elevated tank(s)?
Q10. What was your average daily production pre-COVID?
Q11. What is your average daily production now?
Q12. What was your average daily consumption pre-COVID (from standpipes and private connections
combined)?
Q13. What is your average daily consumption now?
Q14. Pre-COVID, in a typical week, on how many days was the water not flowing at all?
o What is the situation now?
o How many days did the water flow in the past week?
Q15. Pre-COVID, in a typical week, on how many days did you have to ration your water (i.e. not serve
all customers all day)?
o What is the situation now?
o How many days did you have to ration water in the past week?
Q16. Pre-COVID, on days where the water was flowing, on how many hours was it flowing per day?
o What is the situation now?
EFFECTS OF COVID-19 ON ACCESS TO WASH | SMALL PROVIDERS IN GHANA 17o Yesterday, how many hours was the water flowing?
Q17. Have you collected any revenue since the declaration of the free water directive?
o If yes: please explain
Q18. Can you break down your monthly expenses?
o Electricity:
o Personnel:
o Regular maintenance
o Consumables
o Other (specify)
o Total: [Calculate the total and confirm with respondent that it is correct, if not, add
more categories or rectify above amounts].
Q19. Have you ever borrowed money from a bank for operations?
o If so, how much?
Q20. Before COVID-19, what was your operating financial surplus or loss every month?
Q21. What was the balance in your bank accounts at the onset of COVID-19?
o Operational account?
o Capital account?
o Sanitation account?
Q22. Did you apply for a reimbursement from CWSA to cover the costs of the free water program?
o If yes, when? [Note if this was a recurring application, for example, monthly, and
which months they applied]
o How did you apply? (e.g. directly, or through DA)
o Did you face any challenges when applying for reimbursement? Please describe.
o How much did you apply for? (Note multiple figures if system has applied multiple
times)
Q23. Have you been reimbursed by CWSA?
o If yes, how much?
Q24. Just during the period of Covid-19: Have you received any other financial assistance from anyone
else?
o If so, what kind (loans, grants, other types of investments)?
o If so, how much?
Q25. How long can you continue to operate with your current cash reserve? [Triangulate the answer
with previous answers: Q15, Q16, Q18, Q19).
Q26. Have you ever had to stop operating?
o If yes, how many times, and for how long? For what reasons?
Q27. Have you had to postpone specific expenses since the free water program started? If so, which
ones? What are your plans for the future?
EFFECTS OF COVID-19 ON ACCESS TO WASH | SMALL PROVIDERS IN GHANA 18Implementer Interview Guide
Q1. Which of the following best describes your organization’s work? (circle all that apply)
o System design
o System construction
o System operation
o Financial support
o Management support
o System rehabilitation
o System expansion
Q2. Can you tell me about the small piped systems that are part of your programs?
o Where are they located?
o How many consumers do they serve? (try to get an estimate of how many
customers per system)
o Who operates them?
o Before COVID-19, were they able to cover their operating costs?
o Do you know what fraction of them were able to maintain a cash reserve?
o Can you give a rough breakdown of a typical system’s operating costs (electricity,
personnel, etc.)
Q3. Have the systems complied with the national free water directive?
o If not, why not?
Q4. Have the systems associated with your programs applied for reimbursement for lost revenue
during the COVID-19 period?
o Please describe the process of requesting reimbursement
o How much of your requested reimbursement have you received?
Q5. Can you describe the current financial status of the systems? What do you know of their cash
situation?
Q6. Have your systems been able to continue operating normally? If not, what has happened?
o Episodic service disruptions?
o Complete service disruptions?
Q7. If service has been disrupted, why has that occurred?
o No cash to pay staff.
o No cash to pay electricity.
o No cash to cover other expenses (hardware)
o Other (please describe)
Q8. Are there particular regions or settings that are proving more challenging than others?
Q9. How have you been coping with the challenges?
Q10. What are you hearing from your colleagues in the NGO community and elsewhere about these
questions?
EFFECTS OF COVID-19 ON ACCESS TO WASH | SMALL PROVIDERS IN GHANA 19District Assembly Interview Guide
1. What has been your experience with collecting data for reimbursements of the free water program?
a. What have been the challenges?
2. Have you received any money from CWSA? If yes:
a. How much?
b. How does this compare with what you expected to receive?
c. Have you distributed the money to WSMTs?
i. If so, how?
3. During the free water period, did you give assistance to small piped water systems in your district?
a. If so, what kind of support did you provide piped systems in your district?
i. If financial, how much?
ii. If other, what kind of support?
4. Did any water systems run out of money to pay for operational costs during the free water period?
a. If so, what happened & why?
b. If not, how were they able to keep operating? (probe, for example.: did they collect revenue
from somewhere? If so, where?)
5. Were there any additional challenges piped systems experienced outside of finances? If so, please
explain.
EFFECTS OF COVID-19 ON ACCESS TO WASH | SMALL PROVIDERS IN GHANA 20APPENDIX 2 - SMS SURVEY INSTRUMENTS
District-targeted survey
Q# Q Name English Skip Pattern
GeoPoll: Reply 1 to answer questions on your drinking water and earn #TOPUP# ! No cost to reply. For help 1 = BirthYear
NA Optin
reply HELP HELP = HELP
GeoPoll is a global network of people shaping their community by answering short surveys. Free to respond. 1 = BirthYear
NA HELP
Reply STOP to Opt-Out. Visit GeoPoll.com for info STOP = Refusal
Thank you for your time, you will be removed from today's survey. For more information or to register for
NA Refusal End poll declined
future surveys please visit GeoPoll.com
NA Ineligible You are ineligible for this survey. For more information on Coronavirus prevention visit who.int End poll ineligible
1900-1919 = Ineligible
1 BirthYear In what year were you born? Reply with a four-digit number like 1980. 1920-2005 = Gender
2006-2020 = Ineligible
Are you male or female? Reply with 1 or 2.
2 Gender 1)Male 1-2 = ADM-1
2)Female
What Region do you currently live in?
1)Ashanti
2)Brong-Ahafo
1 = Ineligible
3)Greater Accra
2 = ADM2_Brong
4)Central
3-5 = Ineligible
3 ADM-1 5)Eastern
6 = ADM2_Northern
6)Northern
7-9 = Ineligible
7)Western
10 = ADM2_Volta
8)Upper East
9)Upper West
10)Volta
What District do you currently live in?
1)Asutifi North
2)Asutifi South
3)Dormaa West
1-7 = Urban/Rural
4 ADM2_Brong 4)Kintampo North
8 = Ineligible
5)Nkoranza North
6)Nkoranza South
7)Wenchi
8)Other
What District do you currently live in?
1)Kpandai
2)Nanton
3)Nanumba South
1-7 = Urban/Rural
5 ADM2_Northern 4)Sawla Tuna Kalba
8 = Ineligible
5)Tatale Sanguli
6)West Gonja
7)Zabzugu
8)Other
What District do you currently live in?
1)Afadzato South
2)Central Tongu
1-5 = Urban/Rural
6 ADM2_Volta 3)Ho West
6 = Ineligible
4)Ketu North
5)Kadjebi
6)Other
EFFECTS OF COVID-19 ON ACCESS TO WASH | SMALL PROVIDERS IN GHANA 21District-targeted survey (continued)
Q# Q Name English Skip Pattern
Do you live in a urban or rural area? Reply with 1 or 2.
7 Urban/Rural 1)Urban area [city/town] 1-2 = WaterSupply
2)Rural area [village/farm]
In the past month, how did you get your drinking water?
1)Tap
2)Standpipe
3)Well
1-2 = FlowDays
8 WaterSupply 4)Bottled water/sachet
3-8 = SourceLocation
5)Tanker
6)Cart vendor
7)Rainwater
8)Spring/River
9 FlowDays In the past 1 week, how many days was the piped water available? Reply a digit number between 0 and 7. 0-7 = FlowHours
On the days when piped water is available, how many hours per day, on average, does it flow? Reply with a one
10 FlowHours 1-24 = SourceLocation
or two digit number between 1 and 24.
Where is the water source that you use? Reply with a number.
1)In my home or compound
11 SourceLocation 1-3 = WaterPay
2)Neighbor
3)I must walk to it
How much did you pay for drinking water in the past month, in GHS? Reply with a one, two, or three digit
12 WaterPay 0-500 = WaterChange
number between 0 and 500.
Has COVID-19 made it easier or more difficult to get your drinking water?.
1)Easier
13 WaterChange 1-3 = WaterSupplyBefore
2)More difficult
3)The same as before
Before COVID, how did you get your drinking water?
1)Tap
2)Standpipe
3)Well
1-2 = FlowDaysBefore
14 WaterSupplyBefore 4)Bottled water/sachet
3-8 = WaterPayBefore
5)Tanker
6)Cart vendor
7)Rainwater
8)Spring/River
Before COVID-19, In a typical week, how many days was the piped water available? Reply a digit number
15 FlowDaysBefore 0-7 = FlowHoursBefore
between 0 and 7.
Before COVID-19, on the days you receive piped water, how many hours per day, on average, did it flow? Reply
16 FlowHoursBefore 1-24 = WaterPayBefore
with a one or two digit number between 1 and 24.
Before COVID-19, how much did you pay for drinking water per month, in GHS? Reply with a one, two, or three
17 WaterPayBefore 0-500 = Close-out-Incentive
digit number between 0 and 500.
GeoPoll: Thank you! You will receive #TOPUP# airtime credit within 2 days. For more information on
NA Close-out-Incentive NA
Coronavirus prevention visit who.int
EFFECTS OF COVID-19 ON ACCESS TO WASH | SMALL PROVIDERS IN GHANA 22National survey
Q# Q Name English Skip Pattern
GeoPoll: Reply 1 to answer questions on your drinking water and earn #TOPUP# ! No cost to reply. For help 1 = BirthYear
NA Optin
reply HELP HELP = HELP
GeoPoll is a global network of people shaping their community by answering short surveys. Free to respond. 1 = BirthYear
NA HELP
Reply STOP to Opt-Out. Visit GeoPoll.com for info STOP = Refusal
Thank you for your time, you will be removed from today's survey. For more information or to register for
NA Refusal End poll declined
future surveys please visit GeoPoll.com
NA Ineligible You are ineligible for this survey. For more information on Coronavirus prevention visit who.int End poll ineligible
1900-1919 = Ineligible
1 BirthYear In what year were you born? Reply with a four-digit number like 1980. 1920-2005 = Gender
2006-2020 = Ineligible
Are you male or female? Reply with 1 or 2.
2 Gender 1)Male 1-2 = ADM-1
2)Female
What Region do you currently live in?
1)Ashanti
2)Brong-Ahafo
3)Greater Accra
4)Central
3 ADM-1 5)Eastern 1-10 = Urban/Rural
6)Northern
7)Western
8)Upper East
9)Upper West
10)Volta
Do you live in a urban or rural area? Reply with 1 or 2.
4 Urban/Rural 1)Urban area [city/town] 1-2 = WaterSupply
2)Rural area [village/farm]
In the past month, how did you get your drinking water?
1)Tap
2)Standpipe
3)Well
1-2 = WaterSupplyBefore
5 WaterSupply 4)Bottled water/sachet
3-8 = Ineligible
5)Tanker
6)Cart vendor
7)Rainwater
8)Spring/River
Before COVID, how did you get your drinking water?
1)Tap
2)Standpipe
3)Well
1-2 = WaterCompany
6 WaterSupplyBefore 4)Bottled water/sachet
3-8 = Ineligible
5)Tanker
6)Cart vendor
7)Rainwater
8)Spring/River
Do you get your water from Ghana Water Company Limited (GWCL)?
1)Yes 1 = Ineligible
7 WaterCompany
2)No 2-3 = FlowDays
3)I don't know
EFFECTS OF COVID-19 ON ACCESS TO WASH | SMALL PROVIDERS IN GHANA 23You can also read