River Spey Abstractions 2021 Water Resource Management Now and Implications for the Future - January 2021
←
→
Page content transcription
If your browser does not render page correctly, please read the page content below
River Spey Abstractions 2021
Water Resource Management Now and
Implications for the Future

January 2021
River Spey Abstractions 2021
Water Resource Management Now and
Implications for the Future

Client:              Spey Fishery Board

Document number: 9408
Project number:  672574
Status:          Issue

Author:              Kenneth MacDougall
Reviewer:            Martin Nichols

Date of issue:       29 January 2021
Filename:            Spey Abstractions 2021_01_29

 Glasgow                       Aberdeen                 Inverness           Edinburgh

 Craighall Business Park       Banchory Business        Alder House         1st Floor
 8 Eagle Street                Centre                   Cradlehall          Sirius Building
 Glasgow                       Burn O’Bennie Road       Business Park       The Clocktower Estate
 G4 9XA                        Banchory                 Inverness           South Gyle Crescent
 0141 341 5040                 AB31 5ZU                 IV2 5GH             Edinburgh
 info@envirocentre.co.uk       01330 826 596            01463 794 212       EH12 9LB
 www.envirocentre.co.uk                                                     0131 370 4070

This report has been prepared by EnviroCentre Limited with all reasonable skill and care, within the
terms of the Contract with Spey Fishery Board (“the Client”). The report is confidential to the Client,
and EnviroCentre Limited accepts no responsibility of whatever nature to third parties to whom this
report may be made known.

No part of this document may be reproduced or altered without the prior written approval of
EnviroCentre Limited.
Spey Fishery Board January 2021
River Spey Abstractions 2021; Water Resource Management Now and Implications for the Future
EXECUTIVE SUMMARY
In 2008 the Spey Fishery Board published an independent report investigating the water abstractions
in the River Spey catchment. It provided a valuable insight into the demand on water resources at that
time, enabling a much more informed position to be adopted in decision making relating to the
effective management of the fisheries and fish populations of the Spey.
This update to the 2008 report reviews the changes in demand on the water resources of the Spey.
The changes in data availability are considered along with the most recently published future climatic
trend forecasts to identify priority actions to help manage these challenges. The key findings are:
A total of 51 sites have active water abstractions licenced by SEPA, with the two largest
abstractions being for hydro-electric power generation that account for 91% of the entire
consented abstraction volume on the Spey - the Fort William Aluminium Smelter and the Scottish
and Southern Energy Tummel Valley hydro scheme.
Actual annual abstractions vary between 5% to nearly 80% of the consented amount and are
typically only 25% to 30% of the consented amount. Some consents transferred from historic
abstraction rights are in excess of the available resources when assessed on an annual basis.
The two main hydro schemes abstract and transfer water out of the Spey catchment from an area
draining 390 km2, or 13% of the catchment to Spey Bay. This reduces the natural mean flow in the
Spey by up to 66% below the abstractions, by 39% – 61% at Kinrara, and by 17% - 24% at Boat o’
Brig. This reduction in natural flow reduces the resilience of the river during low flow conditions.
Analysis of the available water resources and the amount of water abstracted during a wetter year
(2015) compared to a drier year (2018), shows that abstraction volumes increase when more
water is available, with 20% more water being abstracted in 2015 compared to 2018.
Opportunities to improve the amount of water released back into the Spey in the upper catchment
will provide benefits that will extend downstream through the entire river. For example, if the mean
annual flow rate of 0.302 m3/s could be reinstated to the Allt an t-Sluie at Dalwhinnie, this would
represent a similar flow to that abstracted by Scottish Water at the Dipple wellfield (0.313 m3/s).
The latest regional future climate projections indicate that annual average rainfall up to 2100 is not
expected to change significantly, however changes to seasonal patterns are likely to result in
wetter winters and autumns, and drier summers. The frequency of extreme events leading to
floods and droughts are also expected to increase. There is a projected 20-40% regional
decrease in winter mean snowfall by 2080, which will reduce meltwater flow through the spring.
The upper Spey valley has extensive sand and gravel deposits that store less water than would
naturally be expected due to the lower river levels where flows have been reduced by abstraction.
This is often compounded by historic land management to limit flooding of agricultural land, which
also limits the opportunity to recharge these groundwater resources from ponding floodwater.
Initiatives to reduce the loss of water transferred out of the catchment along with the promotion of
land management measures that can re-connect the rivers with their natural floodplains and allow
floodwater to drain naturally back into the underlying sands and gravels can help improve the
resilience of the river system to these low flow events, which are likely to become more common.
The management of abstractions remains a key objective within the most recent 2016 Spey
Catchment Management Plan and was a recommendation from the 2008 Abstraction Report.
Although the available data on abstractions and river flows have become more accessible and
general stakeholder communications have improved, there remains a lack of a holistic river basin
approach by any agency to actively manage water abstractions and water resources in the Spey.
i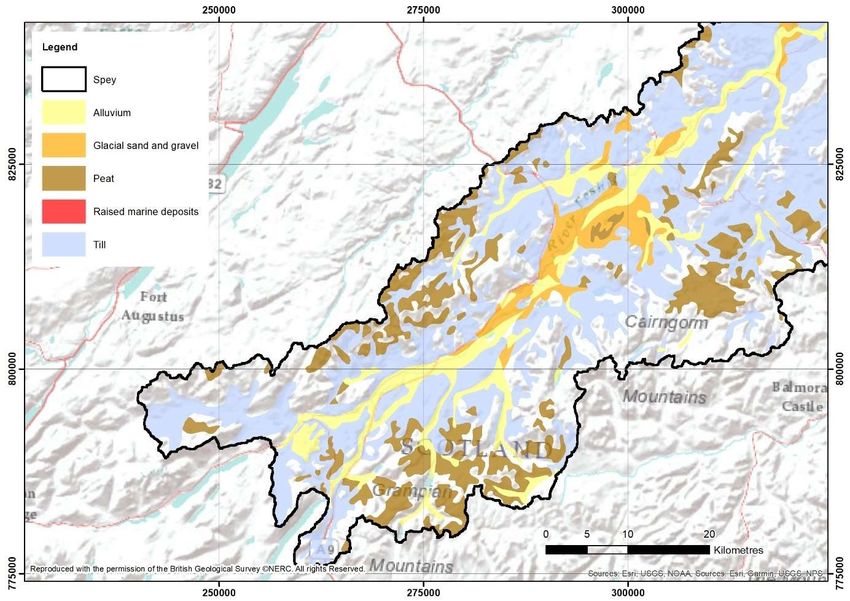
Spey Fishery Board                                                                                                                                  January 2021
River Spey Abstractions 2021; Water Resource Management Now and Implications for the Future

Contents
Executive Summary ............................................................................................................................................... i
1   Introduction ................................................................................................................................................... 1
    1.1 Terms of Reference ............................................................................................................................. 1
    1.2 Scope of Report ................................................................................................................................... 1
    1.3 Report Usage ....................................................................................................................................... 1
2   Overview of 2008 Spey Abstraction Report ............................................................................................. 2
3   River Spey Abstractions and Water Transfers ......................................................................................... 3
    3.1 The River Spey as a Water Resource ............................................................................................... 3
    3.2 Regulation of Abstractions.................................................................................................................. 4
    3.3 Consented Abstractions ..................................................................................................................... 4
    3.4 Actual Abstractions ............................................................................................................................. 8
4   Water Resource of The Spey ..................................................................................................................... 9
    4.1 Flows in the River Spey ...................................................................................................................... 9
    4.2 Gauged Flows on the Spey .............................................................................................................. 10
    4.3 High Level Water Resource Information ......................................................................................... 12
    4.4 Water Transfers from Major Hydro Power Schemes .................................................................... 15
    4.5 Naturalised Flows in the River Spey ............................................................................................... 19
    4.6 Modelled Losses from Water Transfers in the Upper Spey ......................................................... 20
    4.7 SEPA Abstraction Consents and Returns ...................................................................................... 21
5   Future Management and Climate Projections ........................................................................................ 23
    5.1 Water Resource Management Tools ............................................................................................... 23
    5.2 UK Future Climate Projections ......................................................................................................... 24
    5.3 Restoring Hydrological Resilience to the Spey.............................................................................. 31
    5.4 Implications for River and Fisheries Management ........................................................................ 33
6   Conclusions ................................................................................................................................................ 34

Figures
Figure 3.1: Summary of key ecological conditions driven by river flow regime ......................................... 3
Figure 4.1: Catchment of the River Spey ......................................................................................................... 9
Figure 4.2: SEPA gauging stations .................................................................................................................. 10
Figure 4.3: Gauging station flow duration curves.......................................................................................... 11
Figure 4.4: Standard Precipitation Index across the Spey (2000-2020) – 12 month accumulation ...... 13
Figure 4.5: Standard Precipitation Index across the Spey (2015-2020) – 1 month accumulation......... 14
Figure 4.6: Major hydro scheme water transfers from the Spey catchment ............................................. 15
Figure 4.7: Regulated catchment areas for major hydro scheme water transfers from the Spey ......... 17
Figure 4.8: The Tummel Valley hydro electric scheme ................................................................................ 18
Figure 5.1: Frequency of daily high (>Q5) and low (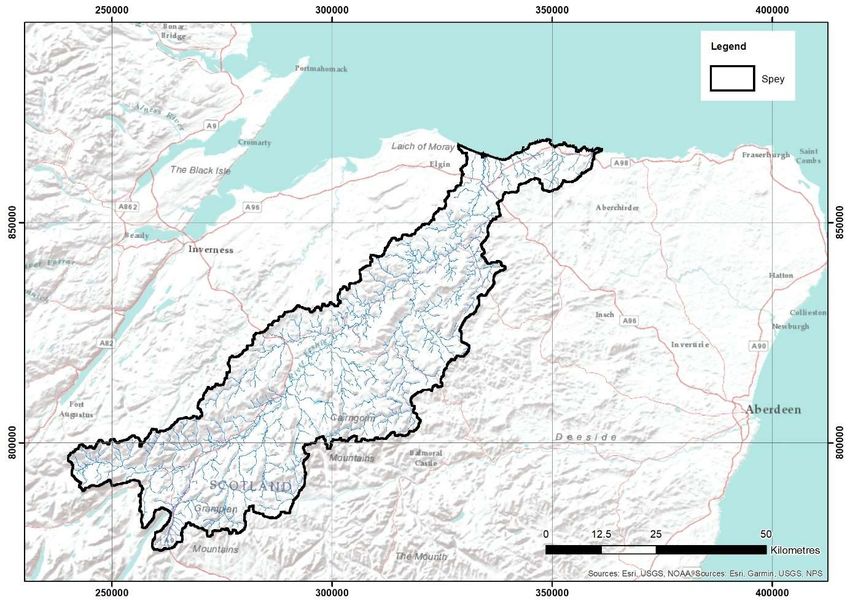
Spey Fishery Board                                                                                                                 January 2021
River Spey Abstractions 2021; Water Resource Management Now and Implications for the Future

Tables
Table 3.1:   Main types of consented abstractions in the Spey ....................................................................... 5
Table 3.2:   Consented abstractions in the Spey (2018) .................................................................................. 5
Table 3.3:   Details of consented abstractions retained in the Spey and transferred out (2018) ............... 6
Table 3.4:   Changes in CAR consented abstractions in the Spey between 2008 and 2018 ...................... 7
Table 3.5:   Comparison in the range of licensed abstractions in the Spey between 2008 and 2018....... 7
Table 3.6:   Largest consented water abstractions in the Spey (2018).......................................................... 7
Table 3.7:   Comparison between consented and actual abstractions in 2018 by abstraction type .......... 8
Table 3.8:   Comparison between consented and actual abstraction in 2018 by largest abstractors ....... 8
Table 4.1:   River Spey flow gauging stations .................................................................................................. 10
Table 4.2:   Major hydro scheme water transfer details ................................................................................. 16
Table 4.3:   Predicted flow regimes at flow transfer intakes .......................................................................... 20
Table 4.4:   Predicted flows and water transfer losses ................................................................................... 20
Table 4.5:   Consented and actual abstraction rates in 2015 and 2018 ....................................................... 21
Table 4.6:   Consented and actual water abstractions for water transfers .................................................. 22

                                                                                                                                                iii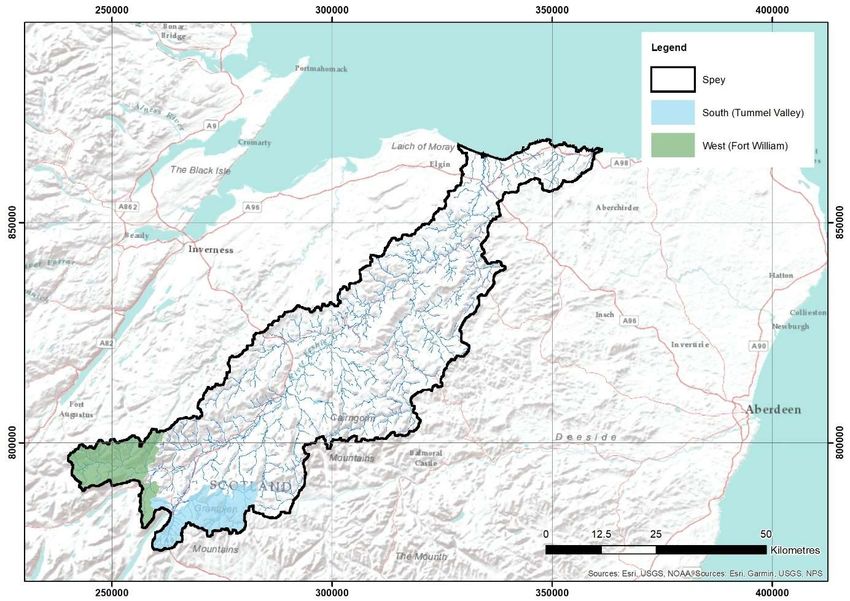
Spey Fishery Board                                                                            January 2021
River Spey Abstractions 2021; Water Resource Management Now and Implications for the Future

1          INTRODUCTION

1.1        Terms of Reference
EnviroCentre Ltd. were commissioned by the Spey Fishery Board to undertake an update to the
independent review of water abstractions from the River Spey catchment undertaken in 2008.

1.2        Scope of Report
It is over 11 years since the work contained in the 2008 abstractions report was produced. In this time
there have been changes to the amount and distribution of abstractions within the catchment of the
River Spey, an increased baseline dataset of river flows has been recorded and updates to the
government’s future climate change predictions have been published.

The scope of the update will be to examine how these changes may inform the understanding of the
water resources within the River Spey from the perspective of the Spey Fishery Board. It will also
review the progress in catchment management terms since the initial report in 2008 and consider what
forward priorities are likely to be. The main focus is summarised as follows:

    •    Update and review the catchment abstraction information, flow data analysis and catchment
         water balance;
    •    Review the impact of abstractions at present and consider the implications of the most recent
         climate change;
    •    Consider the potential effect of future potential changes to the abstraction regime on the
         present river flow regime;
    •    Review how the above may alter the river conditions over time, in particular on salmon and
         freshwater pearl mussels.
    •    Gauge progress in catchment management terms since the previous report and consider
         forward recommendations to improve the management of the river, now and in the future.

1.3        Report Usage
The information and recommendations contained within this report have been prepared in the specific
context stated above. Whilst the Client has a right to use the information as appropriate, EnviroCentre
Ltd retain ownership of the copyright and intellectual content of this report. EnviroCentre do not accept
liability to any third party for the contents of this report unless written agreement is secured in
advance, stating the intended use of the information. EnviroCentre accept no liability for use of the
report for purposes other than those for which it was originally provided, or where EnviroCentre have
confirmed it is appropriate for the new context.

                                                                                                         1
Spey Fishery Board January 2021
River Spey Abstractions 2021; Water Resource Management Now and Implications for the Future
2 OVERVIEW OF 2008 SPEY ABSTRACTION REPORT
In 2007 the Spey Fishery Board was being consulted on various proposals for changes to existing
water abstractions and creation of new water abstractions within the Spey. Through this, they had
identified that there was a lack of a holistic river basin approach by any agency to assess the water
abstractions and their potential impact on the fisheries within the Spey. As a consequence of this, the
Spey Fishery Board commissioned EnviroCentre to undertake an independent review of the water
abstractions from the River Spey catchment area and assess the impact of this in relation to their role
in effectively managing the fisheries and fish populations.
The study was structured to initially examine and review the demand on water resources of the River
Spey, and to detail the pressures on the Spey. A water balance for the River Spey was developed to
characterise the magnitude of existing water abstractions and inter-basin transfers. The effect of these
on the habitat of the river was considered and critical flow periods examined. It concluded with a
series of recommendations for a suitable way forward to improve and better inform future decisions.
The main findings and outputs of the report produced in 2008 were as follows:
There has historically been a lack of joined up thinking in the management of water resources on a
holistic catchment wide basis. Such an assessment was one of the recommendations made in the
2003 Spey Catchment Management Plan.
Water abstraction and transfer rights are set out in legislation, either through individual Acts or
under the Controlled Activities Regulations.
The major water abstractions within the Spey (distilleries, public water supply and fisheries)
amount to a water demand of 2% of the mean annual flow flowing out into Spey Bay. The local
impacts can be important, especially public water supply requirements during periods of low flows.
Water is abstracted and transferred out of the catchment to hydro power schemes via Loch
Laggan to the west and Loch Ericht to the south. There are no clear records detailing the amount
of water transferred, however it has been estimated that it is between 19-49% of the mean annual
flow at Kinrara or between 9-19% of the mean annual flow to Spey Bay.
The effect of these abstractions and transfers on the River Spey and its tributaries is a reduced
flow regime. Downstream of transfer points in the upper catchment where no compensation flows
are released, channels can frequently run dry. Compensation flows where provided tend to
produce a very constant flow regime which removes the majority of the high and low flow variation,
changing what would naturally be a very dynamic habitat.
Two proposals were reviewed that focused on increasing the demand on water resources before
examining what improvements can be achieved using the existing resources. Measures should be
put in place to maximise the management of these existing resources before increasing demand.
The effect of the abstractions and transfers are most sensitive during low flows when the wetted
habitat is reduced. In these conditions water abstractions that have little flexibility in their
operational demand become the most critical activities, which include public water supplies.
There is a clear opportunity provided by the Water Framework Directive and other legislation to
improve the management of the existing regulated flows. Existing agreements should be reviewed
to provide a new, more varied flow regime to encourage increased wetted habitat and improve the
river habitat without altering the amount of water transferred.
2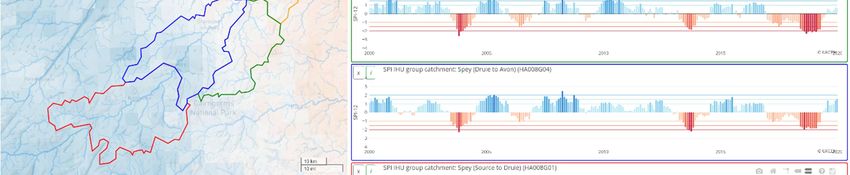
Spey Fishery Board January 2021
River Spey Abstractions 2021; Water Resource Management Now and Implications for the Future
3 RIVER SPEY ABSTRACTIONS AND WATER TRANSFERS
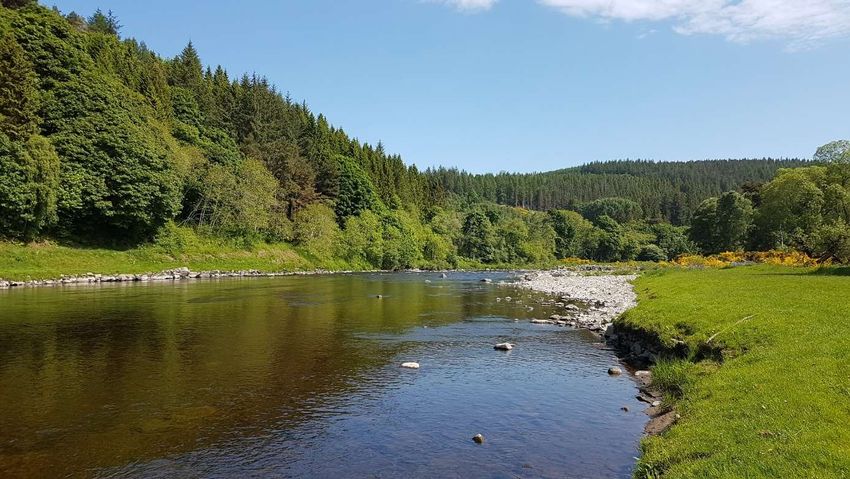
3.1 The River Spey as a Water Resource
The water resources of the River Spey are a highly valued resource. It is of importance for sustaining
the natural resources, for which the River Spey has been designated a Special Area of Conservation
(SAC), as well as being an important resource for providing a public water supply, power generation,
agriculture and local industry especially the numerous distilleries. The benefits of these resources
extend outwith the River Spey catchment boundary, with water transferred out of the natural river
basin for public water supply, power generation and whisky production.
The importance of the water resources are core to the objectives of the Spey Catchment Management
Plan, which was initially developed in 2003 and recently updated in 2016. The need to better
understand and deal with the issues associated with river flows and abstraction regimes within the
catchment is a key objective with the plan, while other objectives rely on this understanding to be
successfully delivered.
The river flow regime is critical to the sustaining the surrounding morphology, ecology and biodiversity
as highlighted in Figure 3.1.
Flow regime is important in maintaining physical habitat in rivers.
The occurrence of less frequent channel-forming flows (bankfull flow, flushing flows and floodplain
flows) are important in natural river systems.
Suitable hydraulic conditions that sustain aquatic life is of more interest than discharge alone.
Reduced flows have indirect effects on aquatic life such as plant growth, temperature changes,
water quality changes and effects on sediment erosion and deposition.
Reduced depth and wetted area will lower the availability of suitable habitat, which may be severe
for fish but less severe for invertebrates, provided that adverse conditions are not prolonged.
Good diversity can still be found at low flows, provided that habitat heterogeneity is maintained.
Atlantic salmon require specific flows at different stages of their life cycle: spawning and nursery
areas need to be accessible, adequate holding areas are required to provide shelter for fish, and
summer flows must be sufficient to maintain adequate depth and velocity in juvenile rearing areas.
Sufficient flow must be provided for salmon to negotiate obstacles.
The effect of flow on instream biota is important but may be masked by environmental factors.
The crucial factor in the maintenance of stream integrity is the timing and nature of disturbance.
Figure 3.1: Summary of key ecological conditions driven by river flow regime
Water resources can be quantified in different ways depending upon the volumes or flow rates of
interest, with some typical terms being cubic metres per second [m3/s], mega litres per day [Ml/d], or
litres per second [l/s]. For the purposes of this report, water resources will be expressed in terms of a
flow rate in cubic metres per second, or cumecs.
3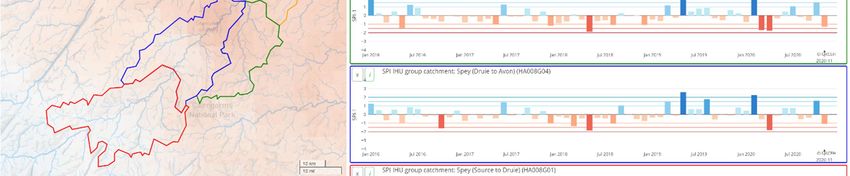
Spey Fishery Board                                                                             January 2021
River Spey Abstractions 2021; Water Resource Management Now and Implications for the Future

3.2        Regulation of Abstractions
All existing and new abstractions are now regulated in accordance with The Water Environment
Controlled Activities (Scotland) Regulations 2011 (as amended), which is commonly referred to as
Controlled Activities Regulations (CAR). These regulations are implemented by the Scottish
Environment Protection Agency (SEPA) and any abstractions greater than 50 m3/day, (0.0006 m3/s)
require a licence to operate.

The present Controlled Activities Regulations first came into place in April 2006, before being
subsequently updated in 2011, and amended in 2013 and 2017. These regulations provided the first
framework for consistently consenting all abstractions from the water environment. Prior to this, formal
consent to abstract was limited to large scale abstractions, which took the form of Acts of Parliament
for the major hydro power schemes and Water Orders for large public water supplies, with the majority
of abstractions being subject to local landowner agreements.

At the time of the 2008 Abstraction Report, the Controlled Activities Regulations were in the early
stages of implementation, with existing consents being transposed into the required licences. The
hydro power schemes did not have licences in place and many of the other abstractions were in the
process of quantifying the amount of water they were abstracting.

Where existing abstractions have been identified as having adverse impacts, there is a programme of
measures agreed within River Basin Management cycles to improve these conditions. Any new
abstractions will have licence conditions agreed at the outset to protect the water environment.

3.3        Consented Abstractions
The consented abstractions from the Spey catchment active in 2018 have been provided by SEPA.
These have been reviewed and compared to the previous information available on abstractions from
2008. The consented abstractions have been grouped into main types of use as listed below and
detailed in Table 3.1 along with a summary of the main associated abstractions:

    •    Hydro Power;
    •    Distillery;
    •    Fisheries;
    •    Public Water Supply; and
    •    Agriculture.

A summary of the consented water abstractions in 2018 is presented in Table 3.2. This identifies a total
of 51 sites with registered abstractions and a total of 74 individual abstraction locations within these
sites. Abstraction consent is typically expressed as an annual volume of water, which can then be
averaged out through the year as an annualised flow. The abstraction consent is shown as the
annualised flow in Table 3.2. The largest consented abstractions are for hydro power, which although
only have three sites, account for 92% of all the consented abstractions from the Spey catchment and
are located in the upper Spey catchment. Distilleries are the next largest abstractor, accounting for
6% of the total consented resource, although with 33 sites, they represent 65% of all licenced
abstraction sites, which tend to be more concentrated in the lower Spey catchment. The remaining
abstractors comprising of fisheries, public water supply and agriculture, collectively account for the
remaining 2% of consented abstractions within the Spey catchment.

In addition to these larger licenced abstractions, there will be smaller abstraction within the catchment,
such as those for private water supplies which fall below the CAR licensing threshold (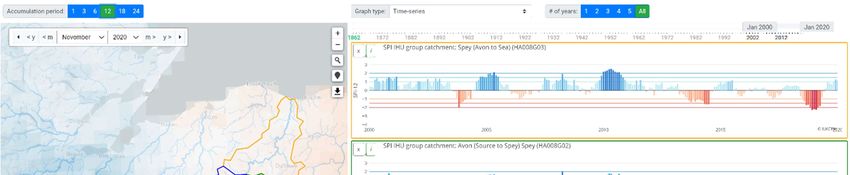
Spey Fishery Board                                                                                  January 2021
River Spey Abstractions 2021; Water Resource Management Now and Implications for the Future

Table 3.1: Main types of consented abstractions in the Spey
 Abstraction Use     Description
 Hydro Power         The headwaters in the west of the catchment are utilised for hydro-electric
                     power generation by the Fort William Aluminium Smelter and the Scottish and
                     Southern Energy (SSE) Tummel Valley hydro scheme. These two large hydro
                     schemes had abstractions consented by Acts of Parliament, that have since
                     been transposed into CAR licences. The flows abstracted from these two
                     schemes are effectively water transfers out of the catchment as the water
                     does not get returned to the Spey and is lost as a resource to the river.
                          More recently another mini-hydro scheme has also been developed and the
                          abstraction licensed. The flows from such mini-hydro schemes are returned to
                          the river with no net loss, although there are depleted flow reaches between
                          the abstraction and return points.
 Distillery               Distilleries are major abstractors of water, both for the manufacture of whisky
                          and to use as cooling water. The distilleries are generally concentrated in the
                          Lower Spey and have recently come under regulation for their abstractions
                          through the CAR licensing regime. The water used for cooling purposes will
                          largely be returned to the Spey, reducing the net loss of water to the river,
                          although there may be thermal impacts from the returning water temperature.
 Fisheries                The Rothiemurchus Fisheries and Glenmore Hatchery have abstraction
                          licences. Although these abstractions are relatively high, the water is
                          generally all returned to the river, reducing any significant net loss in the
                          quantity of water to the Spey, although not necessarily the quality.
 Public Water             Scottish Water provides a public water supply to serve the local population for
 Supply                   domestic and commercial use. The population centres are served by six main
                          supplies at Fochabers (Dipple), Aviemore, Tomnavoulin, Blairnamarrow,
                          Laggan and Dalwhinnie.
                          The largest single supply is the wellfield at Dipple, near Fochabers, which is
                          largely transferred out of the catchment for use elsewhere. The other supplies
                          will eventually return water to the Spey after passing through wastewater
                          treatment works, reducing the net loss of water to the river.
 Agriculture              Abstractions for agriculture tend to be in the lower reaches of the catchment
                          and overall have a relatively low demand, although the timing of that demand
                          can also coincide with when resources may be most constrained.

Table 3.2: Consented abstractions in the Spey (2018)
 Type                          Sites       Locations                        Abstraction        % of Total
                                                                             Consent          Abstraction
                                                                              (m3/s)           Consent
 Hydro Power                             3                   4                 46.799             92%
 Distillery                             33                  51                  2.969               6%
 Fisheries                               2                   2                  0.738               1%
 Public Water Supply                     6                   6                  0.409               1%
 Agriculture                             7                  11                  0.003               0%
 Total                                  51                  74                 50.918            100%

                                                                                                              5
Spey Fishery Board January 2021
River Spey Abstractions 2021; Water Resource Management Now and Implications for the Future
The majority of the abstraction sites result in a proportion of flow being lost to the Spey, however a
proportion of the abstracted flow will be returned to the Spey, and associated impacts will include
reaches that have depleted flows or local alterations to water quality and/or temperature. The
proportion of flow returned will depend on the use of the abstracted flow.
There are three main sites that involve abstraction where the entire abstraction volume is then
transferred out of the Spey catchment and entirely lost as a resource to the river. These comprise of
two hydro power schemes abstracting direct from rivers for the Fort William Aluminium Smelter and
the Scottish and Southern Energy Tummel Valley hydro scheme, with the third being the public water
supply abstracted from the riverbank sands and gravels at the Dipple wellfield. The two hydro
schemes represent 91% of the entire consented abstraction from the Spey, and 99% of the consented
abstraction transferred out of the catchment. These water transfer abstractions have a significant
impact on the local water resources available as none of the water is returned to the Spey.
The details of the abstractions that part-return a proportion of flows to the Spey and those that transfer
water entirely out of the Spey are provided in Table 3.3.
Table 3.3: Details of consented abstractions retained in the Spey and transferred out (2018)
Type Sites Locations Abstraction % of Total
Consent Abstraction
(m3/s) Consent
Abstraction Part-Returned to the Spey
Hydro Power 1 1 0.650 15%
Distillery 33 51 2.969 67%
Fisheries 2 2 0.738 16%
Public Water Supply 5 5 0.096 2%
Agriculture 7 11 0.003 0%
Total 48 70 4.456 100%
Water Transferred Out of the Spey
Hydro Power 2 3 46.149 99%
Public Water Supply 1 1 0.313 1%
Total 3 4 46.462 100%
A comparison of the consented abstractions in 2018 is made with those consented in 2008 as shown
in Table 3.4. The main changes have been the inclusion of the large hydro power schemes within the
CAR licensing regime, along with an increase in the number of consented abstractions for distilleries
which has doubled the overall distillery abstraction volumes. The inclusion of the hydro power
schemes do not represent new abstraction activities, but a transfer of the abstraction consenting
regime from a site specific Act of Parliament to the CAR regime.
The range in abstraction volumes across the 2018 consented sites is provided in Table 3.5 and is
compared to the consents in place in 2008. This shows an increase at the larger end of consents,
again reflecting the inclusion of the larger hydro power schemes, although there is a trend for a
general increase across all bandings shown.
The top ten largest abstraction consents are provided in Table 3.6, which includes hydro power,
distilleries, fisheries and public water supply. The abstractions that involve water transfers out of the
catchment are present within this list and represent the top three largest consented abstractions.
6Spey Fishery Board January 2021
River Spey Abstractions 2021; Water Resource Management Now and Implications for the Future
Table 3.4: Changes in CAR consented abstractions in the Spey between 2008 and 2018
Type 2008 2018 Change 2008 2018 Change
Sites Sites Consent Consent (m3/s)
(m /s)
3
(m /s)
3
Hydro Power 0 3 +3 0.000 46.799 +46.799
Distillery 24 33 +9 1.504 2.969 +1.465
Fisheries 2 2 0 0.703 0.738 +0.035
Public Water Supply 6 6 0 0.399 0.409 0.010
Agriculture 11 7 -4 0.097 0.003 -0.094
Grand Total 43 51 +8 2.703 50.918 +48.215
Abstraction Part- 42 48 +6 2.390 4.456 +2.066
Returned to the Spey
Water Transferred Out 1 3 +2 0.313 46.462 +46.149
of the Spey
Table 3.5: Comparison in the range of licensed abstractions in the Spey between 2008 and 2018
Abstraction Range Number of Licensed Abstractions
(m3/s) 2008 2018
Sites Locations
>0.5 1 5 6
0.1-0.5 4 5 4
0.05-0.1 8 9 10
0.025-0.05 10 12 14
0.005-0.025 11 7 18Spey Fishery Board January 2021
River Spey Abstractions 2021; Water Resource Management Now and Implications for the Future
3.4 Actual Abstractions
The CAR licensing regime requires operators of abstraction activities to record the quantities of water
abstracted and provide annual returns to SEPA to confirm they are compliant with their licenced
operating conditions. The returns for 2018 have been provided by SEPA and reviewed in relation to
the consented totals by type of abstraction (Table 3.7), and also by the largest abstractions (Table 3.8).
This review and comparison identifies that the actual abstractions were all much lower than the
consented totals, being typically 25% to 30% of the total, with the exception of the fisheries which was
60%. When the individual largest abstractors were reviewed, the range in amount abstracted
compared to the consent was much greater, ranging from 5% to nearly 80%. This single year presents
a snapshot, and it is recognised that 2018 was a drier than average year. A comparison between
actual recorded abstractions between 2018 and a wetter than average year (2015), indicates that the
total actual abstractions during the wetter year were 18% higher, reflecting the greater availability of
flows throughout the year, which still remained within all the consented amounts.
Table 3.7: Comparison between consented and actual abstractions in 2018 by abstraction type
Type Consented Actual 2018 % of Consent
Abstraction Abstraction Abstracted
(m3/s) (m3/s)
Hydro Power 46.799 11.680 25%
Distillery 2.969 0.796 27%
Fisheries 0.738 0.426 58%
Public Water Supply* * n/a *
Agriculture 0.003 0.000 13%
Grand Total 50.509 12.902 26%
Total Abstraction (Retained in Catchment) 4.360 1.400 32%
Transfers Out of Catchment 46.149 11.503 25%
* The SEPA 2018 data returns reviewed do not confirm the consented and actual abstractions.
Table 3.8: Comparison between consented and actual abstraction in 2018 by largest abstractors
Abstraction Consented Actual 2018 % of
Abstraction Abstraction Consent
(m3/s) (m3/s) Abstracted
Lochaber Smelter - Spey Dam Tunnel 21.991 8.123 37%
Tummel Hydro, Cuaich Power Station 12.700 2.811 22%
Lochaber Smelter, Mashie and Pattack Division 11.458 0.569 5%
Wm Grant & Sons Ltd, Balvenie Distillery 1.111 0.116 10%
Rothiemurchus Fisheries, Aviemore 0.729 0.426 58%
Kingussie Micro Hydro 0.650 0.178 27%
Dipple Wellfield, Fochabers*
Macallan Distillery 0.191 0.087 45%
Aberlour Distillery, Charlestown of Aberlour 0.111 0.061 55%
Wm Grant & Sons Ltd, Glenfiddich Distillery 0.111 0.085 77%
* The SEPA 2018 data returns reviewed do not confirm the consented and actual abstractions.
8Spey Fishery Board January 2021
River Spey Abstractions 2021; Water Resource Management Now and Implications for the Future
4 WATER RESOURCE OF THE SPEY
4.1 Flows in the River Spey
The River Spey drains a catchment area of 2,948 km2 to Spey Bay, while the River Spey District
fisheries management area is slightly larger at 3,172 km2 as shown in Figure 4.1, with the inclusion of
some smaller coastal tributaries.
Figure 4.1: Catchment of the River Spey
A network of river gauges is operated by SEPA throughout the catchment, many of which date back to
the early 1950s. This coincides with the implementation of the major hydro power abstractions / water
transfers. As a result, these flow gauges which provide such a good resource for characterising flows
within the main stem of the River Spey record a flow regime that is already altered by these water
transfers, and therefore not the natural flow regime. Aberlour is the only gauging station which has a
dataset preceding 1951, having records over the period 1938-1974.
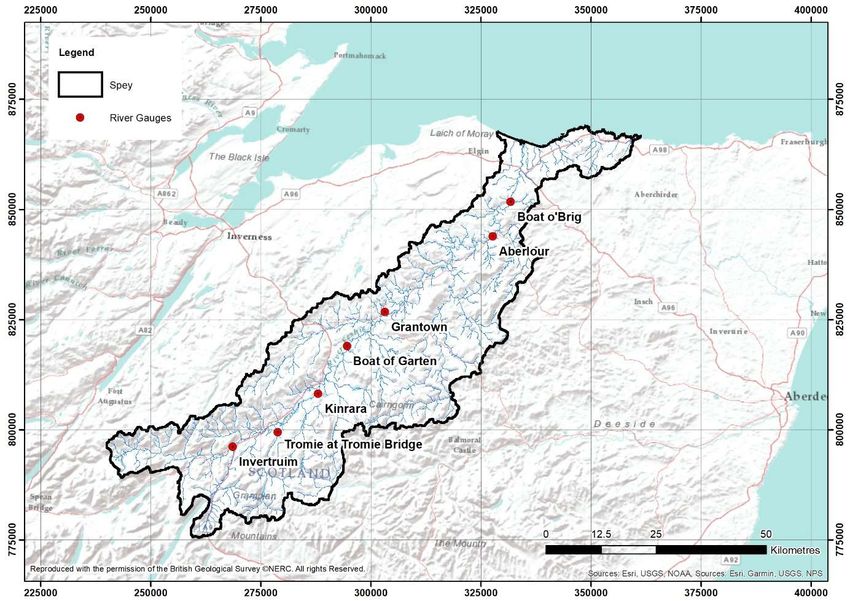
A total of seven gauging stations have been examined in this investigation with daily flow records
where available being provided by SEPA. These gauging stations along with the period of record
examined are summarised in Table 4.1, and their locations shown in Figure 4.2.
9Spey Fishery Board January 2021
River Spey Abstractions 2021; Water Resource Management Now and Implications for the Future
Figure 4.2: SEPA gauging stations
Table 4.1: River Spey flow gauging stations
Gauging Station Period of Record Years
Tromie* 1952 – present 68
Invertruim 1952 – present 68
Kinrara 1951 – present 69
Boat of Garten 1951 – present 69
Grantown 1953 – present 67
Aberlour 1938 – 1974 36
Boat o’Brig 1952 – present 68
‘* The Tromie is a tributary of the Spey that is directly influenced by hydro power abstractions
4.2 Gauged Flows on the Spey
The long term flow records for the gauges on the Tromie, and the main Spey at Invertruim and Boat o’
Brig are provided in Figure 4.3 as flow duration curves. These curves show the percent of time that
river flows were exceeded during the long term dataset. For example, a flow exceeded for 95% of the
time, represents a low flow condition. The scales used are not linear in order to improve the detail
provided at the lower and higher end of flows, and for naturally varying flow conditions, a relatively
straight, sloping line would be expected through the central section of the plot.
The flow duration curves for Tromie and Invertrium are closest to the main hydro water transfers, while
the Boat o’ Brig gauge is furthest downstream on the Spey. The curves for the Tromie and Invertruim
clearly do not demonstrate the typical curve shape expected for natural conditions due to the influence
of abstractions, while at Boat o’ Brig, this influence is less apparent, however can still be detected.
10Spey Fishery Board January 2021
River Spey Abstractions 2021; Water Resource Management Now and Implications for the Future
Figure 4.3: Gauging station flow duration curves
11Spey Fishery Board January 2021
River Spey Abstractions 2021; Water Resource Management Now and Implications for the Future
The effect of the regulation of flows at the water transfer locations is to decrease natural flows to a
near constant level for the majority of the time, in order to maximise the storage and abstraction, while
allowing for spilling during high flows. The result of this is that the majority of the time, flows are
artificially low, while the very lowest flows tend to be kept artificially higher due to compensation flows
being released, only returning to more natural conditions when the compensation flow cannot be met.
Higher flows are less influenced as any abstraction is generally small by comparison. These effects
can be clearly seen on the Tromie flow duration curve where the compensation flow is 1.263 m3/s and
this flow is maintained for a large proportion of the time.
4.3 High Level Water Resource Information
The UK Water Resource Portal is operated by the Centre for Ecology and Hydrology. It provides
access to hydrological information with a graphical user interface. The data available is useful in
understanding hydrological trends and this can be provided in terms or rainfall and to a more limited
extent, river flow data.
With regards to the Spey, there are four hydrological units modelled as shown in Figure 4.4,
comprising of:
the upper Spey to Inverdruie;
Inverdruie to the Avon confluence;
the River Avon; and
the Avon to Spey Bay.
The past 20 years of monthly rainfall data is shown in Figure 4.4 for these hydrological units expressed
in terms of a Standard Precipitation Index (SPI), which benchmarks the monthly rainfall against the
long term average, and in this case, the accumulation period to each month is set to 12 months to
smooth out shorter term monthly variations. Wetter than average periods are shown as blue and drier
than average periods are shown as red. An SPI of greater than +2 or less than -2 is considered to
represent an extreme event. When comparing the four hydrological units, it can be seen that the
trends are similar, however the magnitude and phasing are different which highlights the differences in
available water resources over this period within the individual catchments. This also reflects the
challenges in managing varying pressures across such a large catchment as the Spey.
A similar output is provided in Figure 4.5 which shows the SPI over the past five years with a one
month accumulation period to highlight the monthly variations more than the longer term trends. Again
this shows similar overall trends, with local variations in the magnitude and phasing of the rainfall
across the catchment throughout the year.
12Spey Fishery Board January 2021
River Spey Abstractions 2021; Water Resource Management Now and Implications for the Future
Figure 4.4: Standard Precipitation Index across the Spey (2000-2020) – 12 month accumulation
13Spey Fishery Board January 2021
River Spey Abstractions 2021; Water Resource Management Now and Implications for the Future
Figure 4.5: Standard Precipitation Index across the Spey (2015-2020) – 1 month accumulation
14Spey Fishery Board January 2021
River Spey Abstractions 2021; Water Resource Management Now and Implications for the Future
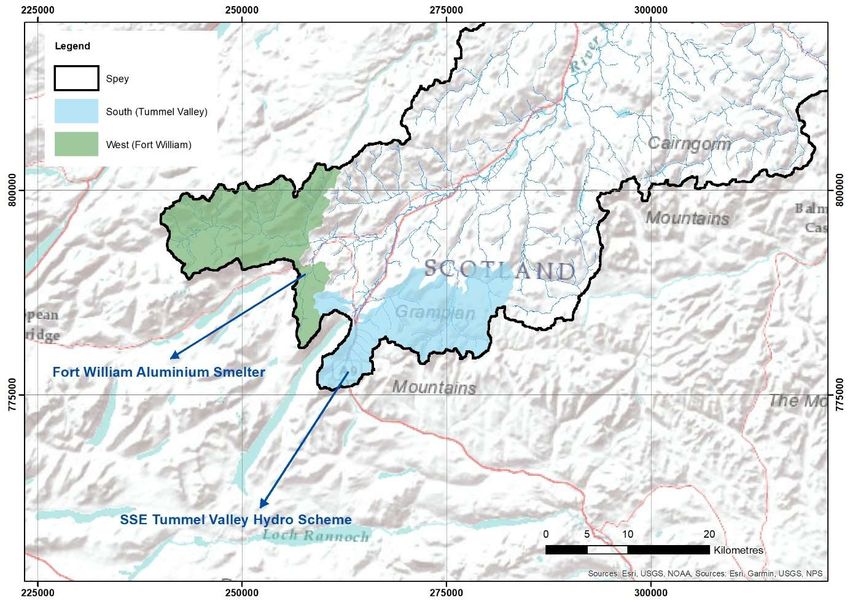
4.4 Water Transfers from Major Hydro Power Schemes
The headwaters in the west of the Spey catchment have been utilised for hydro-electric power
generation by the Fort William Aluminium Smelter and the Scottish and Southern Energy (SSE)
Tummel Valley hydro scheme. This regulated area extends to 390 km2, or 13% of the entire
catchment to Spey Bay, as shown in Figure 4.6. The influence of this is greater in the upper reaches of
the main catchment being 54% to the Spey/Tromie confluence and 39% to Kinrara.
Figure 4.6: Major hydro scheme water transfers from the Spey catchment
Flows from the north-western extents of the Spey catchment are diverted and transferred out of the
catchment to west into Loch Laggan in the River Spean catchment, eventually being used to generate
electricity at the aluminium smelter in Fort William before being discharged to Loch Linnhe. While
flows from the south-western extents of the catchment are transferred south west by SSE to Loch
Ericht in the Tay catchment and into the Tummel Valley hydro-electric scheme, before discharging into
the Firth of Tay at Perth.
The background to the development of these two major hydro schemes is provided in the following
sections, while the technical details of these two main transfers are summarised in Table 4.2, along
with a more detailed view of the regulated catchment from which abstractions are made in Figure 4.7.
15Spey Fishery Board January 2021
River Spey Abstractions 2021; Water Resource Management Now and Implications for the Future
Table 4.2: Major hydro scheme water transfer details
Hydro Scheme Abstration for Water Transfer Details
Fort William Abstraction originally authorised through the Lochaber Water Power Order
Aluminium Confirmation Act 1940.
Smelter There are two abstraction points that abstract flows from a catchment of 205 km2
(Spey Dam 176 km2 and River Mashie 29 km2).
The flow regulation was agreed as follows:
No abstraction to be made if the daily flow was less than 1.420 m3/s.
The balance of the previously agreed flow (1.504 m3/s) to be made
available as freshet flows.
These freshets to be delivered through 22 freshets of 1.420 m3/s
delivered in 22 days from August to November.
Tummel Valley There are five main control features operated by SSE in the Spey catchment
hydro scheme that abstract water from an area extending to 185 km2:
Loch an t-Seilich (Tromie Dam – capacity 4.5 million m3)
The catchment of Loch an t-Seilich is increased by an aqueduct intake on the
Allt Bhran, which along with the aqueduct intake on the Allt na Fearna increases
the regulated catchment area on the River Tromie to 100 km2. A compensation
flow of 1.263 m3/s is released through the fish pass on the dam whenever
available. Above this flow, water is diverted to Loch Cuaich or spilled.
Loch Cuaich (Cuaich Dam – capacity 1.68 million m3)
The Loch Cuaich catchment is increased by the aqueduct from Loch an t-Seilich
and smaller aqueducts from Allt a’Choire Chais and Allt a’Choire Chaim,
providing a catchment of 39km2 (excluding that of Loch an t-Seilich). This flow
passes through Cuaich power station and is then diverted via the Allt Cuaich
weir into an open aqueduct and pipeline to Loch Ericht, with no compensation
flow requirement to the Allt Cuaich.
Cuaich Aqueduct
The aqueduct and intakes that form the control structures diverting water
towards the Tay, only release water back into the Spey when they spill. The
general rule used during the design of these structures was that they could
convey approximately five times the average daily flows.
Truim Intake
The catchment of the River Truim to the intake is 36.3 km2 and a flow of 0.684
m3/s is released continuously down through the fish pass on the intake. If the
flow drops below this, a valve is opened on the pipeline that feeds water from
Allt Cuaich into Loch Ericht. However as there are occasions when this pipe is
empty for various operational reasons, this flow in the Truim is not guaranteed.
Alt an t-Sluie Intake
This intake and small aqueduct drains an area of around 10 km2 and does not
have any compensation arrangements.
16Spey Fishery Board January 2021
River Spey Abstractions 2021; Water Resource Management Now and Implications for the Future
Figure 4.7: Regulated catchment areas for major hydro scheme water transfers from the Spey
4.4.1 Fort William Aluminium Smelter
GFG Alliance is the company that now operates the aluminium smelter at Fort William. A hydro power
scheme was developed to power the smelter in the early 20th century which harnessed water from the
River Spean and used it to generate electricity at Fort William before discharging into Loch Linnhe.
These initial works were progressed following the Lochaber Water Power Act 1921. This legislation
was followed by a further Act of Parliament in 1930 and subsequently by the Lochaber Water Power
Order Confirmation Act 1940, which enabled the head waters of the River Spey to be diverted to the
west and into the River Spean catchment. This set out that no abstraction was to be made if the
recorded flow at Laggan Bridge was less than 40 million gallons per day (2.104 m3/s), based on a
projected flow of 28.6 million gallons per day (1.504 m3/s) at Spey Dam. The 1940 Act was the first of
these three Acts to include a compensation flow from Spey Dam; the previous two Acts were solely
concerned with diverting water away.
The water was controlled by constructing the Spey Dam across the upper River Spey approximately
3.5 km west of Laggan. The catchment area draining to the dam extended to 176 km2, and the
reservoir created allowed the water to back up to Loch Crunachdan, where an intake tunnel was
excavated to channel the water into Loch Laggan at Kinloch Laggan. From there it would eventually
flow to the sea at Loch Linnhe to the west. An additional smaller intake draining 28.8 km2 was also
created on the River Mashie, a tributary of the Spey, which diverted water along an open aqueduct to
the River Pattack and into Loch Laggan.
This original flow regulation was revised through a Minute of Agreement between The Lochaber Power
Company Ltd and The Spey District Board in 1954. This used the flow recorded at the Spey Dam, as
Laggan Bridge was a distance from the dam for operational control and was prone to variations in the
17Spey Fishery Board January 2021
River Spey Abstractions 2021; Water Resource Management Now and Implications for the Future
rating curve due to mobile gravels. Under this 1954 Agreement it was agreed that: no abstraction was
to be made if the daily flow was less than 27 million gallons per day (1.420 m3/s); and that the balance
of the previously agreed flow (1.504 m3/s) would be made available as freshets (planned increased
releases of water from the dam) delivered over 22 days.
4.4.2 Scottish & Southern Energy
The Tummel Valley scheme was initiated in the 1930’s when the Grampian Electricity Supply Company
constructed power stations at Rannoch and Tummel Bridge. The scheme was extended to the north
and into the Spey in the 1940-50’s, with the full extent shown in Figure 4.8. The water draining from
the Spey catchment is very valuable to SSE as it provides ‘green’ renewable energy each time it flows
through either four or five hydro power stations before flowing out to the sea at Perth.
Source: Scottish & Southern Energy
Figure 4.8: The Tummel Valley hydro electric scheme
There are five main control features operated by SSE in the Spey catchment that abstract water from
an area extending to 185 km2, as detailed in Table 4.2. Of these, only Loch an t-Seilich has a
compensation flow agreement. A flow of 1.263 m3/s is released continuously down through the fish
pass on the dam. Above this flow, water is diverted to Loch Cuaich or spilled. The catchment of Loch
an t-Seilich is increased by an aqueduct with an intake on the Allt Bhran, which along with the
aqueduct intake on the Allt na Fearna, give a catchment area within the River Tromie of 100 km2 that is
regulated by abstractions.
The catchment draining to Loch Cuaich is increased by the aqueduct from Loch an t-Seilich and
smaller aqueducts from Allt a’Choire Chais and Allt a’Choire Chaim. This water then passes through
Cuaich power station and the outflow is then diverted at the Allt Cuaich weir into an open aqueduct
and pipeline to Loch Ericht, picking up some smaller tributaries along its length. The additional
catchment area above that of Loch an t-Seilich is around 39 km2.
The intake on the River Truim has a flow that is constantly released, although it is not a true
compensation flow. A flow of 0.684 m3/s is released continuously down through the fish pass on the
18Spey Fishery Board January 2021
River Spey Abstractions 2021; Water Resource Management Now and Implications for the Future
intake. The flow is measured downstream of the intake on the River Truim at Dalwhinnie and if the flow
drops below 0.684 m3/s, a valve is opened on the pipeline that feeds water from Allt Cuaich into Loch
Ericht. However as there are occasions when this pipe is empty for various operational reasons, this
flow in the Truim is not guaranteed. The catchment of the River Truim to the intake is 36.3 km2.
There is also a small aqueduct with an intake on the Allt an t-Sluie to the north of Dalwhinnie. This does
not have any compensation arrangements and drains an area of around 10 km2. It is abstracted by the
distillery for use as cooling water, after which it is pumped back up to enable SSE to divert it into Loch
Ericht.
The aqueducts and intakes that form the control structures diverting water towards the Tay only
release water back into the Spey when they spill. No design checks have been undertaken to establish
at what level they spill, however, a general rule used during the design of these structures was that
they could convey approximately five times the average daily flows.
4.5 Naturalised Flows in the River Spey
The gauged flows downstream of the hydro scheme transfers reflect the impacted nature of the flow
regime after the flows have been diverted. In order to estimate the amount of water diverted out of the
catchment, an estimate has to be made of the naturalised flows.
In the absence of flow records at the points where water is transferred from the upper tributaries of the
Spey into the hydro schemes, hydrological methods for predicting flow regimes in ungauged
catchments have been used. The 2008 Abstraction Report adopted the Institute of Hydrology Report
No. 108: Low Flow Estimation in the United Kingdom, while in this update the hydrological modelling
software LowFlows2 is adopted. This software is founded on the techniques used within the 2008
abstraction report, and has developed the predictions using refinements to the techniques used, along
with adapting to use more spatially varied ground model data sets now available.
This approach has been used to generate naturalised flow duration curves to fixed points. The fixed
points selected include flow gauging stations to allow comparison between predicted flows and actual
gauged flows, and at abstraction points to understand how much resource may be being transferred.
Modelling has been undertaken to estimate the mean annual flow (MAF), median flow (Q50) and low
flow condition (Q95). These have been calculated for each of the transfer locations and also checked
at each of the gauging stations with actual recorded values of mean flow, Q50 and Q95.
The results show that a mean annual flow contribution of up to 15 m3/s is under the influence of
regulated abstractions for water transfer, as summarised in Table 4.3. This approach has been
compared to that used in the 2008 Abstraction Report and it is generally in good agreement, with the
updated predictions generally predicting naturalised flows slightly higher than the previous assessment
technique (mean annual flow +2%, Q50 +6%, and Q95 +21%).
To put these flows into context with the only other main water transfer out of the Spey, the consented
abstraction at Dipple for public water supply is 0.313 m3/s, which is equivalent to the mean annual flow
from the Allt an t-Sluie (0.302 m3/s) near Dalwhinnie, which is entirely diverted to Loch Ericht.
19Spey Fishery Board January 2021
River Spey Abstractions 2021; Water Resource Management Now and Implications for the Future
Table 4.3: Predicted flow regimes at flow transfer intakes
River Sub-Catchment Area Flow (m3/s)
(km2) MAF Q95 Q50
Spey Mashie A 1.96 0.054 0.009 0.032
Mashie B 26.82 0.958 0.144 0.558
Spey 175.95 6.760 0.837 3.638
Total 204.73 7.772 0.990 4.228
Tromie Allt Bhran 29.46 1.038 0.171 0.617
Loch an t-Seilich 62.08 2.526 0.489 1.565
Allt na Fearna 7.74 0.293 0.054 0.183
Total 99.28 3.857 0.714 2.365
Truim Allt Cuaich Weir 33.81 1.245 0.173 0.683
Leacainn Burn 0.59 0.018 0.002 0.010
Allt Coire Bhathaich 5.02 0.191 0.014 0.093
Truim 36.31 1.579 0.135 0.783
Dalwhinnie Burn 1.23 0.039 0.005 0.023
Allt an t-Sluie 8.85 0.302 0.049 0.189
Total 85.81 3.374 0.379 1.781
Overall Totals 389.82 15.00 2.08 8.37
Note: MAF - Mean Annual Flow; Q95 - low flow; Q50 - median flow.
4.6 Modelled Losses from Water Transfers in the Upper Spey
The two gauging stations most affected by the flow transfers are Invertruim (Spey Dam, Loch Cuaich
and Truim Intake) and Tromie (Loch an t-Seilich). Adopting a similar approach to the 2008 Abstraction
Report, to predict the abstraction losses in the upper catchment, the mean annual flow was predicted
to the flow transfer intakes and the gauging station, then the predicted mean flow at the intake was
replaced by the compensation flow, and predicted mean flow at the gauging station revised. This
prediction was then compared to the recorded mean flow at the gauging station. The predicted results
came to within 5% of the gauged value for the Tromie and 1% for Invertruim as shown in Table 4.4.
As a check on this approach, the predicted Q50 for the Aberlour gauging station was calculated and
compared to the recorded data, with the difference being 1%. This can be considered a reasonable
prediction, considering the uncertainties within the data.
Using this method, the mean annual flow expected to be abstracted and transferred from the upper
Spey catchment is 9.95 m3/s, or approximately 66% of the mean annual flow reaching the intakes.
This estimate is similar to the 11.08 m3/s predicted in the 2008 Abstraction Report.
Table 4.4: Predicted flows and water transfer losses
Gauging Predicted Revised MAF Gauged Difference Loss in
Station MAF Prediction MAF (%) MAF
(m3/s) (m3/s) (m3/s) (m3/s)
Tromie Bridge 4.665 2.374 2.504 -5% 2.29
Invertruim 13.86 6.203 6.12 1% 7.66
Aberlour 65.85 55.90 56.354 -1% 9.95
MAF – Mean Annual Flow
Revised MAF Prediction replaces predicted flow to intake with compensation flow.
Difference and loss in MAF is expressed between the gauged MAF and the revised MAF prediction.
20Spey Fishery Board January 2021
River Spey Abstractions 2021; Water Resource Management Now and Implications for the Future
4.7 SEPA Abstraction Consents and Returns
The CAR licensing regime regulated by SEPA requires annual returns to be provided detailing the
amount of flow abstracted under licence. This data has been provided by SEPA for the years 2014 –
2018 for the licenced abstractions on the Spey, with the exception of the public water supplies.
The consented and actual abstraction rates for the main abstraction categories identified are detailed
in Table 4.5 for the years 2018 (most recent data and a dry year) and 2015 (a wet year). These show
that the actual abstractions recorded are only in the order of 25% - 30% of the consented amounts,
however the relative split between uses remains similar, with the large scale hydro power water
transfers representing around 90% of the abstraction amount. The differences between the two years
show that there can be up to a 20% year to year variation based on the resources available.
The annual average loss of flow from the Spey comprises of the water transfer amount, plus the losses
from the remaining abstractions that return flows to the Spey. The transfer flow from 2015 and 2018
provides a range of between 11.8 – 14.3 m3/s, while the total abstraction from the remainder of the
licenced consents was 1.5 m3/s, which with an assumed average loss of 10% would provide a loss of
0.15 m3/s. This would equate to an annual loss in the range of 12 – 15 m3/s on average each year,
99% of which would be experienced in the upper catchment.
Table 4.5: Consented and actual abstraction rates in 2015 and 2018
Type 2018 2015
(drier year) (wetter year)
Consent Actual % Consent % Total Actual % Total
(m3/s) (m3/s) Actual (m3/s) Actual
Agriculture 0.003 0.000 13% 0% 0.000 0%
Distillery 2.969 0.796 27% 6% 0.661 4%
Fisheries 0.738 0.426 58% 3% 0.688 4%
Hydro 46.799 11.681 25% 88% 13.974 89%
Public Water Supply* 0.409 0.409* 100%* 3% 0.409* 3%
Grand Total 50.918 13.312 100% 15.732 100%
Transfers 46.462 11.816 89% 14.29 91%
Balance 4.456 1.496 11% 1.45 9%
* Actual abstractions not provided, so assumed to be 100%.
The consented abstractions have been reviewed in relation to the available water resources based on
the gauged flow data. The consented abstractions for water transfer in the upper catchment are
reviewed in Table 4.6 along with the actual abstraction flows recorded for 2018, which was a dry year,
and 2015, which was a wet year.
It can be seen that the level of abstraction consent exceeds the available resources in the upper
catchment, with the consented abstraction being equivalent to 151% of the long term average flow
recorded at Kinrara. Even allowing for the assumptions made in approximating annual abstractions
and resources in terms of an average annual flow, this is expected to be the case. It is however
recognised that these consented values will have been derived through the transposing of previous
pre-CAR abstraction consents, and that the actual consented flows may not be realistic to achieve.
This is supported by the actual level of abstractions recorded in 2018 and 2015, which are only 30%
and 40% respectively of the consented total.
21You can also read