2019 Water Quality Report - (Consumer Confidence Report) - City of Glendale
←
→
Page content transcription
If your browser does not render page correctly, please read the page content below

2019
    Water Quality Report
      (Consumer Confidence Report)
          www.glendaleaz.com/2019ccr

1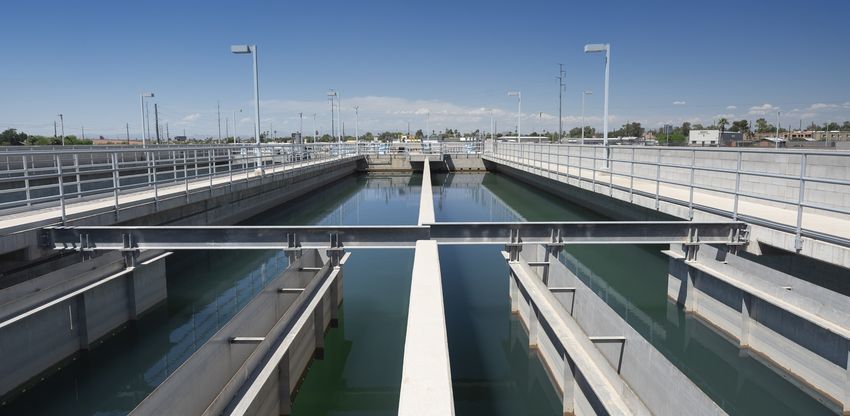
2019 Water Quality Report
                                                                                     Glendale, AZ

A Message from the
Director of Water Services

We are pleased to present our annual Water Quality Report
summarizing the drinking water testing performed in 2019. Although
this report is about water quality, we are happy to share the work and
dedication of our employees. Every day, staff make certain to deliver
high quality, reliable and affordable drinking water. We are dedicated
to providing a secure and sustainable water supply for years to come.

Water is a vital resource for our desert community and the quality of
your drinking water is very important to us. The City tests, analyzes
and monitors water quality many times each day to ensure that the
water provided is clean and safe to use.

The Glendale Water Services Department provides essential services
that protect public health and the environment. Our municipal
water system is a unique community asset to every business and
home in the community we serve.

If you have any questions regarding this report, your drinking water,
or other questions related to our water system, please contact the
Water Services Department by telephone at 623-930-4177 or visit
our new GlendaleOne interface at www.GlendaleOne.com.

Craig Johnson, P.E.
Director, Water Services

This report contains important information about your drinking water. To request a
copy of this report in Spanish, large print, braille or in electronic format, call
623-930-4100. Hearing impaired persons may use the Arizona Relay Services
(800-367-8939).

Este informe contiene información importante sobre su agua potable. Para solicitar
una copia de este informe en español, llame al 623-930-4100.

                                                                                               2
2019 Water Quality Report
                                                                                            Glendale, AZ

Reliability, Quality & Value
in Every Drop

Water is essential to all life and sustains our natural environment. It touches nearly every
aspect of our daily lives, from making coffee in the morning to cleaning the dishes at night.

The Water Services Department takes its responsibility of providing quality and reliable
water, wastewater, environmental and stormwater services very seriously. This 24/7 operation
consists of four water treatment plants, two water reclamation plants, 1,100 miles of
pipes, 8,600 fire hydrants, 64,000 water meters and a myriad of other assets.

Reliability
We maintain a highly-trained workforce, an extensive infrastructure and the appropriate
investments to ensure the delivery of high-quality water today and every day into the future.

Quality
We test, analyze and monitor water quality many times each day to ensure that your water
exceeds high-quality drinking water standards.

Value
We continually look for ways to optimize our processes and the life-cycle cost of assets.
We maintain a financial management system that ensures affordable rates.

The average single-family residence in Glendale uses 9,000 gallons of water and generates
6,800 gallons of wastewater each month. The City can provide water and wastewater
services to residential customers for approximately $2 per day.

 a gallon of     a gallon of     a gallon of      a gallon of         A Gallon of
                                                                   Glendale Tap Water

                                   Bottled
    Wine          Coffee            Water            Milk
  $45.00          $36.00            $5.48           $3.59

On average, a gallon of Glendale tap water costs less than 1¢.
When compared with the costs of other products we use every
   day, tap water is clearly one of the best deals around!
                                                                   Less than 1¢
                                                                                                      3
2019 Water Quality Report
                                                                                              Glendale, AZ

Frequently Asked Questions

How do I know that my water meets all water quality standards?
The U.S. Environmental Protection Agency (EPA) places strict limits on the amount of
contaminants and impurities allowed in drinking water to ensure that your water is safe to
drink. The Food and Drug Administration regulations establish limits for contaminants in
bottled water which must provide the same public health protections.

Drinking water, including bottled water, may reasonably be expected to contain at least small
amounts of some contaminants. The presence of contaminants does not necessarily indicate
that the water poses a health risk. The city of Glendale uses modern treatment processes to
comply with the EPA water standards. The City also has an extensive sampling and water
quality testing programs to ensure water quality standards are met.

More information about contaminants and their potential health effects can be obtained by
calling the EPA’s Safe Drinking Water Hotline at 1-800-426-4791. Information on bottled
water can be obtained from the Food and Drug Administration (FDA).

If I have health problems, how will drinking tap water affect me?
Some people may be more vulnerable to contaminants in drinking water than the general
population. Immuno-compromised persons such as persons with cancer undergoing
chemotherapy, persons who have undergone organ transplants, people with HIV/AIDS or
other immune system disorders, some elderly, and infants can be particularly at risk from
infections. These people should seek advice about drinking water from their health care
providers. EPA and the Centers for Disease Control guidelines on appropriate means to
lessen the risk of infection by Cryptosporidium and other microbial contaminants are
available from the Safe Drinking Water Hotline (1-800-426-4791).

Is it true that drinking water containing high nitrate levels
is a health concern?
Nitrate in drinking water at levels above 10 parts per million is a health risk for infants
less than six months of age. High nitrate levels in drinking water can cause
“blue-baby syndrome.” Nitrate levels may rise quickly for short periods of time because
of rainfall or agricultural activity. If you are caring for an infant, you should ask for
advice from your health care provider. The nitrate level in Glendale’s drinking water
meets safe drinking water standards.

                                                                                                        4
2019 Water Quality Report
                                                                                                 Glendale, AZ

Is a home water treatment system necessary?
The use of a home water treatment system is a personal decision. Some people invest
in home water treatment systems to enhance the taste of water and to further remove
impurities. Home water treatment systems are not needed to make water safe. In fact,
if not properly maintained, home water treatment systems may cause water quality
problems that could affect your health.

All home water treatment devices, including refrigerated water dispensers and ice makers,
need regular maintenance to operate effectively and safely. Follow the operating manual that
comes with your home water treatment system to ensure the system is properly maintained
and operating in accordance with the manufacturer’s directions. Filter cartridges should be
changed on a regular basis as recommended by the manufacturer.

City of Glendale Drinking Water Quality
The following tables show regulated substances that were required to be tested and were
detected in Glendale drinking water in 2019. The tables contain the name of each substance
detected, the highest level allowed by regulation, the ideal goals for public health, the amount
detected and the usual sources of such contamination. Certain contaminants are required to
be monitored less than one time per year because concentrations of those contaminants are
not expected to vary significantly from year to year. For those contaminants that were not
required to be tested in 2019, this report includes data from the most recent required testing.
The presence of contaminants does not indicate that the water poses a health threat, only
that they were detected during routine compliance monitoring. Glendale monitors for many
more substances that were not detected in 2019.

                                                                            Oasis Water Treatment Plant

                                                                                                           5
2019 Water Quality Analysis
This table shows the results of our water quality analysis in 2019. Each substance that was detected in the water,
even in the smallest traceable amount, is listed. The table contains the name of each substance; the highest substance
level allowed by federal regulation; the highest level and range detected and the major sources of each substance.
SUBSTANCE FEDERAL MCL MCLG MAXIMUM RANGE AVERAGE UNITS SOURCES
1
Arsenic 10 0 7.9 ND to 7.9 2.9 PPB Erosion of natural deposits;
runoff from orchards; runoff
from glass & electronics
production wastes
Barium 2000 2000 149 15 to 149 70 PPB Erosion of natural deposits;
discharge of drilling wastes;
discharge from metal refineries
Total Chromium 100 100 39 ND to 39 10 PPB Erosion of natural deposits;
discharge from steel & pulp
mills
Chlorite 1 0.8 0.46 ND to 0.46 0.3 PPM Byproduct of drinking water
disinfection
Chlorine Dioxide MRDL = 800 MRDLG = 800 750 ND to 750 49 PPB Water additive as an oxidant
Fluoride 4 4 0.7 ND to 0.7 0.4 PPM Erosion of natural deposits;
water additive that promotes
strong teeth; discharge from
fertilizer & aluminum factories
2
Nitrate as Nitrogen 10 10 8.0 ND to 8.0 1.4 PPM Runoff from fertilizer use; leaching
from septic tanks & sewage;
erosion of natural deposits
3
Total Organic Carbon TT=1 or Greater N/A 4.4 1 to 4.4 2.8 NA Naturally present in
Removal Ratio Running Annual Avg. the environment
Total Coliforms Presence in no 0 Highest monthly 0% to 0.5% 0.0004% P/A Naturally present in
more than 5% of percentage 0.5% the environment
monthly samples
Chlorine MRDL = 4 MRDLG = 4 1.5 0.07 to 1.5 0.6 PPM Water additive used to
control microbes
Gross Alpha (excluding 15 0 2.1 ND to 2.1 0.8 pCi/L Erosion of natural deposits
Radon & Uranium) (2017)
Combined Radium (2017) 5 0 0.7 ND to 0.7 ND pCi/L Erosion of natural deposits
Uranium (2017) 30 0 4.9 ND to 4.9 1.5 PPB Erosion of natural deposits
4
Turbidity TT=1 NTU N/A 0.532 0.007 to 0.532 0.07 NTU Soil runoff
4
Turbidity TT = >95% of N/A 100% of Samples 0% to 100% 100%=TT NTU Soil runoff
Samples < 0.3 NTUKey to Analysis Tables
AL (Action Level) - The concentration of a contaminant which, if 1. While your drinking water meets the Environmental Protection Agency's
exceeded, triggers treatment or other requirements which a water (EPA's) standard for arsenic, it does contain low levels of arsenic. The EPA's
system must follow. standard balances the current understanding of arsenic's possible health
effects against the costs of removing arsenic from drinking water. The EPA
ALG (Action Level Goal) - The “goal” is the level of a contaminant continues to research the health effects of low levels of arsenic, which is
in drinking water below which there is no known or expected risk to a mineral known to cause cancer in humans at high concentrations and is
health. The ALG allows for a margin of safety. linked to other health effects such as skin damage and circulatory problems.
LRAA (Locational Running Annual Average) - Maximum running The arsenic level for 2019 was well below the 10 PPB MCL.
annual average at the compliance locations.
2. While your drinking water meets EPA standards for nitrate-nitrogen,
MCL (Maximum Contaminant Level) - The highest level of a it does contain low levels of nitrate-nitrogen. The highest 2019 value for
contaminant that is allowed in drinking water. MCLs are set as close nitrate-nitrogen in the city of Glendale’s water supply was 8.0 PPM. The
to MCLGs as feasible using the best available treatment technology. average value for the year was 1.4 PPM.
MCLG (Maximum Contaminant Level Goal) - The level of a
3. Total organic carbon (TOC) has no health effects. However, total organic
contaminant in drinking water below which there is no known or carbon provides a medium for the formation of disinfection byproducts.
expected risk to health. MCLGs allow for a margin of safety. These byproducts include trihalomethanes (THM) and haloacetic acids (HAA).
MRDL (Maximum Residual Disinfectant Level) - The highest level of Drinking water containing these byproducts in excess of the MCL may lead to
a disinfectant allowed in drinking water. There is convincing evidence adverse health effects, liver or kidney problems, or nervous system effects
that the addition of a disinfectant is necessary for control of microbial and may lead to an increased risk of getting cancer.
contaminants.
4. Turbidity is a measure of the cloudiness of the water. We monitor turbidity
MRDLG (Maximum Residual Disinfection Level Goal) - The level of because it is an indicator of the effectiveness of our filtration system.
disinfectant added to drinking water at which there is no known or
expected risk to health. MRDLGs do not reflect the benefits of the use 5. Total Haloacetic Acids (HAA5): The sum of concentrations of mono-, di-,
of disinfectants to control microbial contamination. and trichloroacetic acids and mono-and dibromoacetic acids, which are
byproducts of adding chlorine to water to kill harmful germs. The range of the
Minimum Reporting Limit (MRL): - The smallest measured results for Stage 2 HAA5 DBP monitoring for 2019 was 5.2 to 18 PPB. Water
concentration of a substance that can be reliably measured by a given samples are collected for total haloacetic acids quarterly at 12 locations
analytical method. within the city. Stage 2 HAA5 DBP values are calculated as a locational
Range - The highest and lowest measurements reported during the year. running annual average.
TT (Treatment Technique) - A required process 6. Total Trihalomethanes (TTHM): The sum of concentrations of chloroform,
intended to reduce the level of a contaminant bromodichoromethane, dibromochloromethane and bromoform, which are
in drinking water. byproducts of adding chlorine to water to kill harmful germs. The range of
mg/L = Milligram Per Liter the results for Stage 2 TTHM DBP monitoring for 2019 was 31.4 to 69.4 PPB.
Water samples are collected for TTHMs quarterly at 12 locations within the
N/A = Not Applicable city. Stage 2 TTHM DBP values are calculated as a locational running annual
ND = Not Detectable at reporting limit average.
PPM =
NTU = Nephelometric Turbidity Units
(a measure of water clarity)
one drop in 7. The EPA requires us to monitor for lead and copper every three years. There
13.6 gallons were 85 households tested for lead and copper in 2018. The next testing will
NG = No MCLG established be conducted in 2021.
pCi/L = Picocuries Per Liter
Copper: Copper is an essential nutrient, but some people who drink water
(a measure of radioactivity) containing copper in excess of the action level over a relatively short amount
PPB = one drop in
PPM = Parts Per Million, of time could experience gastrointestinal distress.
or milligrams per liter (mg/L)
13,563 gallons
Lead: Infants and children who drink water containing lead in excess of the
PPB = Parts Per Billion,
action level could experience delays in their physical or mental development.
or micrograms per liter (µg/L) PPT = one drop in Adults who drink this water over many years could develop kidney problems
PPT = Parts Per Trillion, 13,563,368 gallons or high blood pressure.
or nanograms per liter (ng/L)
If present, elevated levels of lead can cause serious health problems,
P/A = Presence / Absence especially for pregnant women and young children. Lead in drinking water is
Cryptosporidium - The city of Glendale did not detect any primarily from materials and components associated with service lines and
home plumbing. The city of Glendale is responsible for providing high quality
Cryptosporidium in its source water during tests conducted in
drinking water but cannot control the variety of materials used in plumbing
2019. Cryptosporidium is a microbial pathogen found in surface components. When your water has been sitting for several hours, you can
water throughout the U.S. Ingestion of Cryptosporidium may cause minimize the potential for lead exposure by flushing your tap for 30 seconds
cryptosporidiosis, an abdominal infection. Symptoms of infection to 2 minutes before using water for drinking or cooking. If you are concerned
include nausea, diarrhea, and abdominal cramps. Most healthy about lead in your water, you may wish to have your water tested. Information
individuals can overcome the disease within a few weeks. on lead in drinking water, testing methods and steps you can take to minimize
exposure are available from the Safe Drinking Water Hotline or at
However, immuno-compromised people, infants, small children and www.epa.gov/safewater/lead.
the elderly are at greater risk of developing life-threatening illness.
If you live in a house built between 1982 and 1986 and are interested in
Although filtration removes Cryptosporidium, the most commonly-used participating in the next Lead and Copper Rule sampling event in 2021,
filtration methods cannot guarantee 100 percent removal. Monitoring contact us at waterqualitylab@glendaleaz.com.
indicates, although infrequent, these organisms are present in our
source water. Current test methods do not allow us to determine if the
organisms are dead or if they are capable of causing disease. 72019 Water Quality Report
Glendale, AZ
UCMR STUDY
METALS MINIMUM MAXIMUM AVG. UNITS SOURCES
Germanium Total ICAP/MS ND 0.45 0.32 PPB Naturally-occurring element; commercially
available in combination with other
elements and minerals, a byproduct of
zinc ore procession, used in infrared
optics, fiber-optic systems, electronics
and solar applications.
Manganese Total ICAP/MS ND 9.1 2.32 PPB Naturally-occurring element; commercially
available in combination with other
elements and minerals, used in steel
production, fertilizer, batteries and
fireworks, drinking water and wastewater
treatment chemical; essential nutrient.
Bromide 51 140 89 PPB Naturally present in the environment.
Total Organic Carbon (TOC) 2.0 4.4 3.19 PPM Naturally present in the environment.
Total HAA6Br 8.6 22 16 PPB Byproduct of drinking water disinfection.
Total HAA9 12 35 26 PPB Byproduct of drinking water disinfection.
SUBSTANCES OF FREQUENT INTEREST
Fourth Unregulated Contaminant Monitoring Rule (UCMR4)
ANALYTE UNITS RANGE AVG. Under the 1996 amendments to the federal Safe Drinking
Water Act, the U.S. Environmental Protection Agency is
Alkalinity PPM 66 – 233 139 required once every five years to issue a new list of up to 30
Aluminum PPB ND – 252 140 unregulated contaminants for which public water systems
must monitor. The intent of this rule is to provide baseline
Bromide PPM ND – ND ND occurrence data that the EPA can combine with toxicological
Calcium PPM 26.5 – 83.5 59 research to make decisions about potential future drinking
water regulations. We are currently going through the fourth
Chloride PPM 29 – 267 87 round of this constituent testing.
Iron PPB ND – 60 14
The UCMR4 requires that each public water system conduct
Magnesium PPM 12.1 – 50.4 22 monitoring of their potable water systems during 2018-2020.
Manganese PPB ND – 20.8 8 The city of Glendale was required to begin monitoring for
the UCMR4 during the 4th quarter of 2018 and continued
Potassium PPM ND – ND ND monitoring into 2019. Four (4) consecutive quarters of
PFOS* PPT ND – 10 3 monitoring are required to meet the federal requirement.
This includes monitoring for a total of 30 chemical
PFOA** PPT ND – 16 3 contaminants: ten cyanotoxins (nine cyanotoxins and one
Sodium PPM ND – 206 82 cyanotoxin group) and 20 additional contaminants (two
metals, eight pesticides plus one pesticide manufacturing
Sulfate PPM ND – 258 157 byproduct, three brominated haloacetic acid [HAA]
Hardness Grains/Gal. 6.8 – 16.9 9.2 disinfection byproducts groups, three alcohols and three
semi-volatile organic chemicals [SVOCs]).
Hardness PPM 116 – 290 237
pH Std. Units 7.5 – 8.0 7.8
TDS PPM 326 – 796 545
Temperature (°C) 14.1 – 33.5 21
* Perfluoro octanesulfonic acid
** Perfluoro octanoic acid
82019 Water Quality Report
Glendale, AZ
Water Conservation
The Water Services Department is committed to ensuring a reliable
water supply for Glendale’s future. The City’s Conservation and
Sustainable Living Division assists businesses and residents with
improving indoor and outdoor water efficiency.
For more information about the City’s free green-living classes,
landscape consultations and water conservation incentives visit
www.glendaleaz.com/waterconservation or call 623-930-3596.
Cash for Removing Grass
Glendale water customers can receive a rebate for converting their water-
thirsty grass lawns into desert-friendly landscapes. Save time, water,
how energy and money by making the switch to a water-wise landscape.
much
water Rebate Amount / Grass Removed
will you $ 150 / 500-1500 ft.2 $ 600 / 3501-4500 ft.2
save?
$ 300 / 1501-2500 ft.2 $ 750 / 4501+ ft.2
$ 450 / 2501-3500 ft.2
The average
conversion to
Xeriscape 1. Get free “how-to” information.
can save 50%
or more on
your outdoor
Receive free publications on how to successfully convert grass to
water use! a water-smart landscape by calling 623-930-3760 or visiting
www.glendaleaz.com/waterconservation.
2. Request a free consultation.
Glendale Water Services Department staff provide free, on-site
a 15 x 15 foot landscape consultations to Glendale water customers. We offer
grass area watered
with 3/4 inch of H2O= advice to help you install and maintain a sustainable landscape.
105
gallons
3. Learn about landscape requirements.
Single-family customers must remove at least 500 square feet of grass.
Businesses, HOAs and multi-family customers must remove at least
1,000 square feet of grass and participate in the Landscape Water
per watering!
(that’s 7900 gallons per year!) Budget Program. The converted area must be landscaped with
Arizona-friendly plants (bare soil and artificial grass do not qualify).
4. Call 623-930-3760 to schedule a landscape inspection.
After the inspection, landscapes that meet the criteria will receive
a rebate depending on the amount of grass removed.
92019 Water Quality Report
Glendale, AZ
Water Source Information
Where does Glendale’s water come from?
Glendale uses renewable water supplies from the Salt, Verde and Colorado rivers, and
stored water credits that are earned through the City’s recharge program. In addition,
Glendale can pump a limited amount of groundwater when needed.
Runoff from the Salt/Verde River watershed is stored in a series of lakes operated by the
Salt River Project (SRP). Runoff from the Colorado River watershed is stored in Lake Powell,
Lake Mead and Lake Pleasant then delivered to Arizona through the Central Arizona Project
(CAP) canal.
Salt River Project (SRP) – Snow and rain runoff from the Salt and Verde River watersheds.
Central Arizona Project (CAP) – Snow and rain runoff from the Colorado River watershed.
Groundwater – Underground water pumped from wells.
Reclaimed Water – Treated, recycled wastewater for non-potable use
(landscape, industrial uses, etc.).
Potential Source Water Impurities
The city of Glendale’s raw water sources include rivers, lakes, reservoirs and wells.
As water travels from these sources, it dissolves naturally-occurring minerals and, in some
cases, radioactive material. Water can also pick up substances resulting from the presence
of animals or people. Substances that may be present include:
• Microbial contaminants, such as viruses and bacteria, which may come from sewage
treatment plants, septic systems, agricultural livestock operations and wildlife.
• Inorganic contaminants, such as salts and metals, which can be naturally occurring,
or a result from urban stormwater runoff, industrial or domestic wastewater discharges,
oil and gas production, mining or farming.
• Organic chemical contaminants, including synthetic and volatile organics which are
byproducts of industrial processes and petroleum production. These can also come from
gas stations, urban stormwater runoff and septic systems.
• Pesticides and herbicides, which may come from agriculture, urban stormwater runoff
and residential uses that may come from a variety of sources.
• Radioactive contaminants, which can be naturally occurring or be the result of oil and
gas production and mining activities.
The City treats and processes the water to improve quality and has an extensive water
testing program to ensure water quality standards are met.
102019 Water Quality Report
Glendale, AZ
Water Hardness
Hardness is a measure of calcium and magnesium that are present in water. As water
moves through or over the earth, it picks up these naturally occurring minerals that make
the water “hard.” Usage of the word “hard” in this case refers to the difficulty with which
suds form when using soap. The harder the water, the more soap is required to produce suds.
The amount of hardness in the city of Glendale’s drinking water in 2019 ranged between
116 to 290 PPM or 6.8 to 16.9 grains per gallon. Hard water is not a primary water quality
standard and is not considered to be a health concern. According to the National Research
Council (National Academy of Sciences), hard water generally contributes a small amount
toward the total human dietary need for calcium and magnesium.
Source Water Assessment
In 2003, the Arizona Department of Environmental Quality (ADEQ) conducted source water
assessments of surface water and groundwater sources for the city of Glendale public water
system. The assessments included an evaluation of land uses, such as gas stations, landfills,
dry cleaners, agricultural fields, wastewater treatment plants and mining activities that may
pose a potential water quality risk to city water sources. ADEQ has given the city of Glendale
public water system a high-risk designation for the degree to which its drinking water sources
are protected.
ADEQ categorized all surface water sources as high risk because they are open to the
atmosphere. The overall risk posed to surface water is addressed by the EPA through its
increased monitoring requirement for surface water sources. A designation of high-risk
indicates there may be additional source water protection measures that can be
implemented on a local level. This does not imply that the source water is contaminated,
nor does it mean that contamination is imminent.
To ensure high quality water, the City regularly monitors and treats the water received from
all sources prior to delivery. Glendale also conducts other monitoring and studies to assess
water quality. If any contaminant approaches the drinking water Maximum Contaminant Level
(MCL), treatment is installed or wells are removed from service. The city of Glendale’s top
priority is to provide safe drinking water 24 hours a day, every day.
Information regarding source water assessments is available for inspection at ADEQ,
1110 W. Washington St., Phoenix, Arizona 85007, from 8 a.m. to 5 p.m. Email inquiries
regarding source water assessments may be sent to ADEQ at vs3@azdeq.gov.
For more information, visit the ADEQ website at:
https://azdeq.gov/node/735 or contact the city of Glendale’s Water Services Department
at 623-930-4100.
112019 Water Quality Report
Glendale, AZ
Protecting the Environment
Only Rain in the Storm Drain
Originating from rain, snow or ice melt, stormwater is conveyed through washes and
streams and is naturally stored in ponds, lakes or reservoirs. Natural environments with
no ground disturbance are permeable surfaces allowing stormwater to seep into the soil
providing water for plants, trees, wildlife and humans.
Our roadways, sidewalks, paved areas and rooftops are impermeable surfaces that
are managed to convey water in pipes, channels or canals before they discharge into
waterways. This runoff can collect trash, oils and chemicals that can be harmful to the
environment. Maintenance and inspection of drainage features keep sediment out of
washes and streams. Identifying and stopping illicit discharges like pool water or paint
disposal into streets or alleys ensures chemical pollutants do not enter the drainage system.
Federal and state laws have been established to reduce the amount of sediment and
pollutants in stormwater. On construction projects, stormwater is temporarily managed
using control measures or best management practices (BMP’s). Examples include erosion
control logs, sediment control fences and mesh blankets. Permanent BMP’s are designed to
remain in place. Examples include check dams, soil stabilizers and revegetation.
In the United States, low impact development (LID) is an innovative approach to managing
stormwater. Examples include permeable paving, rain gardens and on-site retention designs.
These practices provide benefits downstream and can also provide habitat for wildlife in the
urban environment.
How can you reduce stormwater pollution?
• While walking your pets, pick up pet waste and dispose of it appropriately.
• Use pesticides according to the manufacturer's label and apply only when it’s not raining.
• Sweep driveways and sidewalks and dispose of debris in the trash can.
• Remove debris from your rain gutters.
• Never dump anything in storm drains or in washes.
• Wash vehicles at the carwash, not in the driveway or street.
• Drain or backwash your pool water into the sanitary sewer, not into the street.
• Fix vehicle leaks and return used automotive fluids at an auto parts store.
For more information on keeping Glendale clean and green visit www.glendaleaz.com/
Live/City_Services/environmental_protection or to learn more about the importance of
stormwater, visit www.azstorm.org.
122019 Water Quality Report
Glendale, AZ
Pain in the Drain
Avoid discarding unwanted medications down the toilet or sink. Many medications cannot be
broken down at a water reclamation facility.
Option 1 – Keep medication in its container and place it into a MedReturn Drug Collection
Unit* at the following Glendale police stations:
Foothills Station - 6255 W. Union Hills Dr.
Gateway Station - 6261 N. 83rd Ave.
*Does not accept liquid medications or syringes.
Option 2 – Put medication into a sealable bag or container and mix with an undesirable
substance (such as kitty litter or used coffee grounds). Dispose of it in the trash. Keep away
from children and pets.
Option 3 – Contact your pharmacy to see if they collect unused medications.
For more information, visit www.glendaleazwater.com.
Cease the Grease
Fats, oils and/or grease (FOG) have the potential to collect in drains and sewer pipes and can
cause expensive and undesirable clogs. To prevent grease build-up in the sewer pipes, the City
maintains an inspection program of commercial businesses including eating establishments,
auto repair shops, commercial laundries and car washes.
What you can do – Do not put grease down your garbage disposal or sink. For tips on
how to properly dispose of FOG in the sanitary sewer, visit www.glendaleaz.com/cms/one.
aspx?pageId=15330007
Are Water Leaks
Draining Your Piggy Bank?
The average household loses more than 10,000 gallons of water
each year through leaks. Finding and fixing leaks is now easier with
the “Smart Home Water Guide.” This free step-by-step guide will
help you find leaks that are draining your piggy bank and provide
you with tips to improve your home water efficiency. Get a free copy
by calling 623-930-3553 or access the online version at
www.smarthomewaterguide.org.
132019 Water Quality Report
Glendale, AZ
Long Term Water Supply
Does Glendale have enough water resources for a
growing community?
Strategic investments in securing long-term and renewable water resources have allowed the
city of Glendale to earn and maintain a 100-year Designation of Assured Water Supply from
the State of Arizona. The Designation of Assured Water Supply ensures residents, businesses
and investors that there are sufficient water resources for land being considered for purchase
or lease within the City’s water service area.
Glendale has a 100-year water supply for all existing and planned developments within the
City’s water service area and is capable of building the necessary distribution and treatment
facilities to deliver high quality water to a growing community.
Glendale’s Drinking Water Distribution System is comprised of a vast network of more than
25,000 valves, 62,000 service lines, 8,600 fire hydrants, traveling through over 1,100 miles
of pipe, ranging in size from 4 inches to 60 inches. Water from Glendale’s water treatment
plants, wells and reservoirs serve the population with high quality drinking water for all its
potable water uses. The city of Glendale is committed to the maintenance and rehabilitation
of its aging drinking water infrastructure through system enhancements and improvements to
ensure consistent and reliable delivery of water to its constituents.
Glendale is Prepared for Drought
The Western U.S. is in an ongoing 20-year drought. This has greatly impacted the Colorado
River system including Lake Mead and Lake Powell. It is anticipated that if the drought
continues, Arizona will see its Colorado River supplies reduced.
Even though we are in a drought, Glendale is well prepared to meet water demand during
drought or water shortage conditions. The City’s Drought Management Plan ensures that
best management practices are in place to minimize the negative impacts of water shortages
resulting from drought. Through careful planning and resource management, we are fortunate
to have many water sources available to us – assuring us a long-term supply. To learn more
about the City’s Drought Management Plan visit: www.glendaleazwater.com
142019 Water Quality Report
Glendale, AZ
Failure to Report Compliance Monitoring
(Tier 3 Violations Public Notice)
The city of Glendale is required to monitor your drinking water for specific contaminants
on a regular basis. Title 40, Code of Federal Regulations (CFR) 141.31 and the Arizona
Administrative Code (A.A.C) R18-4-106 require results to be reported to ADEQ no later
than 10 days after the end of the monitoring period.
On May 2nd, 2019, ADEQ contacted the city of Glendale to report that the results for the
Nitrate samples taken at EPDS027 and EPDS030 for 4th Quarter 2018 were filed instead
of the Nitrate results taken at EPDS027 and EPDS030 from 1st Quarter 2019. The correct
results were submitted the same day; however, they were reported after ADEQ’s 10-day
reporting window resulting in a flag in the Safe Drinking Water Information System
(SDWIS) database. There were no adverse health risks or effects related to the situation
since all Nitrate-N results were below the 10 ppm MCL.
On February 18, 2020, ADEQ contacted the city of Glendale to report that the results for
the Asbestos samples taken at EPDS030 for the 2011-2019 compliance period were not
filed. The results were submitted on 2/25/2020; however, they were reported after ADEQ’s
10-day reporting window resulting in a flag in the SDWIS database. There were no adverse
health risks or effects related to the situation since the asbestos results were < 0.2 Million
Fibers per Liter, well below the 7 Million Fibers per Liter MCL.
Please share this information with all the other people who drink this water, especially those
who may not have received this notice directly (for example, people in apartments, nursing
homes, schools and businesses). You can do this by posting this notice in a public place or
distributing copies by hand or mail.
152019 Water Quality Report
Glendale, AZ
W AT E R S E R V I C E S
Want to Know More?
Water-related topics may be discussed at the Citizens Utility Advisory Commission (CUAC)
and City Council meetings. Please visit the following webpages for more information.
Glendale City Council Agendas and Meetings:
www.glendaleaz.com/your_government/city_council
Citizens Utility Advisory Commission (CUAC) Meetings:
www.glendaleaz.com/your_government/connect/departments/city_clerk/
boards_and_commissions/citizens_utility_advisory_commission
Contact Glendale Water Services Staff:
Water Services Department: 623-930-4100 | www.glendaleazwater.com
Water Quality Laboratory: 623-930-3897 | waterqualitylab@glendaleaz.com
Water Billing: 623-930-3190 | Water Conservation: 623-930-3596
Visit the following resources to learn more:
Tap Into Quality: www.tapintoquality.com
Only Tap Water Delivers: www.drinktap.org
Water Use It Wisely: www.wateruseitwisely.com
Water Sense: www.epa.gov/watersense
Tap Into Quality
Tap water. You turn on the faucet, it’s always there. It may be taken for granted,
but tap water quality, convenience and value is not taken lightly by the people
who ensure it is safe and available when you want it. The safety, convenience and
affordability of tap water is the message being communicated by “Tap Into Quality,”
a public education campaign designed to keep citizens informed about the quality
of their tap water. To learn more about your tap water, and check out an informative
video, visit www.tapintoquality.com.
16You can also read