Understanding video streaming algorithms in the wild
←
→
Page content transcription
If your browser does not render page correctly, please read the page content below
Understanding video streaming algorithms in the wild

                                                      Melissa Licciardello? , Maximilian Grüner ? , and Ankit Singla

                                                              Department of Computer Science, ETH Zürich
                                                   {melissa.licciardello, mgruener, ankit.singla}@inf.ethz.ch

                                                 Abstract. While video streaming algorithms are a hot research area, with in-
arXiv:2001.02951v1 [cs.NI] 9 Jan 2020

                                                 teresting new approaches proposed every few months, little is known about the
                                                 behavior of the streaming algorithms deployed across large online streaming plat-
                                                 forms that account for a substantial fraction of Internet traffic. We thus study
                                                 adaptive bitrate streaming algorithms in use at 10 such video platforms with di-
                                                 verse target audiences. We collect traces of each video player’s response to con-
                                                 trolled variations in network bandwidth, and examine the algorithmic behavior:
                                                 how risk averse is an algorithm in terms of target buffer; how long does it takes
                                                 to reach a stable state after startup; how reactive is it in attempting to match
                                                 bandwidth versus operating stably; how efficiently does it use the available net-
                                                 work bandwidth; etc. We find that deployed algorithms exhibit a wide spectrum
                                                 of behaviors across these axes, indicating the lack of a consensus one-size-fits-
                                                 all solution. We also find evidence that most deployed algorithms are tuned to-
                                                 wards stable behavior rather than fast adaptation to bandwidth variations, some
                                                 are tuned towards a visual perception metric rather than a bitrate-based metric,
                                                 and many leave a surprisingly large amount of the available bandwidth unused.

                                        1     Introduction
                                        Video streaming now forms more than 60% of Internet downstream traffic [21]. Thus,
                                        methods of delivering video streams that provide the best user experience despite vari-
                                        ability in network conditions are an area of great industry relevance and academic inter-
                                        est. At a coarse level, the problem is to provide a client with the highest possible video
                                        resolution, while minimizing pauses in the video stream. There are other factors to
                                        consider, of course, such as not switching video resolution often. These considerations
                                        are typically rolled into one quality-of-experience score. Streaming services then use
                                        adaptive bitrate algorithms, which attempt to maximize QoE by dynamically deciding
                                        what resolution to fetch video segments at, as network conditions fluctuate.
                                             While high-quality academic work proposing novel ABR is plentiful, the literature
                                        is much more limited (§2) in its analysis of widely deployed ABRs, their target QoE
                                        metrics, and how they compare to recent research proposals. The goal of this work is
                                        precisely to address this gap. Understanding how video platforms serving content to
                                        large user populations operate their ABR is crucial to framing future research on this
                                        important topic. For instance, we would like to know if there is a consensus across
                                        video platforms on how ABR should behave, or whether different target populations,
                                        content niches, and metrics of interest, lead to substantially different ABR behavior. We
                                        ?   equal contribution
would also like to understand whether ABR research is optimizing for the same metrics
as deployed platforms, which are presumably tuned based on operator experience with
real users and their measured engagement.
Towards addressing these questions, we present a study of ABR behavior across
10 video streaming platforms (Table 1) chosen for coverage across their diverse target
populations: some of the largest ones in terms of overall market share, some regional
ones, and some specialized to particular applications like game streaming (not live,
archived). Our methodology is simple: we throttle download bandwidth at the client in
a time-variant fashion based on throughput traces used in ABR research, and monitor
the behavior of streams from different streaming platforms by analyzing jointly their
browser-generated HTTP Archive (HAR) files and properties exposed by the video
players themselves. For robust measurements, we collect data for several videos on
each platform, with our analysis herein being based on 6 days of continuous online
streaming in total. Our main findings are as follows:
1. Deployed ABRs exhibit a wide spectrum of behaviors in terms of how much buffer
they seek to maintain in their stable state, how closely they try to match changing
bandwidth vs. operating more smoothly, how they approach stable behavior after
stream initialization, and how well they use available network bandwidth. There is
thus not a consensus one-size-fits-all approach in wide deployment.
2. Several deployed ABRs perform better on a QoE metric based on user visual per-
ception rather than just video bitrate. This lends support to the design philosophy
of recent ABR work [18], indicating that at least some of the industry is already
optimizing towards such metrics rather than bitrate-focused formulations in most
prior ABR research.
3. Most deployed ABRs eschew fast changes in response to bandwidth variations,
exhibiting stable behavior. In contrast, research ABRs follow bandwidth changes
more closely. It is unclear whether this is due to (a) a mismatch in target metrics
used in research and industrial ABR; or (b) industrial ABR being sub-optimal.
4. Several deployed ABRs leave substantial available bandwidth unused. For instance
YouTube uses less than 60% of the network’s available bandwidth on average
across our test traces. Similar to the above, it is unclear whether this is due to ABR
sub-optimality, or a conscious effort to decrease bandwidth costs.
2 Related Work
There is a flurry of academic ABR proposals [4,25,22,15,14,28,19,10,7,11,23,18], but
only limited study of the large number of deployed video streaming platforms catering
to varied video types and audiences.
YouTube itself is relatively well studied, with several analyses of various aspects of
its behavior [16,5,27], including video encoding, startup behavior, bandwidth variations
at fixed quality, a test similar to our reactivity analysis, variation of segment lengths, and
redownloads to replace already fetched segments. There is also an end-end analysis of
Yahoo’s video streaming platform using data from the provider [8].
2(a) Experimental setup (b) Proxy impact
Fig. 1: (a) Player behaviour is influenced through bandwidth throttling, and is recorded
from multiple sources. (b) The proxy has little impact on player behavior as measured in
terms of average linear QoE (QoElinear ); the whiskers are the 95% confidence interval.
Several comparisons and analysis of academic ABR algorithms [29,26,24] have also
been published, including within each of the several new proposals mentioned above.
In particular, [24] compares three reference ABR implementations, showing that the
configuration of various parameters has a substantial impact on their performance.
Facebook recently published [13] their test of Pensieve [14] in their video platform,
reporting small improvements (average video quality improvement of 1.6% and average
reduction of 0.4% in rebuffers) compared to their deployed approach.
However, a broader comparative study that examines a large number of diverse,
popular streaming platforms has thus far been missing. Note also that unlike ABR com-
parisons in academic work and head-to-head comparisons of methods in Facebook’s
study, QoE comparisons across platforms are not necessarily meaningful, given the
differences in their content encoding, content type, and audiences. Thus, in contrast
to prior work, we define a set of metrics that broadly characterize ABR behavior and
compare the observed behavior of a large, diverse set of streaming providers on these
metrics. Where relevant, we also contrast the behavior of these deployed ABRs with
research proposals. To the best of our knowledge this is the only work to compare a
large set of deployed ABRs and discuss how their behavior differs from academic work
in this direction.
3 Methodology
To understand a target platform’s ABR, we must collect traces of its behavior, including
the video player’s state (in terms of selected video quality and buffer occupancy) across
controlled network conditions and different videos.
3.1 Experimental setup
Fig. 1 shows our architecture for collecting traces about player behaviour. Our Python3
implementation uses the Selenium browser automation framework [2] to interact with
online services. For academic ABR algorithms, trace collection is simpler, and uses
offline simulation, as suggested in [14].
3While playing a video, we throttle the throughput (5) at the client (1) using tc (Traf-
fic control, a Linux tool). The state of the client browser (e.g., current buffer occupancy)
is captured by the Monitor (3) every a seconds. All requests sent from the client (2) to
the server (4) are logged by a local proxy (2). Beyond the final browser state, the proxy
allows us to log video player activity such as chunks that are requested but not played.
We also obtain metadata about the video from the server (e.g., at what bitrate each video
quality is encoded). All information gathered from the three sources — the proxy, the
browser and the server — is aggregated (4).
Certain players replace chunks previously downloaded at low quality with high
quality ones (“redownloading”) in case there is later more bandwidth and no imme-
diate rebuffer risk. Using the proxy’s view of requests and responses and the video
metadata, we can map every chunk downloaded to a play-range within the video, and
use this mapping to identify which chunks / how many bytes were redownloaded.
How do we add a platform to our measurements? : Most video platforms (all except
YouTube in our set of 10) use chunk-based streaming. To evaluate such a platform,
we use developer tools in Chrome to learn its chunk request format from the video
manifest files. This allows us to write code that fetches all chunks for the test videos
at all qualities, such that we can use these videos in our offline simulation analysis of
the academic ABRs. Having all chunks available also enables calculation of their visual
perceived quality (VMAF [12]). We also need to map each chunk to its bitrate level and
time in the video stream, by understanding how video content is named in the platform
(e.g., through “itags” in YouTube).
For online experiments through the browser, we need to instrument the platform’s
video player. We do this by automating the selection of the HTML5 video player ele-
ment, and having our browser automation framework use this to start the video player
and put it in full screen mode. We can then access the current buffer occupancy and
current playback time using standard HTML5 attributes.
YouTube does not follow such chunked behavior (as past work has noted [16]). It
can request arbitrary byte ranges of video from the server. We use an already available
tool [3] to download the videos, and then learn the mapping from the byte ranges to
play time from the downloaded videos.
3.2 The proxy’s impact on measurements
Some of our measurements (e.g., redownloads) use an on-path proxy, so we verify that
this does not have a meaningful impact by comparing metrics that can be evaluated
without the proxy. For this, we use traces with constant bandwidth b ∈ [0.5, 0.8, 1.2, 2.5]
Mbps, repeating each experiment 5 times for the same video. For our comparison, we
calculate QoE using the linear function from Pensieve [14] with and without the proxy.
For every video-network trace combination, we calculate the mean QoE and show the
mean across these, together with its 95% confidence interval with whiskers in Fig. 1.
As the results show, for most platforms the proxy has a minimal impact. While there
is some impact for YouTube and ZDF, these also show large variations in experiments
without the proxy, indicating differing behaviour in very similar conditions in general.
43.3 Metrics of interest
Different video platforms serve very different types of content, and target different ge-
ographies with varied client connectivity characteristics. It is thus not particularly in-
formative to compare metrics like QoE across platforms. For instance, given the differ-
ent bitrate encodings for different types of content, QoE metrics using bitrate are not
comparable across platforms. We thus focus on comparisons in terms of the following
behavioral and algorithm design aspects.
Initialization behavior: We quantify how much wait time a video platform typically
incurs for streams to start playback, and how much buffer (in seconds of playback) it
builds before starting. We use traces with a fixed bandwidth of 3 Mbps until player’s
HTML5 interactions are available, thus always downloading items like the player itself
at a fixed bandwidth. After this, we throttle using only the high-bandwidth traces from
the Oboe [4] data set, which have a mean throughput of 2.7 Mbps. We start timing
from when the first chunk starts downloading (per the HAR files; the player HTML5
interactions may become available earlier or later).
Convergence: During startup, an ABR may have little information about the client’s
network conditions. How do different ABRs approach stable behavior starting from
this lack of information? Stablility in this sense refers to fewer bitrate switches. Thus,
to assess convergence characteristics, we quantify the bitrate changes (in Mbps per
second) across playback, i.e., a single switch from 3 Mbps to 4 Mbps bitrate over a total
playback of 5-seconds amounts to 0.2 Mbps/sec on this metric.
Risk-tolerance: ABRs can hedge against rebuffer events by building a larger buffer,
thus insulating them from bandwidth drops. Thus, how much buffer (in seconds of
video) an ABR builds during its stable operation is indicative of its risk tolerance.
Reactivity: ABRs must react to changes in network bandwidth. However, reacting too
quickly to bandwidth changes can result in frequent switching of video quality, and
cause unstable behavior when network capacity is highly variable. To quantify reactivity
of an ABR, we use synthetic traces with just one bandwidth change after convergence,
and measure the evolution of bitrate difference in the video playback after the change
over time (with the number of following chunk downloads used as a proxy for time).
Bandwidth usage: ABR must necessarily make conservative decisions on video qual-
ity: future network bandwidth is uncertain, so fetching chunks at precisely the estimated
network bandwidth would (a) not allow building up a playback buffer even if the es-
timate were accurate; and (b) cause rebuffers when bandwidth is overestimated. Thus,
ABR can only use some fraction of the available bandwidth. We quantify this behav-
ior in terms of the fraction of bytes played to optimally downloadable, with “optimally
downloadable” reflecting the minimum of (a posteriori known) network capacity and
the bytes needed for highest quality streaming.
For better bandwidth use and to improve QoE, some ABRs are known to redown-
load and replace already downloaded chunks in the buffer with higher quality chunks.
We quantify this as the fraction of bytes played to bytes downloaded. FractionsQoE goal: Academic ABR work has largely used a QoE metric that linearly combines
a reward for high bitrate with penalties for rebuffers and quality switches [15,14]. More
recent work has suggested formulations of QoE that reward perceptual video quality
rather than just bitrate [18]. One such metric of perceptual quality, VMAF [12], com-
bines several traditional indicators of video quality. While it is difficult, if not impos-
sible, to determine what precise metric each platform’s ABR optimizes for, we can
evaluate coarsely whether this optimization is geared towards bitrate or VMAF-like
metrics by examining what video chunks an ABR tries to fetch at high quality: do
chunks with higher VMAF get fetched at a higher quality level? To assess this, we sort
chunks by VMAF (computed using [12]) and quantify for the top n% of chunks, their
(average) playback quality level compared to the (average) quality level of all chunks,
Qtop−n% − Qall . A large difference implies a preference for high-VMAF chunks.
3.4 Measurement coverage
We evaluate multiple videos on each of 10 platforms across a large set of network traces.
Target platforms: Table 1 lists the platforms for which we have currently implemented
support in our measurement and analysis pipeline. While by no means exhaustive, these
were chosen to cover a range of content types and a few different geographies. Note
that Netflix was excluded because their terms of service prohibit automated experi-
ments [1]. For Twitch, which offers both live streams and video-on-demand of archived
live streams, we only study the latter, as live streaming is a substantially different prob-
lem, and a poor fit with the rest of our chosen platforms.
Different platforms encode content at varied resolutions and number of resolutions,
ranging from just 3 quality levels for TubiTV to 6.5 on YouTube (on average across our
test videos; YouTube has different numbers of resolutions on different videos.)
When comparing the behavior of deployed ABRs with academic ones, we test the
latter in the offline environment made available by the Pensieve authors [14]. For each
tested video on each platform, we pre-download all its chunks at all available quali-
ties. We then simulate playback using the same network traces up until the same point
Provider Description # Resolutions offered
Arte French-German, cultural 4.0 ± 0.0
Fandom Gaming, pop-culture 5.0 ± 0.0
SRF Swiss Public Service, local and international content 5.7 ± 0.48
TubiTV Movies and series of all genres 3.0 ± 0.0
Twitch Live and VoD streaming service, gaming 5.9 ± 0.32
Vimeo Artistic content [17] 4.2 ± 0.92
YouTube Broad coverage 6.5 ± 1.08
ZDF German Public Service, local and international content 5.3 ± 0.48
Pornhub Pornographic video sharing website 4.0 ± 0.0
XVideos Pornographic video sharing website 4.4 ± 0.52
Table 1: We test a diverse set of large video platforms.
6offline for academic ABRs as we do for the deployed ones. We primarily rely on Ro-
bust MPC [15] (referred to throughout as MPC) as a stand-in for a recent, high-quality
academic ABR approach. While even newer proposals are available, they either use
data-dependent learning techniques [14,4] that are unnecessary for our purpose of gain-
ing intuition, or do not have available, easy-to-use code.
Videos: The type of content can have substantial bearing on streaming performance,
e.g., videos with highly variable encoding can be challenging for ABR. We thus used
a set of 10 videos on each platform. Where a popularity measure was available, we
used the most popular videos; otherwise, we handpicked a sample of different types of
videos. Videos from each platform are encoded in broadly similar bitrate ranges, with
most differences lying at higher qualities, e.g., some content being available in 4K.
It would, of course, be attractive to upload the same video content to several plat-
forms (at least ones that host user-generated content) to remove the impact of videos in
the cross-platform comparisons. However, different platforms use their own encoding
pipelines, making it unclear whether this approach has much advantage over ours, using
just popular videos across platforms.
Network traces: Our experiments use synthetic and real-world traces from 3 datasets in
past work [4,20,6]. Unfortunately, a full cross-product of platform-video-trace would be
prohibitively expensive — the FCC traces [6] alone would require 4 years of streaming
time. To sidestep this, we rank traces by their throughput variability and pick traces
with the highest and lowest variability together with some randomly sampled ones.
Our final network trace collection consists of the 5 least stable, 5 most stable, and 5
random traces from the Belgium trace collection [9], and 10 in each of those categories
from the Norway [20], the Oboe [4] and the FCC datasets1 . We also use 15 constant
bandwidth traces covering the range from 0.3 to 15 Mbps uniformly. Lastly we add
10 step traces: after 60 seconds of streaming we suddenly increase/drop the bandwidth
from/to 1 Mbps to/from 5 values covering the space from 1.5 to 10 Mbps uniformly.
In total, we use 130 traces with throughput (average over time for each trace) rang-
ing from 0.09 to 41.43 Mbps, with an average of 6.13 Mbps across traces. Note that
we make no claim of our set of traces being representative; rather our goal is to test a
variety of traces to obtain insight into various ABR behaviors. If a trace does not cover
the whole experiment we loop over it.
For quantifying reactivity, we only use the synthetic traces mentioned above, with
a single upward step change in bandwidth. For quantifying startup delay, we use traces
with a bandwidth of around 3 Mbps as noted in §3.3.
Ethics: We are careful to not generate excessive traffic or large bursts to any platform,
measuring at any time, only one stream per service, typically at a low throttled rate.
4 Measurement results
Overall, we find diverse behavior on each of our tested metrics across the measured
platforms. We attempt to include results across all platforms where possible, but for
1 Specifically, the stable collection from September 2017 [6].
7(a) Initialization behavior (b) Convergence
Fig. 2: (a) Initialization behavior: most providers start playback after one chunk is
downloaded. (b) Convergence is measured in terms of changes in bitrate switching,
i.e., the (absolute) sum of bitrate differentials across all switches from the start until a
point in playback, divided by the thus-far playback duration. As expected, switching is
more frequent during startup, but the degree of switching varies across providers both
in startup and later.
certain plots, for sake of clarity, we choose a subset of platforms that exhibits a range
of interesting behaviors.
Initialization behavior, Fig. 2a: We find that most platforms’ ABR simply waits for
one chunk download to finish before beginning playback. This is reflected in the buffer
occupancy at playback. Some players like ZDF and SRF use a larger chunk size (10
seconds), which is why they pre-load more seconds of buffer.
As one might expect, building a larger buffer before playback starts generally incurs
a higher start time. Twitch stands out in this regard, as it downloads nearly 20 seconds
of buffer before start. Some players, whilst downloading the same number of buffer sec-
onds as others, do so at much higher resolution – e.g., SRF downloads its first 10 sec-
onds with 6× as many pixels as Arte. This is reflected in the disparity between their start
times, despite both populating the buffer with 10 seconds of playback. More broadly,
all such “discrepancies” are difficult to explain because startup is hard to untangle from
other network activity, e.g., some players already start downloading video chunks while
the player itself is still downloading, thus complicating our notion of timing. (We start
timing from the point the first chunk starts downloading. For most platforms, this pro-
vides a leveling standard that excludes variation from other downloads on their Web
interface. It also helps reduce latency impacts that are mainly infrastructure driven, as
well as effects of our browser automation framework.)
Convergence, Fig. 2b: As one might expect, during startup and early into playback,
every player attempts to find a stable streaming state. This results in a large amount
of bitrate switches early in playback followed by much smoother behavior with more
limited switching. Nevertheless, there are large differences across players, e.g., Pornhub
switches more than twice as much as Fandom and SRF in the beginning. In stable
state, Fandom switches substantially more than SRF. We also evaluated the academic
(Robust) MPC algorithm [15] on the same network traces and over the SRF videos.
The MPC algorithm would use more than twice as much switching both in startup and
8later, compared to SRF’s deployed ABR. It is unclear to us whether SRF’s ABR is
sub-optimal, or whether their deployment experience indicates stability has a higher
importance than reflected in the default linear QoE model used in MPC.
For clarity, we only picked a few platforms as exemplars of behavior towards con-
vergence instead of including all 10 tested platforms. The behavior is broadly similar
with more switching early on, but the precise stabilization differs across platforms.
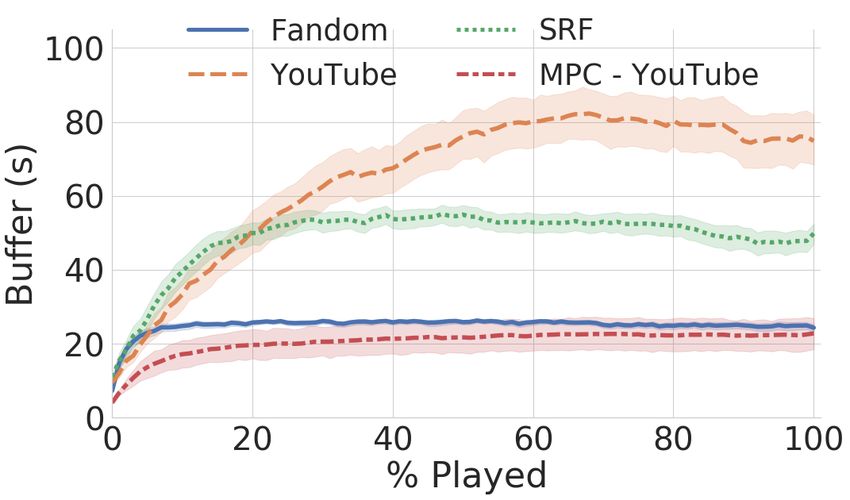
Risk-tolerance, Fig. 3: We observe widely different buffering behavior across the play-
ers we tested. Of course, every player uses early playback to download lower qual-
ity chunks and accumulate buffer, but some, like YouTube, settle towards as much as
80 seconds of buffer, while others like Fandom operate with a much smaller buffer of
around 20 seconds. Testing MPC’s algorithm on the same traces across the YouTube
videos reveals that it falls towards the lower end, stabilizing at 20 seconds of buffer.
Note that for approaches that allow
redownloads (including YouTube), larger
buffers are a reasonable choice: any chunks
that were downloaded at low quality can
later be replaced. This is likely to be a more
robust strategy in the face of high band-
width variability. However, for approaches
that do not use redownloads, a larger buffer
implies that all its content must be played
out at whatever quality it was downloaded
Fig. 3: Risk-tolerance: YouTube operates
at, thus limiting the possibilities to ben-
with nearly 4× the buffer for Fandom.
efit from opportunistic behavior if band-
The shaded regions show the 95% confi-
width later improves. Thus operating with
dence interval around the mean.
a smaller buffer of higher-quality chunks
may be preferable to filling it with lower-
quality chunks. In the absence of redownloads, there is thus a tradeoff: a larger buffer
provides greater insurance against bandwidth drops, but reduces playback quality. At
the same time, redownloads are themselves a compromise: if better bitrate decisions
could be made to begin with, redownloads amount to inefficient bandwidth use.
Reactivity, Fig. 4: We find that most deployed ABRs are cautious in reacting to band-
width changes. This is best illustrated through comparisons between deployed and aca-
demic ABRs. Fig. 4(right) shows such a comparison between TubiTV and MPC eval-
uated on the same traces and videos. After the bandwidth increases (at x-axis=0 in the
plot), TubiTV waits for tens of chunk downloads before it substantially ramps up bitrate.
In contrast, MPC starts switching to higher bitrates within a few chunk downloads. (The
large variations around the average arise from the varied sizes of the step-increases in
the used network traces and variations in the tested videos.)
While we have not yet been able to evaluate a large number of mobile ABR im-
plementations (see §5), we were able to experiment with Vimeo’s mobile and desktop
versions, shown in Fig. 4(left). They exhibit similar ramp-up behavior in terms of how
many downloads it takes before Vimeo reacts, but show very different degrees of bitrate
change. The desktop version increases bitrate in several steps after the bandwidth in-
crease, while the mobile one settles at a modest increase. This is along expected lines,
9Fig. 4: We measure reactivity in terms of bitrate evolution after a bandwidth increase,
i.e., difference in average playback bitrate after and before the bandwidth change over
time (in terms of chunk downloads). The plots show the reactivity differences between:
(left) mobile and desktop versions of Vimeo; and (right) TubiTV and MPC.
as the mobile player, targeting the smaller screen, often does not use the higher-quality
content at all.
A comparison between TubiTV and Vimeo (desktop) across the two plots is also
interesting: Vimeo ramps up faster than TubiTV. (MPC ramps us even faster on the
Vimeo videos.) One potential reason is the difference in encoding — TubiTV serves
each video in only 3 resolutions, compared to Vimeo’s 4-5. This implies that over the
same network traces, TubiTV must necessarily see a larger change in bandwidth to be
able to jump from one bitrate to the next, given its larger differential in bitrate levels.
Bandwidth usage, Fig. 5a: Different platforms use bandwidth very differently. Arte
discards a surprisingly large 23% of its downloaded bytes in its efforts to replace al-
ready downloaded low-quality chunks with high-quality ones. Some platforms, includ-
ing YouTube, SRF, and Vimeo, show milder redownload behavior, while several others,
including XVideos, Fanrom, Pornhub, and ZDF, do not use redownloads at all.
In terms of efficiency, ZDF and TubiTV are able to use 80% of the network’s avail-
able bytes for fetching (actually played) video chunks, while all other players use the
network much less effectively. While the uncertainty in future bandwidth and the desire
to maintain stable streaming without many quality switches necessitates some band-
width inefficiencies, we were surprised by how large these inefficiencies are. In partic-
ular, XVideos, YouTube, Twitch, and Fandom all use less than 60% of the network’s
available capacity on average across our trace-video pairs2 . This low usage is particu-
2 Note that these inefficiencies cannot be blamed on transport / TCP alone, as on the same
traces, other players are able to use 80% of the available capacity. We also carefully account
for non-video data to ensure we are not simply ignoring non-chunk data in these calculations.
10(a) Bandwidth usage (b) QoE goal
Fig. 5: (a) Bandwidth usage: many players use surprisingly little of the available net-
work bandwidth (Played / Download-able), e.g., XVideos uses only 50% of it; and some
players, like Arte, spend a large fraction of their used bandwidth on redownloads. (b)
QoE goal: we measure how much a player prefers high-VMAF chunks by quantifying
the average quality-level difference between all chunks and only the top-x% of chunks
by VMAF (i.e., Q[0...%Top] ). Some players, like Twitch, show a large preference for high-
VMAF chunks.
larly surprising for YouTube, which uses several strategies — variable chunk lengths
(as opposed to fixed-size chunks in other providers), larger number of available video
resolutions, and redownloads — that allow finer-grained decision making, and thus
should support more effective bandwidth use. Given these advanced features in their
ABR design, it is more likely that their optimization goals differ from academic ABR
work than their algorithm simply being poorly designed. While we cannot concretely
ascertain their optimization objectives, one could speculate that given the large global
demands YouTube faces while operating (largely) as a free, ad-based service, a profit
maximizing strategy may comprise providing good-enough QoE with a limited expense
on downstream bandwidth.
QoE goal, Fig. 5b: We find that some providers fetch high-VMAF chunks at higher
quality than the average chunk. In particular, Twitch fetches the chunks in the top 20th
percentile by VMAF at a mean quality level 0.79 higher than an average chunk. If
instead of Twitch’s ABR, we used a VMAF-unaware, simple, rate-based ABR3 that
uses an estimate of throughput to decide on video quality, this difference in quality
level between high-VMAF and the average chunk would reduce to 0.46.
Note that given the correlation between higher quality and higher VMAF, high-
VMAF chunks are overall more likely to be fetched at high quality; what is interesting
is the degree to which different players prefer them. Vimeo, for instance, shows a much
smaller difference of 0.27 between the quality level of chunks in the top 20th percentile
and an average chunk. If MPC’s ABR were used to fetch chunks from Vimeo, this
For instance, audio data is separately delivered for Vimeo and YouTube, but is accounted for
appropriately in our bandwidth use analysis.
3 This ABR estimates throughput, T , as the mean of the last 5 throughput measurements. For its
next download, it then picks the highest quality level with a bitrate ≤ T . It thus downloads the
largest chunk for which the estimated download time does not exceed the playback time.
11difference increases to 0.534, because MPC is willing to make more quality switches
than Vimeo.
Our results thus indicate diversity in optimization objectives in terms of bandwidth
use and QoE targets across deployed video platforms. It is at least plausible that aca-
demic ABRs produce different behavior over the same traces not because they are much
more efficient, but rather the optimization considerations are different. While algo-
rithms like MPC are flexible enough to be used for a variety of optimization objectives,
it is unclear how performance would compare across a suitably modified MPC (or other
state-of-the-art ABR) when evaluated on operator objectives.
5 Limitations and future work
Our first broad examination of a diverse set of widely deployed ABRs reveals several
interesting insights about their behavior, but also raises several questions we have not
yet addressed:
1. Does ABR behavior for the same platform vary by geography and client network?
Such customization is plausible — there are likely large differences in network
characteristics that a provider could use in heuristics, especially for startup be-
havior, where little else may be known about the client’s network bandwidth and
its stability. However, addressing this question would require running bandwidth-
expensive experiments from a large set of globally distributed vantage points.
2. How big are the differences between mobile and desktop versions of ABR across
platforms? Unfortunately, while the browser provides several universal abstractions
through which to perform monitoring on the desktop, most platforms use their own
mobile apps, greatly increasing the per-platform effort for analysis.
3. If we assume that the largest providers like YouTube and Twitch are optimizing
ABR well, based on their experience with large populations of users, can we infer
what their optimization objective is? While there are hints in our work that these
providers are not necessarily optimizing for the same objective as academic ABR,
we are not yet able to make more concrete assertions of this type.
4. Does latency have a substantial impact on ABR? ABR is largely a bandwidth-
dependent application, but startup behavior could potentially be tied to latency as
well. We have thus far not evaluated latency-dependence.
6 Conclusion
We conduct a broad comparison of adaptive bitrate video streaming algorithms de-
ployed in the wild across 10 large video platforms offering varied content targeted at
different audiences. We find large differences in player behavior, with a wide spectrum
of choices instantiated across virtually all metrics we examined. For instance, our re-
sults show that: (a) some deployed ABRs are conscious of perceptual quality metrics
compared to others focused on bitrate; (b) no deployed ABRs follow available band-
width as closely as research ABRs; and (c) several ABRs leave a large fraction of avail-
able network capacity unused. Whether this diversity of design choices and behaviors
12stems from careful tailoring towards different use cases and optimization objectives, or
is merely a natural consequence of sub-optimal, independent design is at present un-
clear. But if large, otherwise extremely well-engineered platforms like YouTube differ
so substantially from state-of-the-art research ABRs, then it is at least plausible that
ABR research is more narrowly focused than desirable.
References
1. Netflix terms of use, https://help.netflix.com/legal/termsofuse
2. Selenium webdriver, https://www.seleniumhq.org/projects/webdriver/
3. Youtube downloader, https://github.com/ytdl-org/youtube-dl/
4. Akhtar, Z., Nam, Y.S., Govindan, R., Rao, S., Chen, J., Katz-Bassett, E., Ribeiro, B., Zhan, J.,
Zhang, H.: Oboe: auto-tuning video abr algorithms to network conditions. In: Proceedings
of the 2018 Conference of the ACM Special Interest Group on Data Communication. pp.
44–58. ACM (2018)
5. Añorga, J., Arrizabalaga, S., Sedano, B., Goya, J., Alonso-Arce, M., Mendizabal, J.: Analysis
of youtubes traffic adaptation to dynamic environments. Multimedia Tools and Applications
(2018)
6. Commission, F.C.: Validated data september 2017 - measuring broadband america, https:
//www.fcc.gov/reports-research/reports/
7. De Cicco, L., Caldaralo, V., Palmisano, V., Mascolo, S.: Elastic: a client-side controller for
dynamic adaptive streaming over http (dash). In: Packet Video Workshop (PV), 2013 20th
International. pp. 1–8. IEEE (2013)
8. Ghasemi, M., Kanuparthy, P., Mansy, A., Benson, T., Rexford, J.: Performance characteriza-
tion of a commercial video streaming service. In: ACM IMC (2016)
9. van der Hooft, J., Petrangeli, S., Wauters, T., Huysegems, R., Alface, P.R., Bostoen, T.,
De Turck, F.: HTTP/2-Based Adaptive Streaming of HEVC Video Over 4G/LTE Networks.
IEEE Communications Letters 20(11), 2177–2180 (2016)
10. Jiang, J., Sekar, V., Zhang, H.: Improving fairness, efficiency, and stability in http-based
adaptive video streaming with festive. IEEE/ACM Transactions on Networking 22(1), 326–
340 (Feb 2014). https://doi.org/10.1109/TNET.2013.2291681
11. Li, Z., Zhu, X., Gahm, J., Pan, R., Hu, H., Begen, A.C., Oran, D.: Probe and adapt: Rate
adaptation for http video streaming at scale. IEEE Journal on Selected Areas in Communi-
cations 32(4), 719–733 (April 2014). https://doi.org/10.1109/JSAC.2014.140405
12. Li, Z., Aaron, A., Katsavounidis, I., Moorthy, A., Manohara, M.: Toward a practi-
cal perceptual video quality metric (2016), https://medium.com/netflix-techblog/
toward-a-practical-perceptual-video-quality-metric-653f208b9652
13. Mao, H., Chen, S., Dimmery, D., Singh, S., Blaisdell, D., Tian, Y., Alizadeh, M., Bakshy, E.:
Real-world video adaptation with reinforcement learning. Reinforcement Learning for Real
Life (ICML workshop) (2019)
14. Mao, H., Netravali, R., Alizadeh, M.: Neural adaptive video streaming with pensieve. In:
Proceedings of the Conference of the ACM Special Interest Group on Data Communication.
pp. 197–210. ACM (2017)
15. Miller, K., Bethanabhotla, D., Caire, G., Wolisz, A.: A control-theoretic approach to adaptive
video streaming in dense wireless networks. IEEE Transactions on Multimedia 17(8), 1309–
1322 (2015)
16. Mondal, A., Sengupta, S., Reddy, B.R., Koundinya, M., Govindarajan, C., De, P., Ganguly,
N., Chakraborty, S.: Candid with youtube: Adaptive streaming behavior and implications on
data consumption. In: ACM NOSSDAV (2017)
1317. Moreau, E.: What is vimeo? an intro to the video sharing platform, https://www.
lifewire.com/what-is-vimeo-3486114
18. Qin, Y., Hao, S., Pattipati, K.R., Qian, F., Sen, S., Wang, B., Yue, C.: Abr streaming of vbr-
encoded videos: characterization, challenges, and solutions. In: ACM CoNEXT
19. Qin, Y., Jin, R., Hao, S., Pattipati, K.R., Qian, F., Sen, S., Wang, B., Yue, C.: A control
theoretic approach to abr video streaming: A fresh look at pid-based rate adaptation. In:
INFOCOM 2017-IEEE Conference on Computer Communications, IEEE. pp. 1–9. IEEE
(2017)
20. Riiser, H., Vigmostad, P., Griwodz, C., Halvorsen, P.: Commute path bandwidth traces from
3g networks: analysis and applications (2013)
21. Sandvine: The global internet phenomena report. https://www.sandvine.com/
press-releases/sandvine-releases-2019-global-internet-phenomena-report
(2019)
22. Spiteri, K., Urgaonkar, R., Sitaraman, R.K.: Bola: Near-optimal bitrate adapta-
tion for online videos. In: IEEE INFOCOM 2016 - The 35th Annual IEEE
International Conference on Computer Communications. pp. 1–9 (April 2016).
https://doi.org/10.1109/INFOCOM.2016.7524428
23. Spiteri, K., Sitaraman, R., Sparacio, D.: From theory to practice: Improving bi-
trate adaptation in the dash reference player. In: Proceedings of the 9th ACM
Multimedia Systems Conference. pp. 123–137. MMSys ’18, ACM, New York, NY,
USA (2018). https://doi.org/10.1145/3204949.3204953, http://doi.acm.org/10.1145/
3204949.3204953
24. Stohr, D., Frömmgen, A., Rizk, A., Zink, M., Steinmetz, R., Effelsberg, W.: Where are the
sweet spots?: A systematic approach to reproducible dash player comparisons. In: ACM
Multimedia (2017)
25. Sun, Y., Yin, X., Jiang, J., Sekar, V., Lin, F., Wang, N., Liu, T., Sinopoli, B.: Cs2p: Improving
video bitrate selection and adaptation with data-driven throughput prediction. In: Proceed-
ings of the 2016 ACM SIGCOMM Conference. pp. 272–285. ACM (2016)
26. Timmerer, C., Maiero, M., Rainer, B.: Which adaptation logic? an objective and subjective
performance evaluation of http-based adaptive media streaming systems (2016)
27. Wamser, F., Casas, P., Seufert, M., Moldovan, C., Tran-Gia, P., Hossfeld, T.: Modeling the
youtube stack: From packets to quality of experience. Computer Networks (2016)
28. Wang, C., Rizk, A., Zink, M.: Squad: A spectrum-based quality adaptation for dy-
namic adaptive streaming over http. In: Proceedings of the 7th International Con-
ference on Multimedia Systems. pp. 1:1–1:12. MMSys ’16, ACM, New York, NY,
USA (2016). https://doi.org/10.1145/2910017.2910593, http://doi.acm.org/10.1145/
2910017.2910593
29. Yan, F.Y., Ayers, H., Zhu, C., Fouladi, S., Hong, J., Zhang, K., Levis, P., Winstein, K.: Learn-
ing in situ: a randomized experiment in video streaming (2019)
14You can also read