Improved tumor contrast achieved by single time point dual-reporter fluorescence imaging
←
→
Page content transcription
If your browser does not render page correctly, please read the page content below
Improved tumor contrast achieved by
                 single time point dual-reporter
                 fluorescence imaging

                 Kenneth M. Tichauer
                 Kimberley S. Samkoe
                 Kristian J. Sexton
                 Jason R. Gunn
                 Tayyaba Hasan
                 Brian W. Pogue

Downloaded From: https://www.spiedigitallibrary.org/journals/Journal-of-Biomedical-Optics on 13 Mar 2021
Terms of Use: https://www.spiedigitallibrary.org/terms-of-use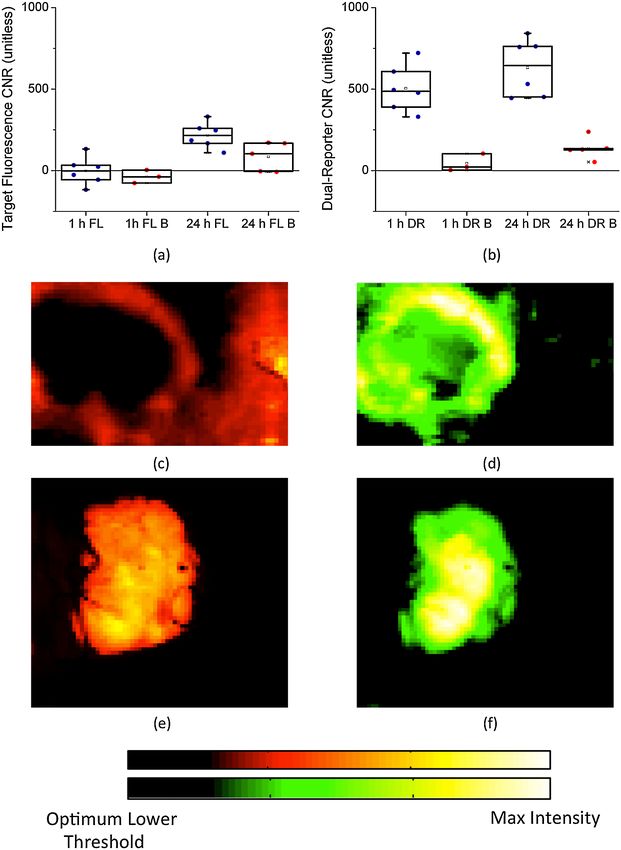
Journal of Biomedical Optics 17(6), 066001 (June 2012)

                Improved tumor contrast achieved by single time point
                dual-reporter fluorescence imaging
                Kenneth M. Tichauer,a Kimberley S. Samkoe,a,b Kristian J. Sexton,a Jason R. Gunn,a Tayyaba Hasan,c and
                Brian W. Poguea,b,c
                a
                    Dartmouth College, Thayer School of Engineering, Hanover, New Hampshire 03755
                b
                    Dartmouth Medical School, Department of Surgery, Lebanon, New Hampshire 03756
                c
                    Massachusetts General Hospital, Wellman Center for Photomedicine, Boston, Massachusetts 02114

                               Abstract. In this study, we demonstrate a method to quantify biomarker expression that uses an exogenous dual-
                               reporter imaging approach to improve tumor signal detection. The uptake of two fluorophores, one nonspecific and
                               one targeted to the epidermal growth factor receptor (EGFR), were imaged at 1 h in three types of xenograft tumors
                               spanning a range of EGFR expression levels (n ¼ 6 in each group). Using this dual-reporter imaging methodology,
                               tumor contrast-to-noise ratio was amplified by >6 times at 1 h postinjection and >2 times at 24 h. Furthermore, by
                               as early as 20 min postinjection, the dual-reporter imaging signal in the tumor correlated significantly with a
                               validated marker of receptor density (P < 0.05, r ¼ 0.93). Dual-reporter imaging can improve sensitivity and
                               specificity over conventional fluorescence imaging in applications such as fluorescence-guided surgery and
                               directly approximates the receptor status of the tumor, a measure that could be used to inform choices of biological
                               therapies. © 2012 Society of Photo-Optical Instrumentation Engineers (SPIE). [DOI: 10.1117/1.JBO.17.6.066001]
                               Keywords: binding potential; epidermal growth factor receptor; fluorescence; receptor; xenograft; molecular imaging; cancer.
                               Paper 11712 received Dec. 1, 2011; revised manuscript received Apr. 10, 2012; accepted for publication Apr. 11, 2012; published online
                               Jun. 5, 2012.

                1      Introduction                                                                these late time points, even untargeted reporters such as indo-
                Targeted fluorescent imaging reporters are being used to an                        cyanine green are preferentially taken up by tumors.7 There are
                ever-greater extent in surgical oncology as a means of improving                   further delivery limitations of this approach as well. First, the
                tumor contrast to guide resection or highlight sensitive tissues                   uptake of a fluorescent reporter, even at 24 h, is still dependent
                that should be avoided.1,2 The promise of fluorescence-guided                      on the rate of delivery of the reporter, so it is not obvious how
                surgery to reduce morbidity and mortality has stimulated a num-                    well it will work for more avascular tumors.13 Second, achieving
                ber of clinical studies and clinical trials focused on the surgical                sufficient signal in the tumor at these delayed time points may
                treatment of oncological pathologies.3–9 To date, the vast major-                  require larger doses of the reporter than necessary, which could
                ity of these applications have employed clinically approved                        impede the clinical acceptance of these approaches. Ideally,
                fluorescent reporters, which has somewhat limited the number                       microdose levels (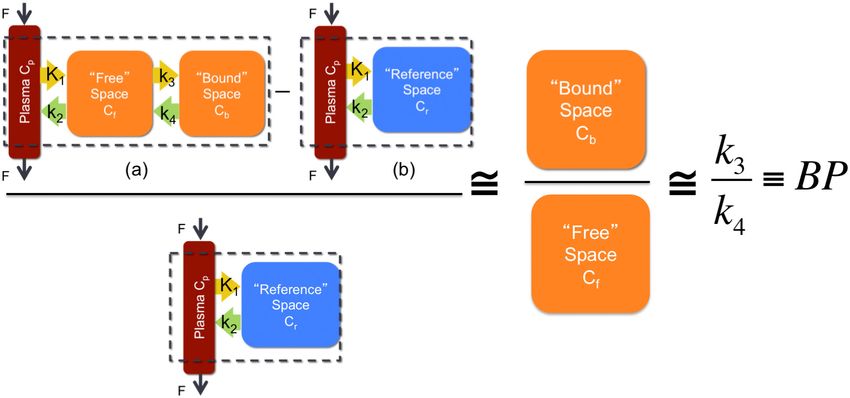
Tichauer et al.: Improved tumor contrast achieved by single time point dual-reporter fluorescence imaging

                out immediately after reporter injection, when the amount of                       C r . These relationships can be expressed by the following
                fluorescence signal in the tissue is at a maximum, thereby                         equations if both reporters are assumed to have the same plasma
                enabling the lowest concentrations of reporters to be adminis-                     curves:
                tered. The downside to the approaches demonstrated thus
                far20,21 is that they require continuous monitoring of the uptake                               ROIT ðtÞ ¼ C p ðtÞ þ Cf ðtÞ þ C b ðtÞ         and             (1)
                curves of both reporters over tens of minutes, which would not
                be ideal for translation to fluorescence-guided surgery.
                    In this study, a simplified version of this approach is pre-                                        ROIUT ðtÞ ¼ Cp ðtÞ þ C r ðtÞ;                         (2)
                sented with a focus on achieving optimal tumor-to-background
                contrast at single time points by essentially taking the ratio of the              where ROIT ðtÞ and ROIUT ðtÞ are the measured region of interest
                uptake images of the two reporters: one untargeted and, for                        concentrations of the targeted and untargeted reporters, respec-
                investigational purposes, one targeted to epidermal growth fac-                    tively, as a function of time t. Taking the difference between
                tor receptor (EGFR), a cell surface receptor that is overexpressed                 Eqs. (1) and (2) and then dividing by Eq. (2) (i.e., subtracting
                in many forms of cancer.24 This single timeframe imaging of the                    the untargeted reporter uptake image from the targeted image
                processed image was hypothesized to have enhanced contrast as                      and dividing by the untargeted image) produces the following
                well as be closely related to the EGFR expression activity of                      expression:
                the tumor.
                                                                                                            ROIT ðtÞ − ROIUT ðtÞ C f ðtÞ þ Cb ðtÞ − Cr ðtÞ
                2     Materials and Methods                                                                                     ¼                          :                  (3)
                                                                                                                 ROIUT ðtÞ             C p ðtÞ þ Cr ðtÞ
                2.1     Dual-Reporter Model
                                                                                                      If it is assumed that Cf and C r are roughly equivalent and
                Using a two-tissue compartment model to approximate the tis-                       C P ≪ C r , then Eq. (3) can be simplified to
                sue distribution of the targeted imaging reporter and a one-tissue
                compartment model to approximate the tissue distribution of the                                       ROIT ðtÞ − ROIUT ðtÞ Cb ðtÞ
                untargeted reporter (Fig. 1), it is possible to demonstrate that the                                                      ¼         :                         (4)
                ratio of uptake of the two reporters at any given time point is                                            ROIUT ðtÞ        C f ðtÞ
                proportional to the receptor density of the tissue interest. Spe-
                cifically, the concentration of the targeted imaging reporter in a                 Depending on the tumor kinetic parameters, the assumption that
                region of interest was modeled as a sum of the concentration of                    C P ≪ C r may or may not be true25; however, by 30 min post-
                the reporter in the blood and in two tissue compartments: the                      injection, inclusion of a typical tracer plasma concentration
                blood plasma concentration, Cp ; the unbound or nonspecifically                    curve from an independent study26 assuming a 5% tumor
                bound concentration in the interstitial space, Cf ; and the concen-                blood volume had a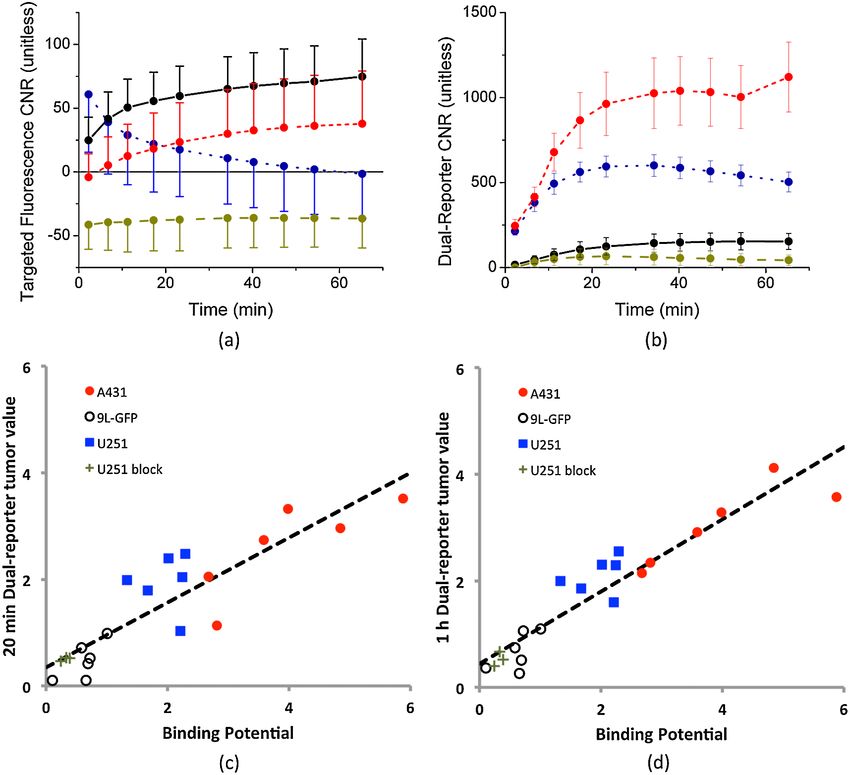
Tichauer et al.: Improved tumor contrast achieved by single time point dual-reporter fluorescence imaging

                                    dCb ðtÞ                                                        points were multiplied by the ratio of targeted to untargeted
                                            ¼ k3 C f ðtÞ − k 4 C b ðtÞ;                 (5)        fluorescence measured from the injected fluorescent cocktail
                                      dt
                                                                                                   using the imaging system.
                where k 3 is the rate constant governing the binding of reporter
                in the interstitial space to specific receptors and k 4 is the rate                2.3     Imaging Protocol
                constant governing the separation of the bound reporter from
                its specific receptor back into the interstitial space. Finally, if                Just before imaging, the mice were anesthetized with ketamine-
                it is assumed that after a given initial time Cb and Cf are in                     xylazine (100∶10 mg∕kg i.p.), and the superficial tissue sur-
                equilibrium (i.e., dCb ðtÞ∕dt ¼ 0), then k 3 ∕k 4 can be substituted               rounding the tumors was removed. Each mouse was then placed
                for Cf ∕Cb on the righthand side of Eq. (4):                                       tumor side down on a glass slide and loosely secured with
                                                                                                   surgical tape. Once plated, the mice were positioned onto the
                                  ROIT ðtÞ − ROIUT ðtÞ k3                                          imaging plane of an Odyssey Scanner (LI-COR Biosciences,
                                                      ¼ ≡ BP;                           (6)
                                       ROIUT ðtÞ       k4                                          Lincoln, NE). The Odyssey Scanner employs raster scanning
                                                                                                   and two lasers (emitting at 685 and 785 nm) to excite the
                where k 3 ∕k 4 is, by definition, the binding potential, BP, which is              targeted and untargeted fluorophores simultaneously, pixel by
                equal to the product of the affinity of the targeted reporter for its              pixel, and uses a series of dichroic mirrors to decouple
                receptor and the receptor density.27 Because the ratio on the left-                fluorescence from the LI-COR 700-nm fluorescent reporter
                hand side of Eq. (6) is proportional to the binding potential, it                  and the LI-COR 800-nm fluorescent reporter.
                follows that contrast in a dual-reporter image is driven by the
                level of expression of the targeted receptor and not other factors                 2.4     Image Analysis
                such as hemodynamic delivery of the reporter or the amount of
                reporter injected.                                                                 A major purpose of this study was to compare the tumor contrast
                                                                                                   attainable with the dual-reporter approach to a conventional
                2.2     Animal Experiments                                                         fluorescence-guided surgery approach that achieves contrast
                                                                                                   through targeted fluorescence uptake alone. To accomplish
                To investigate the potential of the proposed dual-reporter ima-                    this, contrast was quantified by calculating the average signal
                ging approach for improving tumor discrimination, a study was                      in the tumor and subtracting the average signal in the
                conducted on 32 immune-deficient SCID mice (Charles River,                         skin. Then this contrast value was divided by the standard devia-
                Wilmington, MA). Twenty-six-week-old mice were inoculated                          tion (SD) of signal in the skin to estimate contrast-to-noise
                with a human neuronal glioblastoma (U251; supplied from                            ratio (CNR). This calculation can be displayed mathematically
                Dr. Mark Israel, Norris Cotton Cancer Center, Dartmouth-                           as follows:
                Hitchcock Medical Center), a cancer cell line known to express
                moderate levels of EGFR;28,29 another six mice were inoculated                                                      Stu ðtÞ − Ssk ðtÞ
                                                                                                                       CNRðtÞ ¼                       ;                  (7)
                with a human epidermoid carcinoma (A431; ATCC, Manassas,                                                                  σ sk ðtÞ
                VA), known to express a very large amount of EGFR;30 and the
                final six mice were inoculated with a rat gliosarcoma (9L-GFP;                     where Stu ðtÞ is the average signal measured in the tumor, Ssk ðtÞ
                supplied by Dr. Bogdanov, Dartmouth Medical School), a cell                        is the average signal in the skin, and σ sk ðtÞ is the SD of the signal
                line known to express very little EGFR.28 In all cases, the tumors                 in the skin at time t. Figure 2 demonstrates the utility of CNR
                were introduced by injecting 1 × 10⁶ tumor cells in Matrigel®                      over the tumor-to-background ratio typically used to evaluated
                (BD Biosciences, San Jose, CA) into the subcutaneous space on                      fluorescence images. The figure depicts two simulated signal
                the left thigh of the mice. The tumors were then allowed to grow                   profiles transecting two regions, a background region and a
                to a size of approximately 150 mm3 before imaging (roughly 2                       tumor region (given positive contrast), from a theoretical
                weeks). For imaging, the mice were separated into two larger                       image. It is obvious from the figure that the location of the
                groups. In the first group, which included nine U251 mice,                         tumor is considerably more apparent in the red profile than
                six 9L-GFP mice, and six A431 mice, the uptake of both an                          the blue profile; however, both profiles exhibit the same
                untargeted fluorescence reporter (carboxylate form of the                          tumor-to-background ratio (tumor signal/background signal)
                IRDye 700DX NHS Ester; LI-COR Biosciences, Lincoln,                                of 11. On the other hand, the CNR is 16.0 for the red profile
                NE) and an EGFR-targeted fluorescence reporter (IRDye                              and 1.6 for the blue profile, showing that CNR better represents
                800CW EGF; LI-COR Biosciences, Lincoln, NE) was imaged                             the ability to visually discriminate contrast in an image.
                at approximately 5-min intervals in the first hour after intrave-                      A receiver operating characteristic (ROC) curve analysis was
                nous injection. In the second group, which included the remain-                    also carried out to further investigate the strength of each ima-
                ing 11 U251 mice, the uptake of the two reporters was imaged at                    ging approach for localizing a tumor. It was completed on an
                a single time point 24 h after reporter injection. In the first                    image-by-image basis for both the targeted fluorescence images
                group, three of the U251 mice were injected with the fluorescent                   and the dual-reporter images in all unblocked U251 mice at 1
                reporter cocktail 15 min after a 30-nmol (100 mL PBS) intra-                       and 24 h postinjection. The ROC was automated by setting the
                venous injection of free human recombinant EGF (Millipore,                         upper threshold in each image to the maximum pixel value in the
                Temecula, CA) to carry out a blocking study (negative control).                    image and adjusting the lower threshold incrementally by 5% of
                This was repeated for five of the mice in the 24-h imaging pro-                    the maximum value from zero up to the maximum pixel value.
                tocol, and these mice are referred to as “U251 Block” in the                       At each increment, every pixel of the image was characterized as
                figures. To account for intensity differences due to quantum                       follows: if it was part of the tumor, it was recorded as a true
                yield and relative reporter concentrations, as well as imaging                     positive (TP) if its value was greater than the lower threshold
                efficiency differences at the two wavelength bands, for the                        and a false positive (FP) if its value was less than the lower
                two reporters, the untargeted fluorescence images at all time                      threshold. Conversely, if the pixel was not part of the tumor,

                Journal of Biomedical Optics                                              066001-3                                                 June 2012   •   Vol. 17(6)

Downloaded From: https://www.spiedigitallibrary.org/journals/Journal-of-Biomedical-Optics on 13 Mar 2021
Terms of Use: https://www.spiedigitallibrary.org/terms-of-use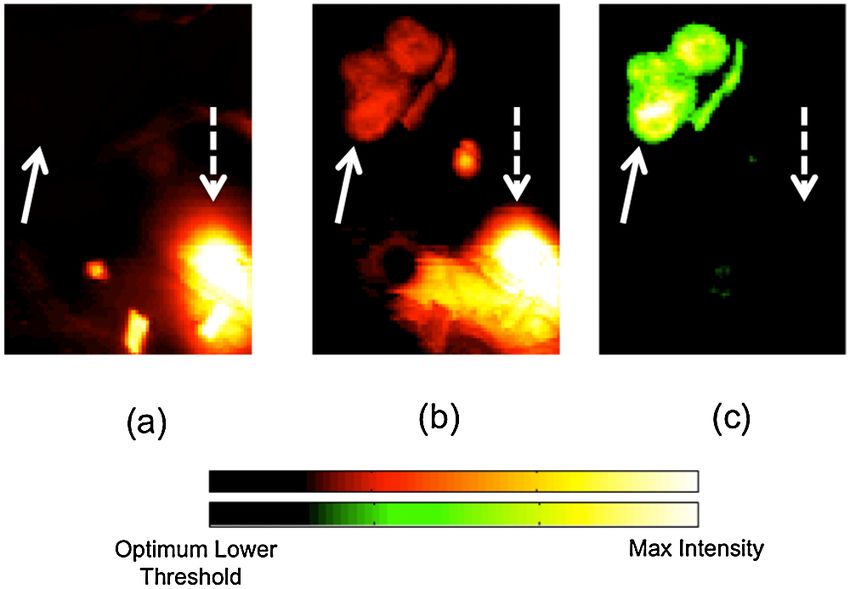
Tichauer et al.: Improved tumor contrast achieved by single time point dual-reporter fluorescence imaging
Fig. 2 Two theoretical signal profiles of an image composed of back-
ground tissue and a tumor are displayed. Both profiles demonstrated a
contrast of 1 or a contrast-to-background ratio of 11, but owing to large
differences in noise characteristics, the location of the tumor is much
easier to see in the red profile with a contrast-to-noise ratio (CNR) of
16.0 than in the blue profile with a CNR of 1.6. A CNR profile from
the dual-reporter image displayed in Fig. 5(f) is also presented as a
solid black line for comparison.
it was recorded as a false negative (FN) if its value was greater
than the lower threshold and a true negative (TN) if its value was
less than the lower threshold. The location of the tumor
was determined from white-light images taken of the mouse
before imaging. Following this characterization, the standard
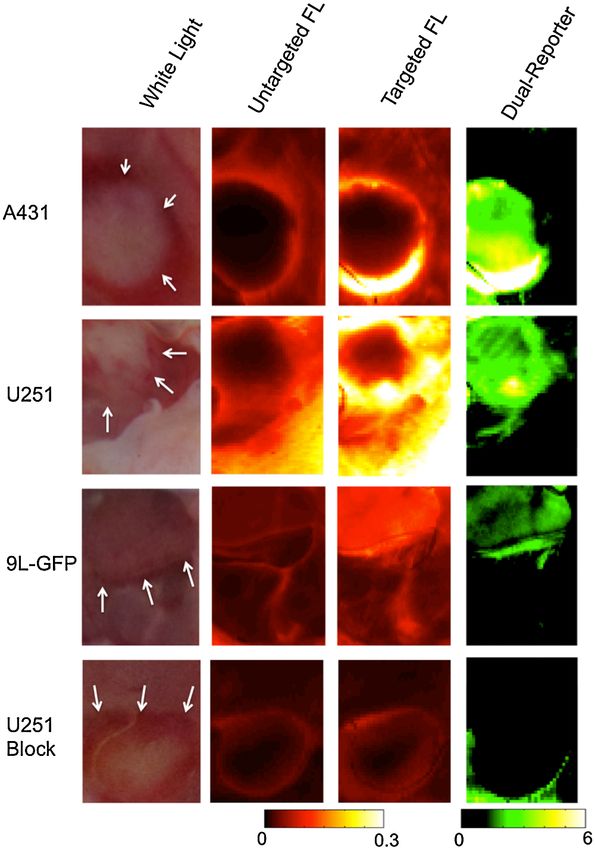
principles of ROC analysis were employed. Specifically, for Fig. 3 Fluorescence and dual-reporter images at 1 h after dual-reporter
each image the sensitivity ¼ TP∕ðTP þ FNÞ and specificity ¼ injection. Columns 1 to 4 display a typical preimaging white light pic-
ture and corresponding untargeted fluorescence uptake (IRdye 700DX),
TN∕ðFP þ TNÞ were calculated at each threshold and ROC
targeted fluorescence uptake (EGF-IRdye 800CW), and dual-reporter
curves were created (sensitivity versus 1—specificity). Finally, images of each tumor line (row 1 ¼ A431, row 2 ¼ U251, row
the area under the ROC curve was calculated for all images to 3 ¼ 9L-GFP, and row 4 ¼ blocked U251), respectively. The location
estimate the accuracy of the targeted fluorescence uptake and of the tumor is highlighted for each case on the white-light image by
dual-reporter approaches for correctly identifying tumor over the dashed yellow line.
normal tissue.
2.5 Statistics U251), it was easier to locate the tumor using the dual-reporter
All statistical analyses were carried out with the statistical soft- image [from Eq. (6)] than with the targeted or untargeted fluor-
ware package, SPSS (IBM®, Armonk, NY). For temporal ana- escence images alone at 1 h. Figure 4 elaborates on these obser-
lyses, a mixed two-way repeated-measures ANOVA with time as vations, presenting a more quantitative analysis. In Fig. 4(a), the
the within-subject variable and tumor group as the between- average CNRs of targeted fluorescence uptake in A431, U251,
subject factor was employed. A two-way mixed ANOVA 9L-GFP, and blocked U251 tumors are depicted within 1 h after
with Bonferroni correction was used to analyze tumor injection of the dual-reporter mixture. A repeated-measures
contrast-to-noise for each imaging method and at each imaging mixed ANOVA demonstrated a significant two-way effect in
time point after reporter injection. Linear regression was the data in the form of a significant time-by-tumor line effect
employed to compare dual-reporter results with in vivo binding (P < 0.01). This suggested that the dynamics of the tumor
potentials.21 Statistical significance was based on P < 0.05. All lines were significantly different; in particular, the U251 tumors
data are presented as mean SD unless stated otherwise. tended to exhibit a quicker release of the targeted reporter after
injection than the other groups. Despite this effect, however, the
3 Results between-subject omnibus test suggested that uptake differences
Figrue 3 presents representative targeted and untargeted fluor- were not significant between the tumor lines, at any time point in
escence images, as well as the corresponding white-light any tumor line, and no correlation was found between targeted
image and a dual-reporter image, in each tumor group at 1 h fluorescence uptake and the expected magnitude of EGFR
after intravenous injection of a mixture of EGFR-targeted expression in the different tumor lines at any time point. On
and untargeted fluorescent reporters (fluorescing at 800 and the other hand, the time courses of the dual-reporter tumor
700 nm, respectively). In a strictly qualitative sense, for the CNRs [depicted in Fig. 3(b)] demonstrated a clear ability to
two tumors that are known to express EGFR (A431 and resolve the location of the tumor using dual-reporter imaging
Journal of Biomedical Optics 066001-4 June 2012 • Vol. 17(6)
Downloaded From: https://www.spiedigitallibrary.org/journals/Journal-of-Biomedical-Optics on 13 Mar 2021
Terms of Use: https://www.spiedigitallibrary.org/terms-of-use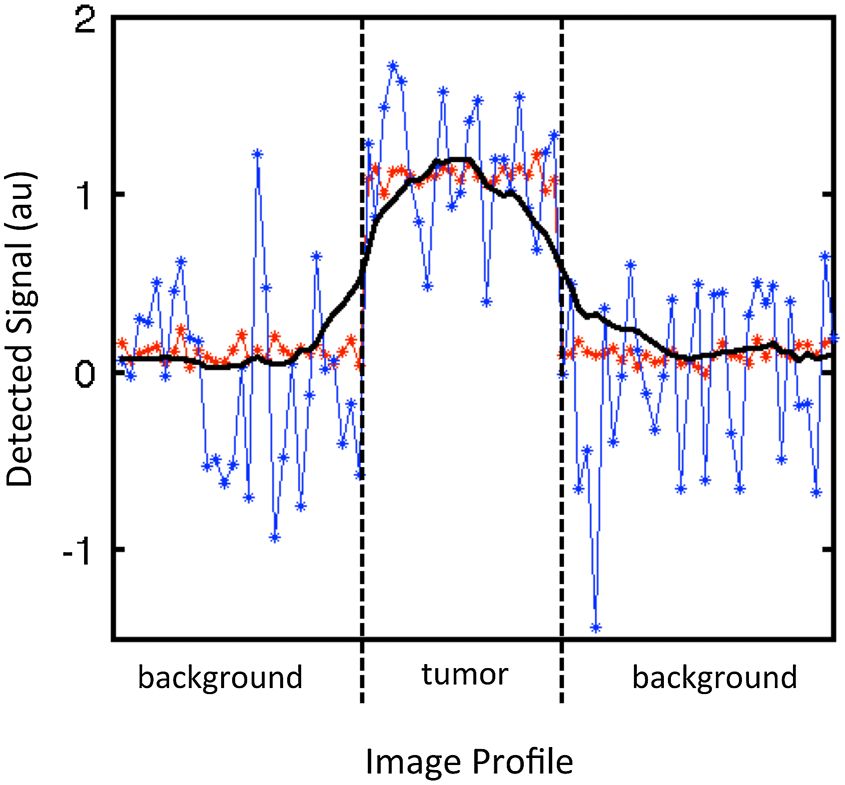
Tichauer et al.: Improved tumor contrast achieved by single time point dual-reporter fluorescence imaging

                Fig. 4 Targeted fluorescence uptake versus dual-reporter imaging within 1 h of reporter injection. The mean  standard error targeted fluorescence
                uptake tumor contrast-to-noise ratio (CNR) within 1 h of reporter injection is presented in (a) for each tumor group (A431 ¼ red; U251 ¼ blue;
                9L-GFP ¼ black; blocked U251 ¼ dark yellow). The mean  standard error tumor CNR determined by the dual-reporter approach for the same
                tumor groups as in (a) is presented in (b). The correlation between the average dual-reporter image value of the tumor in each mouse at 20 min
                and 1 h after reporter injection and the corresponding binding potential (an in vivo marker of receptor expression) are presented in (c) and (d), respec-
                tively. Data points from each tumor line are color-coded to match the data in (a) and (b). The slope of the 20-min correlation was 0.61  0.12 (r ¼ 0.89,
                P < 0.05), and the 1-h correlation was 0.68  0.05 (r ¼ 0.94, P < 0.01).

                at all time points after injection (even at 1 min) for the U251 and                measures.21 This approach takes as input the full temporal
                A431 tumor lines, and by 20 min after reporter injection for the                   uptake curve of the targeted and untargeted reporters in the
                9L-GFP tumor line (P < 0.001). The dual-reporter image CNR                         first hour after injection and employs a simplified reference tis-
                of the blocked U251 tumors never reached a level of signifi-                       sue model22 to measure binding potential using the uptake of
                cance over the background. Moreover, by 20 min, the average                        the untargeted reporter as a “reference tissue.” A statistically sig-
                dual-reporter image value in the tumor [Eq. (6)] measured in                       nificant correlation was observed between the two measures at
                each tumor group was significantly different from all other                        20 min and 1 h, with slopes of 0.61  0.12 (P < 0.05, r ¼ 0.89)
                tumor groups, and the difference correlated with the expected                      and 0.68  0.05 (P < 0.01, r ¼ 0.94), respectively.
                differences in EGFR expression between the groups. More spe-                           Although the dual-reporter approach demonstrated obvious
                cifically, at 20 min, the average tumor dual-reporter CNR in the                   improvements over targeted fluorescence uptake alone for the
                blocked U251 line, expected to express the least amount of                         localization of EGFR-expressing cancerous tissue, fluorescence
                EGFR, was 67  59; in the 9L-GFP line, expected to express                         uptake is generally measured at much longer time points after
                a little amount of EGFR, was 116  49; in the U251 line,                           injection because of the known lack of sensitivity at early time
                expected to express a moderate level of EGFR, was                                  points.31 For comparison, targeted and untargeted fluorescence
                578  59; and in the A431 line, expected to express the most                       uptakes were also measured in a separate set of U251 and
                EGFR of the tumor lines, was 922  172. To investigate this                        blocked U251 mice at a single time point 24 h after reporter
                relationship further, correlation plots were created relating the                  injection. Figure 5(a) shows a box-plot of the targeted fluores-
                dual-reporter tumor value at 2 min [Fig. 4(c)] and 1 h [Fig. 4(d)]                 cence uptake at both 24 h and 1 h for the U251 and blocked
                to the in vivo binding potential, a quantitative marker of receptor                U251 groups. As demonstrated by the plot, the only group
                expression that has been validated against ex vivo and in vitro                    that presented an average tumor CNR that was significantly

                Journal of Biomedical Optics                                              066001-5                                               June 2012   •   Vol. 17(6)

Downloaded From: https://www.spiedigitallibrary.org/journals/Journal-of-Biomedical-Optics on 13 Mar 2021
Terms of Use: https://www.spiedigitallibrary.org/terms-of-use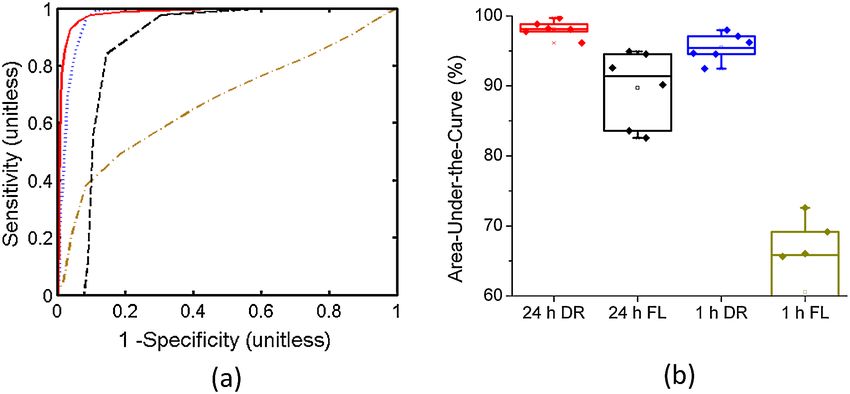
Tichauer et al.: Improved tumor contrast achieved by single time point dual-reporter fluorescence imaging

                Fig. 5 Tumor contrast-to-noise ratio (CNR) comparison is shown between targeted fluorescence uptake and dual-reporter images. A box-plot of the
                tumor CNR determined from targeted fluorescence uptake images at 1 and 24 h after reporter injection in mice with blocked (FL B) and unblocked (FL)
                U251 tumors are presented in (a). Each data point represents an individual average tumor CNR from one mouse. Blue data points represent measure-
                ments taken in unblocked U251 tumors and red data points represent measurements taken in blocked U251 tumors. A similar box plot is presented in
                (b), with the tumor CNR determined from the dual-reporter (DR) images at 1 and 24 h after reporter injection. Examples of the targeted fluorescence
                uptake images at 1 and 24 h are presented in (c) and (e), respectively, and examples of the dual-reporter images at 1 and 24 h are presented in (d) and (f).
                The maximum value in each image was chosen as the maximum threshold of the color scale, and the lower threshold was chosen independently in
                each image by a receiver operating characteristic analysis to optimize the tumor CNR in each case.

                different from zero (p < 0.001)—i.e., measurable from the back-                    the dual-reporter value in the blocked groups was not. The aver-
                ground—was the fluorescence at 24 h in the unblocked U251                          age dual-reporter tumor CNR at 1 h was 503  58, and at 24 h
                group, with a CNR of 217  78. For comparison, Fig. 5(b)                           was 631  175 (there was no statistically significant difference
                displays dual-reporter tumor CNR data for the same groups                          between these). Of note, the dual-reporter tumor CNR was sig-
                as in Fig. 5(a). For this measure, the tumor CNRs of both                          nificantly higher than the targeted fluorescence CNR at 24 h
                the 1- and 24-h dual-reporter values in the unblocked U251                         (P < 0.01). Examples of the targeted fluorescence uptake
                mice were significantly different from zero (P < 0.001), whereas                   image and the dual-reporter image from a single U251

                Journal of Biomedical Optics                                              066001-6                                                 June 2012   •   Vol. 17(6)

Downloaded From: https://www.spiedigitallibrary.org/journals/Journal-of-Biomedical-Optics on 13 Mar 2021
Terms of Use: https://www.spiedigitallibrary.org/terms-of-use
Tichauer et al.: Improved tumor contrast achieved by single time point dual-reporter fluorescence imaging
Fig. 6 Receiver operating characteristic (ROC) analysis was used, where typical ROC curves for the dual-reporter approach at 1 h after reporter injec-
tion (blue line) and 24 h after injection (red line), and for the targeted fluorescence uptake approach at 1 h after injection (dark yellow line) and 24 h
after injection (dashed black line) are presented in (a) for a 1-h U251 mouse and a 24-h U251 mouse. The areas-under-the-curve (approximate accura-
cies) of each ROC curve for all U251 mice at 1 and 24 h using the targeted fluorescence uptake approach (FL) and the dual-reporter approach (DR) are
displayed in boxplots in (b). The color-coding matches that in (a). Each data point corresponds to an independent accuracy measurement for a single
mouse using a single approach.
mouse at 1 h after reporter injection are presented in Fig. 5(c)
and 5(d), respectively, and examples from a single U251 mouse
at 24 h after reporter injection are presented in Fig. 5(e) and 5(f).
The maximum value in each image was chosen as the maximum
threshold of the color scale, and the lower threshold was chosen
independently in each image by ROC analysis to optimize the
tumor CNR in each case and observe the ultimate potential of
each approach.
A more in-depth analysis of the benefits of dual-reporter ima-
ging over targeted fluorescence alone is presented in Fig. 6. In
Fig. 6(a), typical ROC curves for the different approaches of
localizing cancerous tissue (targeted fluorescence uptake or
dual-reporter imaging at 1 or 24 h after reporter injection)
are presented for U251 mice. By applying the area-under-the-
curve analysis to each cancer localization approach for each
mouse, the average accuracy of the targeted fluorescence uptake
Fig. 7 Qualitative specificity of targeted fluorescence uptake and dual-
approach was estimated to be 60% 13% and 90% 5% at 1 reporter approaches for localizing cancerous tissue is shown. Examples
and 24 h after reporter injection, respectively. The average accu- of an untargeted fluorescence uptake image (a) and a corresponding
racy of the dual-reporter approach was 96% 2% and 98% targeted fluorescence uptake image (b) and dual-reporter image
1% at 1 and 24 h after reporter injection. The improved accuracy (c) at 24 h in a U251 mouse are presented. The solid white arrow points
of the dual-reporter approach at 1 and 24 h postinjection over the to the location of the tumor, and the dashed white arrow points to the
location of a kidney. Images are thresholded to optimize tumor locali-
targeted fluorescence uptake approach at 24 h was statistically zation based on a receiver operating characteristic analysis.
significant (P < 0.001 for the 24-h dual-reporter approach com-
pared to 24-h fluorescence uptake and P < 0.05 for the 1-h dual-
reporter approach compared to the 24-h fluorescence uptake).
Fluorescence uptake in the kidney of targeted and untargeted 4 Discussion
reporters was visible in 3 of the 6 24-h U251 mice [Fig. 7(a) and Use of fluorescence-guided surgery (FGS) in oncology has been
7(b)]. As the kidney is the major filtering organ of these repor- limited, yet is growing in applications. Typically, receptor-
ters, signal from the kidney can be a significant source of non- mediated guidance would involve three steps. The first step
receptor-mediated fluorescence uptake.32 To avoid potential would be systemic administration of the fluorescent molecule
bias, the kidney was not included in the ROC analyses presented that is targeted to a cancer-specific receptor (e.g., EGFR).
in Fig. 6; however, it is a strength of the dual-reporter approach The second step would be to wait for the fluorescence to be car-
that the kidney, although dominant in the targeted and untar- ried by the blood throughout the body, and then, importantly, to
geted fluorescence uptake images, was not visible in the wait for the washout of any nonspecific uptake of the targeted
dual-reporter images [Fig. 7(c)]. Image thresholds for Fig. 7 fluorescence to ensure that the tumor-to-background CNR is
were selected based on optimal thresholds from ROC analyses maximal for tumor delineation. The third step would then be
of each image, independently. the surgery, removing any suspicious tissue that is highlighted
Journal of Biomedical Optics 066001-7 June 2012 • Vol. 17(6)
Downloaded From: https://www.spiedigitallibrary.org/journals/Journal-of-Biomedical-Optics on 13 Mar 2021
Terms of Use: https://www.spiedigitallibrary.org/terms-of-useTichauer et al.: Improved tumor contrast achieved by single time point dual-reporter fluorescence imaging
by abnormally high fluorescence uptake. The problem with this by the fact that the 24-h dual-reporter images were roughly
approach is that the uptake of a targeted reporter in a specific equivalent in performance to the 1-h dual-reporter images
region of interest is not just governed by that region’s targeted despite having poorer signal-to-noise characteristics because
receptor expression; other physiological factors play roles as of prolonged fluorescence washout (the SNR in the fluorescence
well, such as blood flow, vessel permeability, cellular interna- images was approximately 3 times higher at 1 h than at 24 h).
lization, interstitial pressure, and other nonreceptor-mediated However, if the goal is also to estimate the level of targeted
mechanisms of reporter uptake and retention.33 Therefore a receptor expression, the influence of cellular internalization
cancerous lesion with a low blood supply or a high interstitial should be avoided, since this will cause the receptor expression
pressure may exhibit low fluorescence uptake despite overex- to be overestimated (the average dual-reporter value in U251
pressing the targeted receptor or an organ that acts to filter tumors was 3.5 0.3 at 1 h after fluorescence injection and
agents from the bloodstream (kidney, liver, spleen) may have 10.6 1.2 at 24 h). An interesting caveat to the dual-reporter
substantial fluorescence uptake despite expressing no specific images is that they are not as affected by signal contamination
receptor. At this early time in the development of fluorescence in organs of filtration. The reporters used in this study are less
guidance, it is still not clear if bulk uptake of reporter might have than 5.5 nm in diameter and are therefore preferentially filtered
advantages over binding assay reporters; however, it is clearly by the kidney.35,36 Significant untargeted and targeted fluores-
true that most conventional approaches to this problem have not cence signal from the kidney was evident in three of the
been able to attribute their signal uniquely to binding alone. This 24-h mice; however, since the uptake of the two reporters
study presents a dual-reporter imaging approach that was was relatively equivalent, any signal from the kidney was nor-
designed to mitigate the nonreceptor-mediated effects of tar- malized out in the dual-reporter images (Fig. 7). The upshot of
geted reporter uptake by accounting for them with the measure- this is that the dual-reporter approach could make it possible to
ment of a simultaneously injected untargeted fluorescence localize tumors that are proximal to organs of filtration, a feat
reporter. Fluorescence was imaged on an Odyssey system, that would be very difficult using targeted fluorescence
which is a flat-panel scanner, incapable of use during surgery. uptake alone.
This system was employed to study the potential for dual- The second salient finding of this study was that by 20 min
reporter imaging to be done, since it is optimized to eliminate after reporter injection, the dual-reporter approach demonstrated
cross-talk between concentrations of the two LI-COR fluores- a statistically significant correlation with a more robust in vivo
cent reporters used. Further studies are ongoing to test out measure of the binding potential that employed fitting the full
the approaches of this study using a hyperspectral fluorescence time courses of fluorescence uptake of both reporters [Fig. 4(c)].
surgical microscope. This robust binding potential measure makes fewer physiologic
In Sec. 2, an expression was derived, building upon earlier assumptions than the dual-reporter approach and has been vali-
work,20 relating the uptake of a targeted imaging reporter and an dated in a previous study against ex vivo and in vitro measures of
untargeted reporter in a region of interest with the binding poten- receptor density.21 Although it represented a strong correlation,
tial in that region (a parameter directly proportional to the the slope of the regression was significantly different from 1
targeted receptor density27). To investigate the utility of this (0.68 0.05), probably because there is approximately 10
approach, the uptakes of the two fluorescent reporters (one tar- times greater autofluorescence in the 700-nm (untargeted) fluor-
geted to EGFR and one untargeted) were tracked over the first escence channel than in the 800-nm (targeted) fluorescence
1 h after injection in four tumor groups (A431, U251, 9L-GFP, channel. This would lead to an overestimation of the untargeted
and U251 blocked) and at 24 h in U251 and U251 blocked fluorescence uptake, and from Eq. (6), it can be seen that this
groups. The results were used to compare the dual-reporter overestimation will lead to an underestimation in the numerator
approach against conventional targeted fluorescence uptake and an overestimation in the denominator, compounding to
imaging with regard to tumor discrimination. cause a magnified underestimation in the single time point—
There were two salient findings of the current study. The first derived binding potential. It is possible to account for the
was that the dual-reporter approach for tumor discrimination, increased autofluorescence in the 700-nm channel by collecting
when applied at 1 or 24 h after reporter injection, was superior a pre-reporter injection scan, which can be subtracted from sub-
at discriminating the tumor compared to the more conventional sequent scans. However, in the field of fluorescence-guided sur-
approach of measuring targeted fluorescence uptake alone at 1 gery where the imaging field could be constantly changing, it
and 24 h postinjection (Figs. 5 and 6), in terms of both tumor-to- would be better to develop an approach that would be insensitive
background CNR and area under the ROC curve. This is a major to motion. Indeed, the strength of the correlation between the
finding, since surgical guidance by targeted fluorescence alone dual-reporter value and binding potential presented in Fig. 3(c),
has been highly touted to improve the success rate of tumor which was significant from 20 min on, demonstrates that this
resections, and this study suggests that employing a dual- approach has the potential to provide a real-time, motion-insen-
reporter approach can improve the ability to discriminate sitive measure of receptor density and therefore can discriminate
between tumor and healthy tissue even further. Moreover, between tissues based on receptor density, and receptor den-
because the dual-reporter approach is so successful at relatively sity alone.
early times after reporter injection (1 h), it could require lower Activatable fluorescence reporters that do not fluoresce
dosages of imaging reporters, which may improve the potential unless bound to a specific receptor of interest constitute another
for new reporters to gain clinical approval.34 Additionally, the approach to amplify receptor density—derived contrast in
signal attained at these early points is more likely to be driven FGS.6,16 Because these reporters provide contrast only where
by targeted receptor availability as opposed to longer-term activator is present, many of the factors that involve nonrecep-
effects such as cellular internalization. If the goal is simply tor-mediated reporter uptake and could confound conventional
to discriminate between tumor and healthy tissue, though, cel- FGS are avoided; however, the contrast is still founded on
lular internalization may actually improve the contrast, as seen reporter binding as opposed to receptor density as with the
Journal of Biomedical Optics 066001-8 June 2012 • Vol. 17(6)
Downloaded From: https://www.spiedigitallibrary.org/journals/Journal-of-Biomedical-Optics on 13 Mar 2021
Terms of Use: https://www.spiedigitallibrary.org/terms-of-useTichauer et al.: Improved tumor contrast achieved by single time point dual-reporter fluorescence imaging
dual-reporter approach. This means that the amount of activated uptake of the targeted fluorescence. This dual-reporter approach
fluorescence is still influenced, perhaps strongly, by the hemo- was demonstrated to provide instantaneous maps that could be
dynamics, vascular permeability, and interstitial pressure of the used to discriminate between cancerous and healthy tissue with
region of interest, all of which can vary substantially both significantly better contrast-to-noise and ROC analysis charac-
between and within tumors.37 The proposed dual-reporter teristics than targeted fluorescence uptake alone. Furthermore,
approach avoids these factors by essentially referencing the by 20 min after injection of the fluorescent reporters, the average
uptake of the targeted reporter to the untargeted reporter. There- dual-reporter image values in a range of tumor types demon-
fore, the sensitivity of this approach is predominantly governed strated a significant correlation with tumor binding potential
by the dynamic range of the imaging modality used to detect the (a measure of receptor expression). Therefore, not only does
fluorescence. In other words, if the assumptions of the dual- the dual-reporter approach outperform conventional fluores-
reporter theory hold, the approach is only susceptible to fluor- cence intensity imaging for tumor/healthy tissue discrimination,
escence detection saturation or areas with a limited SNR, which but it also provides an estimate of tumor receptor status, which
could occur in areas of necrosis. could be used to inform the choice or progress of biological
Reiterating the Methods, the dual-reporter expression relat- therapies that target the same receptors.10,42
ing the uptake of the targeted and untargeted reporters with the
level of receptor expression [Eq. (6)] relies on the following Acknowledgments
assumptions: that the plasma and free-space components of
the respective reporter concentrations in tissue are roughly This research was funded by NIH grants P01CA84201,
equivalent, that the bound and unbound states of the targeted R01CA156177, and U54CA151662. K. M. Tichauer acknowl-
reporter are in an instantaneous equilibrium (i.e., the adiabatic edges funding from the Canadian Institutes of Health Research
approximation holds22), that the tissue concentration of the postdoctoral fellowship program.
untargeted reporter is predominantly composed of reporter in
the extravascular space (i.e., the plasma component is approxi- References
mately negligible or equivalent in all cases), and that the targeted
1. S. Gioux, H. S. Choi, and J. V. Frangioni, “Image-guided surgery using
tracer concentration is considerably less than the receptor
invisible near-infrared light: fundamentals of clinical translation,”
concentration to avoid receptor saturation effects. The strength Mol. Imag. 9(5), 237–255 (2010).
of the results in the current study suggests that each of these 2. B. W. Pogue et al., “Review of neurosurgical fluorescence imaging
assumptions is adequate; however, further investigation is neces- methodologies (vol. 16, pg 493, 2010),” IEEE J. Sel. Top. Quant.
sary to fully characterize the utility of the presented FGS 16(6), 1847–1847 (2010).
technique. In a previous study, the plasma curves of IRDye 3. D. W. Roberts et al., “Coregistered fluorescence-enhanced tumor resec-
tion of malignant glioma: relationships between delta-aminolevulinic
800CW-EGF and IRDye 700DX (the targeted and untargeted acid-induced protoporphyrin IX fluorescence, magnetic resonance ima-
agents used in this study) were found to be very similar in ging enhancement, and neuropathological parameters,” J. Neurosurg.
immune-compromised mice, being approximated by exponen- 114(3), 595–603 (2011).
tial decay functions with half-lives of approximately 8 min,26 4. W. Stummer et al., “Fluorescence-guided surgery with 5-aminolevulinic
and studies are ongoing to investigate the reliability of the acid for resection of malignant glioma: a randomised controlled multi-
other model assumptions under different physiological condi- centre phase III trial,” Lancet Oncol. 7(5), 392–401 (2006).
5. S. L. Troyan et al., “The FLARE intraoperative near-infrared fluores-
tions (nonspecific binding and cellular internalization) using cence imaging system: a first-in-human clinical trial in breast cancer
a full kinetic forward model. Furthermore, we are investigating sentinel lymph node mapping,” Ann. Surg. Oncol. 16(10), 2943–2952
the potential of employing an enantiomer of the targeted reporter (2009).
as an untargeted reporter to minimize any differences between 6. G. M. van Dam et al., “Intraoperative tumor-specific fluorescence
the two. For example, for EGFR targeting it would be possible imaging in ovarian cancer by folate receptor-alpha targeting: first in-
human results,” Nat. Med. 17, 1315–1319 (2011).
to use an anti-EGFR Affibody® imaging agent for the targeted
7. N. Kosaka et al., “Near infrared fluorescence-guided real-time endo-
reporter and a negative control Affibody imaging agent for the scopic detection of peritoneal ovarian cancer nodules using intra-
untargeted reporter.38,39 With respect to receptor saturation, it venously injected indocyanine green,” Int. J. Cancer 129(7), 1671–1677
may be possible to include second-order kinetics in the (2011).
model to account for this;40 however, keeping injected fluores- 8. E. M. Sevick-Muraca et al., “Imaging of lymph flow in breast cancer
cence at tracer levels (i.e., far below receptor saturation) will patients after microdose administration of a near-infrared fluorophore:
feasibility study,” Radiology 246(3), 734–741 (2008).
likely be important for clinical translation. In a previous 9. N. Tagaya et al., “Intraoperative identification of sentinel lymph nodes
study, we demonstrated that a 1-nmol dose of IRDye by near-infrared fluorescence imaging in patients with breast cancer,”
800CW-EGF in mice would be far below saturation levels Am. J. Surg. 195(6), 850–853 (2008).
for a tumor of similar EFGR expression.26 Another factor 10. R. Weissleder and M. J. Pittet, “Imaging in the era of molecular
that can also affect the efficacy of the dual-reporter approach oncology,” Nature 452(7187), 580–589 (2008).
is the influence of specific uptake from other organs. More spe- 11. H. Maeda et al., “Tumor vascular permeability and the EPR effect in
macromolecular therapeutics: a review,” J. Control. Release 65(1–2),
cifically, the technique requires that the tumor of interest 271–284 (2000).
expresses significantly more of the targeted receptor than the 12. R. K. Jain, “Transport of molecules, particles, and cells in solid tumors,”
surrounding tissue. This could be a problem for EGFR targeting, Annu. Rev. Biomed. Eng. 1, 241–263 (1999).
for example, if the tumor is proximal to an organ like the pan- 13. J. W. Baish et al., “Role of tumor vascular architecture in nutrient
creas, which is known to express a significant amount of and drug delivery: an invasion percolation-based network model,”
Microvasc. Res. 51(3), 327–346 (1996).
EGFR.26,41
14. G. Lappin, “Microdosing: current and the future,” Bioanalysis 2(3),
In conclusion, the current study introduces a novel fluores- 509–517 (2010).
cence-guided surgery technique that utilizes a secondary, untar- 15. V. Ntziachristos et al., “Fluorescence molecular tomography resolves
geted imaging reporter to account for nonreceptor-mediated protease activity in vivo,” Nat. Med. 8(7), 757–760 (2002).
Journal of Biomedical Optics 066001-9 June 2012 • Vol. 17(6)
Downloaded From: https://www.spiedigitallibrary.org/journals/Journal-of-Biomedical-Optics on 13 Mar 2021
Terms of Use: https://www.spiedigitallibrary.org/terms-of-useTichauer et al.: Improved tumor contrast achieved by single time point dual-reporter fluorescence imaging
16. R. Weissleder et al., “In vivo imaging of tumors with protease-activated superagonist autocrine cycle,” Proc. Natl. Acad. Sci. USA 84(21),
near-infrared fluorescent probes,” Nat. Biotechnol. 17(4), 375–378 (1999). 7567–7570 (1987).
17. D. M. Goldenberg et al., “Radioimmunodetection of cancer with radio- 30. C. J. Wikstrand et al., “Cell surface localization and density of the
active antibodies to carcinoembryonic antigen,” Cancer Res. 40(8 Pt. 2), tumor-associated variant of the epidermal growth factor receptor,
2984–2992 (1980). EGFRvIII,” Cancer Res. 57(18), 4130–4140 (1997).
18. K. R. Hine et al., “Radioimmunodetection of gastrointestinal neoplasms 31. J. L. Kovar et al., “A systematic approach to the development agents for
with antibodies to carcinoembryonic antigen,” Cancer Res. 40(8 Pt. 2), optical imaging of mouse of fluorescent contrast cancer models,” Anal.
2993–2996 (1980). Biochem. 367(1), 1–12 (2007).
19. J. T. Liu et al., “Quantifying cell-surface biomarker expression in thick 32. J. L. Kovar et al., “A systematic approach to the development of fluo-
tissues with ratiometric three-dimensional microscopy,” Biophys. J. rescent contrast agents for optical imaging of mouse cancer models,”
96(6), 2405–2414 (2009). Anal. Biochem. 367(1), 1–12 (2007).
20. B. W. Pogue et al., “Imaging targeted-agent binding in vivo with two 33. A. I. Minchinton and I. F. Tannock, “Drug penetration in solid tumours,”
probes,” J. Biomed. Opt. 15(3), 030513 (2010). Nat. Rev. Cancer 6(8), 583–592 (2006).
21. K. M. Tichauer et al., “In vivo quantification of tumor receptor binding 34. J. K. Willmann et al., “Molecular imaging in drug development,” Nat.
potential with dual-reporter molecular imaging,” Mol. Imag. Biol. Rev. Drug Discov. 7(7), 591–607 (2008).
(2011). 35. T. Olafsen and A. M. Wu, “Antibody vectors for imaging,” Semin. Nucl.
22. A. A. Lammertsma and S. P. Hume, “Simplified reference tissue model Med. 40(3), 167–181 (2010).
for PET receptor studies,” Neuroimage 4(3 Pt. 1), 153–158 (1996). 36. H. S. Choi et al., “Renal clearance of quantum dots,” Nat. Biotechnol.
23. J. Logan et al., “Distribution volume ratios without blood sampling from 25(10), 1165–1170 (2007).
graphical analysis of PET data,” J. Cereb. Blood Flow Metab. 16(5), 37. M. W. Dewhirst et al., “Morphologic and hemodynamic comparison of
834–840 (1996). tumor and healing normal tissue microvasculature,” Int. J. Radiat.
24. C. T. Kuan, C. J. Wikstrand, and D. D. Bigner, “EGF mutant receptor Oncol. Biol. Phys. 17(1), 91–99 (1989).
vIII as a molecular target in cancer therapy,” Endocr. Relat. Cancer 8(2), 38. V. Tolmachev et al., “Imaging of EGFR expression in murine xenografts
83–96 (2001). using site-specifically labelled anti-EGFR 111In-DOTA-Z EGFR:2377
25. J. Delforge et al., “In vivo quantification and parametric images of the Affibody molecule: aspect of the injected tracer amount,” Eur. J. Nucl.
cardiac beta-adrenergic receptor density,” J. Nucl. Med. 43(2), 215–226 Med. Mol. Imag. 37(3), 613–622 (2010).
(2002). 39. S. B. Lee et al., “Affibody molecules for in vivo characterization of
26. K. S. Samkoe et al., “High vascular delivery of EGF, but low receptor HER2-positive tumors by near-infrared imaging,” Clin. Canc. Res.
binding rate is observed in AsPC-1 tumors as compared to normal 14(12), 3840–3849 (2008).
pancreas,” Mol. Imag. Biol. Aug. 17, [Epub ahead of print] (2011). 40. V. Chernomordik et al., “Quantitative analysis of Her2 receptor expres-
27. R. B. Innis et al., “Consensus nomenclature for in vivo imaging of sion in vivo by near-infrared optical imaging,” Mol. Imag. 9(4),
reversibly binding radioligands,” J. Cereb. Blood Flow Metab. 27(9), 192–200 (2010).
1533–1539 (2007). 41. M. Korc et al., “Binding of epidermal growth factor in rat pancrea-
28. S. L. Gibbs-Strauss et al., “Detecting epidermal growth factor receptor tic acini,” Biochem. Biophys. Res. Commun. 111(3), 1066–1073
tumor activity in vivo during cetuximab therapy of murine gliomas,” (1983).
Acad. Radiol. 17(1), 7–17 (2010). 42. M. Hassan et al., “In vivo method to monitor changes in HER2 expres-
29. J. J. Smith, R. Derynck, and M. Korc, “Production of transforming sion using near-infrared fluorescence imaging,” Mol. Imag., Sep 30,
growth factor alpha in human pancreatic cancer cells: evidence for a [Epub ahead of print] (2011).
Journal of Biomedical Optics 066001-10 June 2012 • Vol. 17(6)
Downloaded From: https://www.spiedigitallibrary.org/journals/Journal-of-Biomedical-Optics on 13 Mar 2021
Terms of Use: https://www.spiedigitallibrary.org/terms-of-useYou can also read