Upregulated expression of MMP family genes is associated with poor survival in patients with esophageal squamous cell carcinoma via regulation of ...
←
→
Page content transcription
If your browser does not render page correctly, please read the page content below
ONCOLOGY REPORTS 44: 29-42, 2020

                    Upregulated expression of MMP family genes
                   is associated with poor survival in patients with
                esophageal squamous cell carcinoma via regulation of
                 proliferation and epithelial‑mesenchymal transition
                 GUIFENG XU1*, LING OU2*, YING LIU2*, XIAO WANG2,3, KAISHENG LIU2, JIELING LI1,
                 JUNJUN LI4, SHAOQI WANG5, DANE HUANG6, KAI ZHENG1 and SHAOXIANG WANG1

          1
         School of Pharmaceutical Sciences, Shenzhen University Health Science Center, Shenzhen, Guangdong 518060;
          2
         Department of Pharmacy, The Second Clinical Medical College (Shenzhen People's Hospital), Jinan University,
       Shenzhen 518020; 3Guangzhou Jinan Biomedicine Research and Development Center, Jinan University, Guangzhou,
    Guangdong 510310; 4State Key Laboratory of Quality Research in Chinese Medicine, Institute of Chinese Medical Sciences,
     University of Macau, Taipa, Macau 999078; 5Department of Oncology, Hubei Provincial Corps Hospital, Chinese People
        Armed Police Forces, Wuhan, Hubei 430061; 6Guangdong Province Engineering Technology Research Institute of
               Traditional Chinese Medicine, Guangdong Provincial Key Laboratory of Research and Development
                           in Traditional Chinese Medicine, Guangzhou, Guangdong 510095, P.R. China

                                     Received October 13, 2019; Accepted March 13, 2020

                                                  DOI: 10.3892/or.2020.7606

Abstract. Matrix metalloproteinases (MMPs) are involved in        stage. Gene set enrichment analysis and gene co‑expression
the cleavage of several components of the extracellular matrix    analysis were performed to investigate the potential mecha-
and serve important roles in tumor growth, metastasis and         nism of action of MMPs in ESCC. The MMP family was
invasion. Previous studies have focused on the expression of      associated with several signaling pathways, such as epithe-
one or several MMPs in esophageal squamous cell carcinoma         lial‑mesenchymal transition (EMT), Notch, TGF‑β, mTOR
(ESCC); however, in the present study, the transcriptomics of     and P53. Cell Counting Kit‑8, colony formation, wound
all 23 MMPs were systematically investigated with a focus         healing assays and western blotting were used to determine
on the prognostic value of the combination of MMPs. In this       the effect of BB‑94, a pan‑MMP inhibitor, on proliferation
study, 8 overlapping differentially expressed genes of the        and migration of ESCC cells. BB‑94 treatment decreased
MMP family were identified based on data obtained from            ESCC cell growth, migration and EMT. Therefore, MMPs
Gene Expression Omnibus and The Cancer Genome Atlas.              may serve both as diagnostic and prognostic biomarkers of
The prognostic value of these MMPs were investigated; the         ESCC, and MMP inhibition may be a promising preventive
receiver operating characteristic curves, survival curves and     and therapeutic strategy for patients with ESCC.
nomograms showed that the combination of 6 selected MMPs
possessed a good predictive ability, which was more accurate      Introduction
than the prediction model based on Tumor‑Node‑Metastasis
                                                                  Esophageal cancer (EC) is the seventh most common type
                                                                  of cancer and the sixth highest cause of cancer‑associated
                                                                  death (1). Based on the histopathological appearance, EC is
Correspondence to: Professor Shaoxiang Wang or Professor Kai      primarily classified into two types, esophageal squamous cell
Zheng, School of Pharmaceutical Sciences, Shenzhen University     carcinoma (ESCC) and esophageal adenocarcinoma (EAC) (2).
Health Science Center, 1066 Xueyuan Avenue, Nanshan, Shenzhen,    ESCC is the most general type of EC, which accounts for ~90%
Guangdong 518060, P.R. China                                      of all EC patients in China, whereas EAC is more frequently
E‑mail: wsx@szu.edu.cn
                                                                  observed in developed countries (3). Treatment of ESCC
E‑mail: zhengk@szu.edu.cn
                                                                  includes surgery, radiotherapy and chemotherapy, and have
*
    Contributed equally                                           drastically improved survival. However, the five‑year survival
                                                                  in patients with ESCC remains relatively low, primarily due
Key words: matrix metalloproteinase family, esophageal squamous   to delayed diagnosis (4). Squamous cell carcinoma antigen
cell carcinoma, Gene Expression Omnibus, The Cancer Genome        and CYFRA 21‑1 are tumor markers commonly used for
Atlas, prognostic value, epithelial‑mesenchymal transition        managing patients with ESCC; however they have limited
                                                                  application for detection of early stage ESCC due to their lack
                                                                  of specificity and accuracy (5,6). Therefore, the identification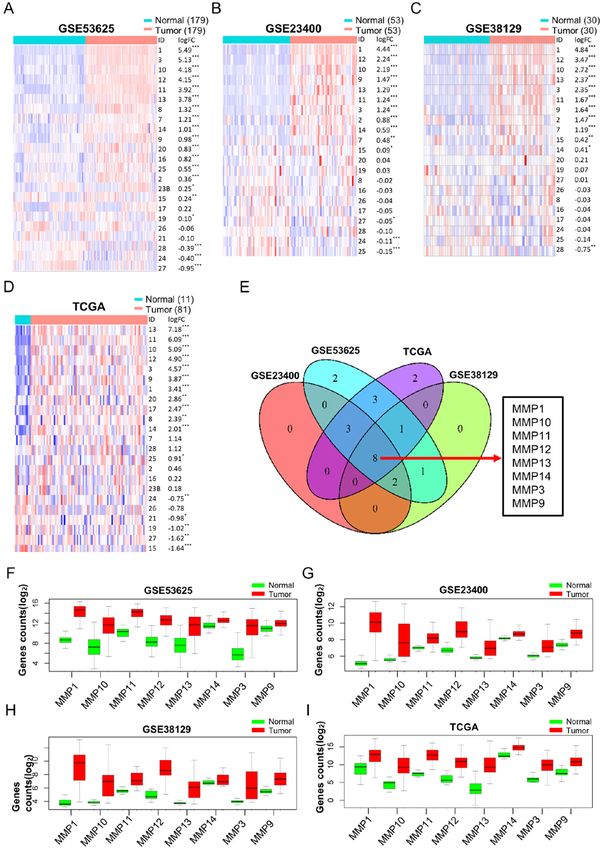
30     XU et al: UPREGULATED EXPRESSION OF THE MMP FAMILY OF GENES IS ASSOCIATED WITH POOR SURVIVAL IN ESCC

of novel molecular biomarkers may assist in the development         Prognostic value analysis of the MMP family. Using the
of novel diagnostic and therapeutic strategies for ESCC.            ʻsurvivalʼ package in R, the most suitable combination
    Matrix metalloproteinases (MMPs) are considered to serve        of DEGs, the one with the best predictive ability, was
vital roles in early carcinogenic events, tumor growth, invasion,   selected out through a stepwise multivariate Cox hazard
metastasis and tumor‑induced angiogenesis (7). The MMP              regression analysis (23). Pearson correlation coefficients
family of proteins are zinc‑dependent endopeptidases, and to        between all the MMP family members were also calculated.
date, 23 members have been identified in humans (8). MMPs           Subsequently, the screened MMPs were used to establish a
participate in the cleavage of extracellular matrix (ECM) compo-    prognosis scoring system. According to this analysis, the
nents, such as collagen and elastin (9). MMP dysregulation is       adjusted hazard ratio (HR) was calculated. The risk scores
associated with diagnostic and prognostic significance in breast,   for patients with ESCC were calculated using the following
ovarian and colon cancer (10,11). Based on previous studies,        formula:
the protein expression levels of several MMPs, such as MMP‑1
                                                                                                   Σ Coef x Exp
                                                                                                    n
and MMP‑12, are associated with malignancy and metastasis                           Risk score =          i       i
in human ESCC (12,13). However, to date, there are no studies                                      i=1

which have systematically assessed the impact of all MMP family     where n indicates the gene number being used in the model,
members on the prognosis of ESCC to the best of our knowledge.      Coef is the coefficient of each gene, and Exp is the gene
    Bioinformatics analysis has been used to identify potential     expression level. Based on the MMP signature, a nomo-
targets for cancer prevention and treatment (14,15), establishing   gram which could predict the survival rate of patients was
a theoretical framework to efficiently guide experimental           constructed (24). Also, the concordance index (C index),
verification and research. Both Gene Expression Omnibus             which can assess the accuracy of the prediction model, was
(GEO; ncbi.nlm.nih.gov/geo/) and The Cancer Genome Atlas            calculated. Moreover, the receiver operating characteristic
(TCGA; cancer.gov/tcga.) databases contain clinical data            (ROC) curve was plotted and the area under the curve (AUC)
on cancer patients and their gene expression profiles. In the       was calculated to measure both the sensitivity and specificity
present study, based on expression information from these two       of the prediction model which applied when the AUC value
databases, whether MMPs could be used to predict the diag-          was >0.6 (25). Based on the median value of risk scores, the
nosis and prognosis of patients with ESCC was assessed. The         samples were stratified into low‑risk and high‑risk groups,
potential role of MMPs in the growth and migration of ESCC          and the prognostic difference between these two groups was
cells were assessed in vitro. The results showed that MMPs          investigated using Kaplan‑Meier (K‑M) survival curves. In
may serve as potential diagnostic markers of ESCC, and that         addition, the predictive value of a survival prediction model
inhibition of MMPs may be a potential therapeutic approach          based on the TNM stage using the ROC and the K‑M curves
for treatment of ESCC.                                              was determined.

Materials and methods                                               Nomogram integrating the signature of MMPs and TNM stage.
                                                                    Based on the coefficients from the multivariate Cox regression
Patient data. Microarray data from GSE53625 (16),                   analysis, a nomogram integrating the MMP signature and
GSE23400 (17) and GSE38129 (18) datasets were obtained from         TNM stage was constructed using the ʻrmsʼ package (26). The
the GEO database, whereas the RNA seq data from an ESCC             accuracy of the nomogram was evaluated based both on the
cohort was downloaded from TCGA. Clinicopathological                C index and AUC values. Additionally, to graphically assess
characteristics, including age, Tumor‑Node‑Metastasis (TNM)         the performance of this nomogram, calibration curves were
stage (19), tumor grade and sex, as well as survival data were      plotted. According to the median value of the risk scores
included in the GSE53625 dataset (179 cases) and in TCGA            calculated using Cox regression analysis, patients were sepa-
(95 cases). Using SPSS version 23.0 (IBM, Corp.), the asso-         rated into two groups; the distribution of the risk score and
ciation between overall survival (OS) and clinicopathological       survival status of the patients were visualized to evaluate the
characteristics of patients were investigated using univariate      prognostic difference between the two groups.
Cox regression analysis. In addition, characteristics with P
ONCOLOGY REPORTS 44: 29-42, 2020                                                31

ʻWGCNAʼ package in R to identify co‑expressed MMP genes         (1:3,000) and slug (1:3,000) antibodies, all of which were
within the model (29). The networks of co‑expressed genes       purchased from Cell Signaling Technology, Inc. After washing
were drawn using Cytoscape (version 3.7.1) (30).                the membranes 3 times with PBST, they were incubated with
                                                                secondary horseradish peroxidase (HRP)‑conjugated anti-
Cell lines and cell culture. KYSE30 and KYSE450 cell            bodies (1:2,000; cat. no. 7074; Cell Signaling Technology, Inc.)
lines were purchased from The Cell Bank of Type Culture         for 1 h at room temperature. Signals were visualized using a
Collection of the Chinese Academy of Sciences. Cells were       Chemiluminescent HRP Substrate (EMD Millipore) and visu-
cultured in RPMI‑1640 medium (Gibco; Thermo Fisher              alized with a UVP GelStudio PLUS Touch Imaging system
Scientific, Inc.) supplemented with 10% FBS (Gibco; Thermo      (Analytik Jena).
Fisher Scientific, Inc.), 100 U/ml penicillin (Gibco; Thermo
Fisher Scientific, Inc.), and 100 µg/ml streptomycin (Gibco;    Statistical analysis. R version 3.61, SPSS version 23.0 (IBM
Thermo Fisher Scientific, Inc.) and incubated at 37˚C in a      Corp) and GraphPad Prism version 8 (GraphPad Software,
humidified incubator with 5% CO2.                               Inc.) were used to analyze obtained data. Two‑tailed P values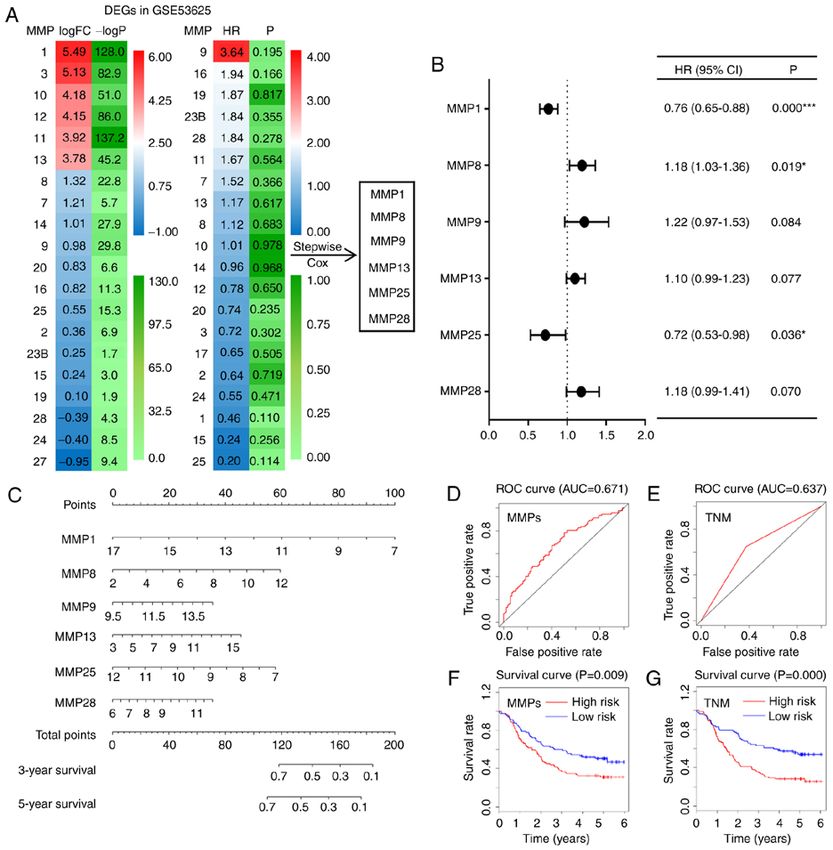
32       XU et al: UPREGULATED EXPRESSION OF THE MMP FAMILY OF GENES IS ASSOCIATED WITH POOR SURVIVAL IN ESCC

Figure 1. Cox regression analysis of clinical data of patients with ESCC. Forest plots of univariate and multivariate Cox regression analysis of clinicopatho-
logical characteristics affecting OS in patients with ESCC in (A and B) the GSE53625 dataset and (C and D) TCGA. *P
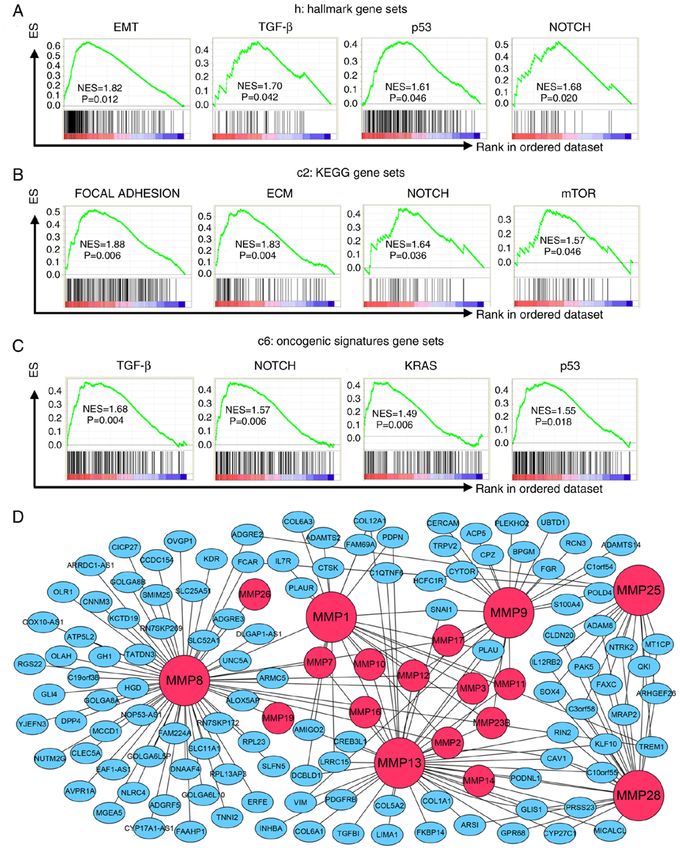
ONCOLOGY REPORTS 44: 29-42, 2020                                                              33

Figure 2. Differential MMP expression analysis between tumor and normal tissues in ESCC. Heat maps, sorted in descending order of log FC, including
every MMP in (A) GSE53625, (B) GSE23400 and (C) GSE38129 datasets, and in (D) TCGA database. Red and blue colors represent high and low expression,
respectively. (E) Venn diagram showing overlapping dysregulated MMPs based on the 4 datasets mentioned above. (F‑I) Box diagrams showing the expression
levels of the 8 overlapping dysregulated MMPs in tumor tissues compared with normal tissues in all 4 datasets. *P
34      XU et al: UPREGULATED EXPRESSION OF THE MMP FAMILY OF GENES IS ASSOCIATED WITH POOR SURVIVAL IN ESCC

Figure 3. Prediction models based on MMP expression or TNM stage for ESCC. (A) Heat maps showing the log FCs and HRs of DEGs in the GSE53625
dataset. Based on six of the DEGs, a stepwise multivariate Cox hazard regression analysis was performed to screen the best MMP signature. (B) Forest plot
of the adjusted HRs, 95% CIs of HR, and P values of the MMPs included in the model. (C) Nomogram to visualize the MMP signature prediction model.
(D and E) ROC curves of both the MMP model and the TNM stage model. (F and G) Kaplan‑Meier curves of the risk scores calculated using the prediction
models. *P
ONCOLOGY REPORTS 44: 29-42, 2020 35
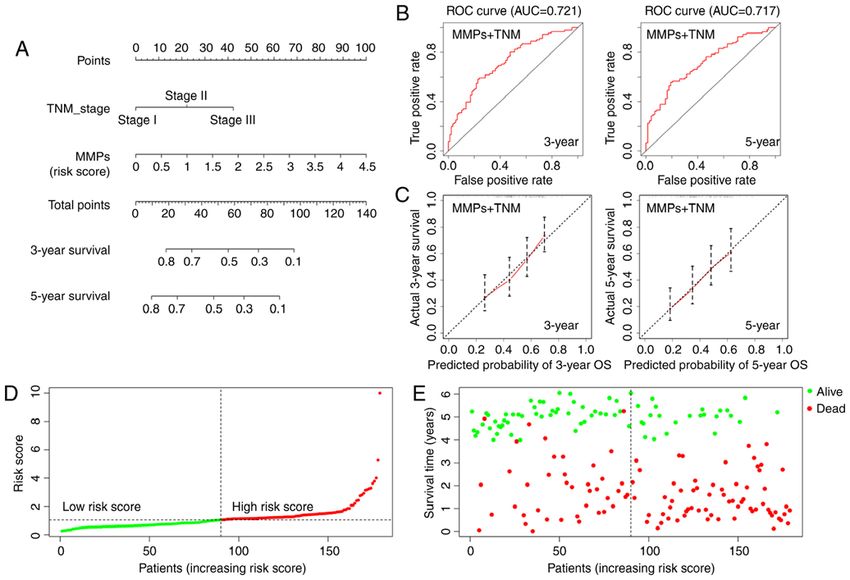
Figure 4. Prediction model combining the MMP signature and TNM stage information. (A) Nomogram integrating MMP and TNM stage for prediction of
the 3‑year and 5‑year survival rates. (B) ROC curves showing the predictive accuracy of the nomograms for 3‑year and 5‑year survival rates. (C) Calibration
curves showing the calibration of the model either for a 3‑year or a 5‑year survival rate prediction in terms of the agreement between predicted and observed
outcomes. (D) Risk score distribution of patients in ascending order, classified into low‑risk (green) and high‑risk (red) groups. (E) Survival time and status
of patients plotted in order of increasing risk scores; red and green dots represent dead and alive patients, respectively. MMP, matrix metalloproteinase; TNM
stage, Tumor‑Node‑Metastasis stage; ROC, receiver operating characteristic; AUC, area under the curve; OS, overall survival.
model based on the TNM stage (AUC=0.637) (31). The latter the MMP signature and TNM stage (C index=0.652; Fig. 4A).
is commonly used to predict the prognosis of cancer patients. The ROC curves indicated that the MMP‑TNM‑integrated
Finally, based on the median risk score, ESCC patients were nomogram had improved predictive ability compared with
divided into low‑risk and high‑risk groups; a survival curve each model alone (AUC=0.721 for 3‑year survival, AUC=0.717
indicated that patients with lower risk scores had improved for 5‑year; Fig. 4B). The calibration curves indicated that the
survival (P=0.009; Fig. 3F). Patients at TNM stage I/II also predicted outcome was broadly consistent with the actual
showed significantly higher survival rates compared with outcome, suggesting that the new model accurately predicted
patients at TNM stage III (P=0.000; Fig. 3G). Survival and the results (Fig. 4C). In addition, the risk scores of patients
ROC curves of each selected MMP are shown in Fig. S1A‑B, were calculated using the combined model, resulting in a
and the survival curves were generally consistent with the reclassification of patients as belonging to either a low‑risk or
results from the website OSescc (bioinfo.henu.edu.cn/DBList. a high‑risk group (Fig. 4D). Accordingly, in the distribution
jsp), a tool to assess OS and relapse free survival based on chart of survival status, the number of surviving patients from
the expression of given genes or probes (32). To analyze the the low‑risk group was 51, while the number of deaths was
correlation among each MMP gene, Pearson correlation coef- 39. By contrast, there were 22 patients alive and 67 dead in
ficients of all the MMP family members were also calculated the high‑risk group (Fig. 4E). The distribution map of survival
(Fig. S1C). Notably, similar results, including both ROC and status showed that the patients from the high‑risk group had
survival curves of the prediction model, were obtained using higher mortality rates. Therefore, the MMP‑TNM‑integrated
TCGA (81 cases) which had a smaller sample size than the nomogram may be a more effective tool for clinicians to
GSE53625 dataset (179 cases; Fig. S1D‑G). Thus, MMPs were predict prognosis of ESCC patients.
accurate prognostic predictive factors of ESCC.
Biological function of MMP family members in ESCC.
Prognostic value of a model combining the MMP signature To determine how MMPs affect ESCC cells, GSEA was
model and the TNM stage model. To develop a more accurate performed based on the risk score calculated by the MMP
prediction model, a nomogram was constructed integrating both signature model. Tables SVII‑IX show all the results which were36 XU et al: UPREGULATED EXPRESSION OF THE MMP FAMILY OF GENES IS ASSOCIATED WITH POOR SURVIVAL IN ESCC Figure 5. Pathways and co‑expressed genes associated with the MMP signature model. (A) Enriched pathways based on hallmark gene sets. (B) Enriched pathways based on KEGG gene sets. (C) Enriched pathways based on oncogenic signatures gene sets. (D) Gene co‑expression network of MMPs in the prediction model. MMP, matrix metalloproteinase; KEGG, Kyoto Encyclopedia of Genes and Genomes; EMT‑epithelial‑mesenchymal transition; ECM, extracellular matrix. significant (P
ONCOLOGY REPORTS 44: 29-42, 2020                                                                37

Figure 6. ESCC cell growth following inhibition of MMP activity using BB‑94. Viability of (A) KYSE30 and (B) KYSE450 cells treated with different
concentrations of BB‑94 measured after 0, 24, 48 and 72 h. Representative images of colony formation assays in (C) KYSE30 and (D) KYSE450 cells treated
with different concentrations of BB‑94. Scale bar, 1 cm. Quantitative analysis of colony formation in (E) KYSE30 and (F) KYSE450 cells. **P
38      XU et al: UPREGULATED EXPRESSION OF THE MMP FAMILY OF GENES IS ASSOCIATED WITH POOR SURVIVAL IN ESCC

Figure 7. ESCC cell migration and association between expression of EMT markers and MMP expression. Representative images of wound healing assays
in (A) KYSE30 and (B) KYSE450 cells treated with different concentrations of BB‑94. Quantitative analysis of wound healing in the (C) KYSE30 and
(D) KYSE450 cells. (E and F) Protein expression levels of the EMT markers, E‑Cadherin, Vimentin, β‑Catenin, Snail and Slug were detected by western
blot. (G) Pearson correlation coefficient plots between expression of MMPs and EMT markers based on the GSE53625 dataset. ***P
ONCOLOGY REPORTS 44: 29-42, 2020                                                 39

the prediction model and EMT markers were calculated. Gene          improved accuracy, highlighting its suitability for clinical
expression of MMP‑9 and MMP‑13 were positively associated           use. The second model, comprised of screened MMPs from
with Vimentin. In addition, MMP‑1, ‑9 and ‑13 were positively       TCGA, also showed an improved predictive ability compared
associated with SNAI1 expression (Fig. 7G). These results           with the TNM stage model; the corresponding survival curves
suggest that the MMP family members are involved in the             showed a similar tendency, that is, the high‑risk group had
regulation of ESCC migration.                                       a worse prognosis compared with low‑risk group. Although
                                                                    the GSE53625 dataset was a considerably larger dataset than
Discussion                                                          TCGA (179 samples vs. 81), similar results were obtained
                                                                    from both datasets, suggesting that the MMP‑based prediction
Poor prognosis for ESCC patients is largely due to delayed          model was more powerful for predicting survival. In addition,
diagnosis. The 5‑year survival rate for patients with ESCC is       a nomogram was constructed integrating both the MMP signa-
relatively higher when the cancer is diagnosed at an earlier        ture and TNM stage, and this exhibited improved accuracy
stage (33), highlighting the importance of novel biomarkers         compared with the MMP signature‑based model and may thus
for early detection of ESCC. MMP family members degrade             be a more suitable tool for clinicians to predict the prognosis
ECM structural components, and this underlies tumor progres-        of patients with ESCC. This type of prediction model is in
sion (34). Duffy et al (35) demonstrated that MMP family            line with current trends toward personalized medicine and
members participate in tumor initiation and progression of          being more commonly used in other research areas (43,44).
breast cancer. The MMP family has been extensively studied          Therefore, the MMP‑TNM nomogram may be a vital tool for
in different types of cancer, highlighting the importance of        predicting survival of patients with ESCC.
the involvement of MMPs in development and progression                  Several signaling pathways associated with cancer
of various types of cancer, but previous studies were not           progression, such as EMT, Notch, TGF‑β, mTOR and P53,
systematic, instead focusing on one or a few MMPs (36,37).          are associated with the expression of different members
Furthermore, the prognostic role of specific MMPs remains           of the MMP family of proteins. MMPs could stimulate
controversial. For example, MMP‑9, which is one of the best         processes associated with EMT (45). For instance, the
studied MMPs, was identified as a significant prognostic factor     expression of MMP‑9 was associated with EMT genes in
in certain studies (38,39), whereas in other studies no signifi-    breast cancer samples (46). Pang et al (47) also showed that
cant effects were observed (40,41). Unlike the previous studies     MMP‑14 increases ESCC invasion and metastasis by reducing
that only focused on one or several MMP proteins detected           E‑Cadherin expression and subsequently inducing EMT.
by immunohistochemistry or ELISA, in the present study, the         Overexpression of MMP‑13 was observed in ESCC clinical
transcriptomics of all 23 MMPs were systematically investi-         tissues, and its upregulated expression increased cancer cell
gated, with a focus on the prognostic value of the combination      aggressiveness (48). Knockdown of MMP‑9 attenuated EMT
of MMPs in ESCC using bioinformatics analysis. The results          induced by TGF‑β1, and inhibited invasiveness and migration
of the bioinformatics analysis were subsequently confirmed          in ESCC (49). Notably, numerous studies have demonstrated
in vitro.                                                           the association between MMPs and Notch signaling in
    Upregulated expression of MMP‑1, ‑9, ‑13 has been previ-        several types of cancer (50,51), the latter of which serves
ously observed in ESCC tumor tissues compared with normal           an important role in development and determination of cell
tissues using immunohistochemistry (39). Han et al (13) also        fate (52). For example, a previous study identified Notch1 as an
showed that MMP‑12 expression was also upregulated in ESCC          MMP‑14 substrate in melanoma (53). Moreover, activation of
tumor tissues. Consistent with these studies, 8 MMPs, MMP‑1,        the PI3K/PTEN/AKT/mTOR pathway upregulated MMP‑9
‑3, ‑9, ‑10, ‑11, ‑12, ‑13 and ‑14) were differentially expressed   expression in hepatocellular carcinoma (54). On the contrary,
in 4 different datasets; all of which were upregulated in tumor     P53, as a metastasis suppressor, downregulated MMP‑1 and
tissues and shown to be clinically significant for potential use    MMP‑9 expression (55).
as diagnostic markers for ESCC. The majority of previous                Regarding co‑expression, several MMP genes are
studies reported to date suggest that increased gene expres-        co‑expressed with PDGFRB, CREB3L1, COL1A1 and other
sion levels of certain MMPs are significantly associated with a     collagen family members, such as COL12A1, COL5A2,
poor prognosis of ESCC (36,38). The use of multivariate Cox         COL6A1 and COL6A3, suggesting that MMPs participate in
regression analysis to construct a prediction model incorpo-        collagen‑mediated metabolic processes in ESCC. MMP‑13
rating several related genes provides a more robust predictive      expression is downregulated by CREB3L1, a metastasis
effect than models based on a single gene (42). In the present      suppressor which regulates the expression of a number of genes
study, all the MMP genes deemed to be dysregulated were used        involved in angiogenesis (56). Co‑expression analysis showed
to establish a survival prediction model. Using the GSE53625        that certain collagen family members, which are involved in
dataset, after screening using a stepwise multivariate Cox          cell proliferation and migration, are co‑expressed with specific
hazard regression analysis, the best prognostic MMP signature       MMP genes (58). In addition, co‑expressed genes, including
was established. Of note, none of the genes in this signature       QKI, KDR, PDGFRB and COL1A1, are associated with vascu-
alone was considered a significant prognostic factor (data          lature development (GO:0001944). In a previous study, it was
not shown), but the combination of these genes accurately           demonstrated that both MMP‑13 and PDGFRB were upregu-
predicted the prognosis of ESCC patients. Compared with             lated in papillary thyroid carcinoma (59). It is widely known
the survival prediction model based on the TNM stage that           that MMPs are associated with EMT, in the gene co‑expression
is commonly used (31), the model established in the present         network analysis, it was shown that MMPs were correlated
study predicted the survival rate of patients with ESCC with        with EMT markers such as VIM and SNAI1. In addition,
40 XU et al: UPREGULATED EXPRESSION OF THE MMP FAMILY OF GENES IS ASSOCIATED WITH POOR SURVIVAL IN ESCC
MMP‑13 was associated with TGFB1, which is important for healing migration assays and western blotting showed that
tumor viability, migration and metastasis in multiple types of inhibition of MMPs using BB‑94 reduced migration of ESCC
cancer (60). Taken together, these results highlight how MMP cells by suppressing EMT. Thus, MMP family members may
family members may influence the progression of ESCC and constitute potential therapeutic targets for prevention and
may be used to identify novels targets for the development of treatment of ESCC.
specific therapeutic strategies for ESCC treatment.
Cell proliferation and migration ability assays were Acknowledgements
performed to confirm the role of MMP family members in
ESCC cell proliferation and migration using a pan‑MMP Not applicable.
inhibitor. It has been demonstrated that the pan‑MMP inhibitor
BB‑94 inhibits growth and metastasis of human colon tumors Funding
in a patient‑like orthotopic model in nude mice (61). However,
to the best of our knowledge, there are no studies assessing the This study was financially supported by the National
effect of BB‑94 in ESCC. In the present study, the cytotoxic Natural Science Foundation of China (grant no. 81602625),
and phenotypic changes observed following treatment with t he Nat u r a l Scienc e Fou nd at ion of Gu a ngdong
BB‑94 were consistent with previous studies (62,63). Inhibition Province (grant no. 2018A030313122), the Science and
of MMPs by BB‑94 significantly reduced cell proliferation and Technology Planning Project of Guangdong Province
suppressed EMT. Thus, BB‑94 may be a potential therapeutic (grant no. 2017A010105013), the Pearl River S&T Nova
agent for treatment of ESCC. Further studies are required to Program of Guangzhou (grant no. 201710010011), the
determine the detailed mechanism and in vivo anti‑ESCC Cultivating Fund Project of Shenzhen People's Hospital
activity of BB‑94. (grant no. SYKYPY201926), and the Shenzhen Science and
The present study has several limitations. There were 81 Technology Project (grant nos. JCYJ20170302145059926,
tumor samples, whereas only 11 normal samples in TCGA. JCYJ20180305163658916 and JCYJ20180228175059744).
In TCGA, the number of normal samples is frequently
lower than the number of tumor samples in several types of Availability of data and materials
cancer, such as bladder urothelial carcinoma, breast invasive
carcinoma and colon adenocarcinoma (64). Thus, the GEO The datasets used and/or analyzed during the present study are
database GSE53625 dataset (including 179 normal samples available from the corresponding author on reasonable request.
and 179 tumor samples) was used to reduce the potential bias
introduced by the large difference in the number of samples. Authors' contributions
The design of the inhibition experiment was not completely
consistent with our prediction model. The optimal ESCC GX and SxW designed the study and performed the bioinfor-
therapeutic regimen would promote the activation of MMP‑1 matics analysis. KZ, LO, and YL performed the laboratory
and MMP‑25, and inhibit MMP‑8, ‑9, ‑13 and ‑28 concurrently. experiments. XW was responsible for the statistical analysis.
However, using a cocktail of agents able to exert these effects is GX wrote the manuscript. KZ and SxW revised the manuscript.
difficult. BB‑94 is one of the most widely used broad‑spectrum JiL, KL, JuL, DH and SqW assisted with the bioinformatics
inhibitors (63,65). However, using BB‑94 may have suppressed analysis. All authors read and approved the final version of the
several other MMPs upregulated in tumor tissues with manuscript.
different risk contributions. Thus, future studies should focus
on developing specific inhibitors targeting certain MMPs with Ethics approval and consent to participate
high risk scores. Another limitation was that gene expres-
sion profiles were used and the results showed that no single Not applicable.
MMP had a significant predictive ability by itself, but instead
the combination of specific MMPs exhibited good predictive Patient consent for publication
ability. Thus, the expression of MMP protein expression levels
or activity were not measured. Further testing regarding MMP Not applicable.
protein expression or activity in ESCC cell lines treated with
BB‑94 and relevant clinical specimen are required to confirm Competing interests
their potential involvement.
In summary, members of the MMP family may be The authors declare that they have no competing interests.
used as diagnostic and prognostic markers for ESCC. The
MMP signature model was more accurate for predicting the References
survival of patients with ESCC compared with the TNM
stage‑based model. When integrating the MMP signature 1. Bray F, Ferlay J, Soerjomataram I, Siegel RL, Torre LA and
model and TNM stage to predict the survival rate, accuracy Jemal A: Global cancer statistics 2018: GLOBOCAN estimates
was further improved, suggesting that MMPs have consid- of incidence and mortality worldwide for 36 cancers in 185
countries. CA Cancer J Clin 68: 394‑424, 2018.
erable predictive value. Moreover, it was shown that MMP 2. Pennathur A, Gibson MK, Jobe BA and Luketich JD: Oesophageal
family members may influence the prognosis of ESCC carcinoma. Lancet 381: 400‑412, 2013.
through impacting signaling pathways involved in cancer, 3. Zeng H, Zheng R, Zhang S, Zuo T, Xia C, Zou X and Chen W:
Esophageal cancer statistics in China, 2011: Estimates based on
such as EMT, TGF‑β, Notch, mTOR and P53. Finally, wound 177 cancer registries. Thoracic cancer 7: 232‑237, 2016.ONCOLOGY REPORTS 44: 29-42, 2020 41
4. Rustgi A and El‑Serag H: Esophageal carcinoma. N Engl J 26. Harrell FE Jr: rms: Regression modeling strategies. R package
Med 372: 1472‑1473, 2015. version 5.1‑2. http://cran.nexr.com/web/packages/rms/rms.pdf.
5. Shimada H, Nabeya Y, Okazumi SI, Matsubara H, Miyazawa Y, Accessed January 7, 2018.
Shiratori T, Hayashi H, Gunji Y and Ochiai T: Prognostic signif- 27. Subramanian A, Tamayo P, Mootha VK, Mukherjee S, Ebert BL,
icance of CYFRA 21‑1 in patients with esophageal squamous Gillette MA, Paulovich A, Pomeroy SL, Golub TR, Lander ES and
cell carcinoma. J Am Coll Surg 196: 573‑578, 2003. Mesirov JP: Gene set enrichment analysis: A knowledge‑based
6. Shimada H, Nabeya Y, Okazumi SI, Matsubara H, Shiratori T, approach for interpreting genome‑wide expression profiles. Proc
Gunji Y, Kobayashi S, Hayashi H and Ochiai T: Prediction of Natl Acad Sci USA 102: 15545‑15550, 2005.
survival with squamous cell carcinoma antigen in patients with 28. Liberzon A: A description of the molecular signatures database
resectable esophageal squamous cell carcinoma. Surgery 133: (MSigDB) web site. In: Stem Cell Transcriptional Networks.
486‑494, 2003. Springer, pp.153‑160, 2014.
7. Deryugina EI and Quigley JP: Matrix metalloproteinases and 29. Langfelder P and Horvath S: WGCNA: An R package for
tumor metastasis. Cancer Metastasis Rev 25: 9‑34, 2006. weighted correlation network analysis. BMC Bioinformatics 9:
8. Park HI, Ni J, Gerkema FE, Liu D, Belozerov VE and Sang QX: 559, 2008.
Identification and characterization of human endometase (matrix 30. Shannon P, Markiel A, Ozier O, Baliga NS, Wang JT, Ramage D,
metalloproteinase‑26) from endometrial tumor. J Biol Chem 275: Amin N, Schwikowski B and Ideker T: Cytoscape: A software
20540‑20544, 2000. environment for integrated models of biomolecular interaction
9. Page‑McCaw A, Ewald AJ and Werb Z: Matrix metallopro- networks. Genome Res 13: 2498‑2504, 2003.
teinases and the regulation of tissue remodelling. Nat Rev Mol 31. D'Journo XB: Clinical implication of the innovations of the 8th
Cell Biol 8: 221‑233, 2007. edition of the TNM classification for esophageal and esoph-
10. Wang S, Jia J, Liu D, Wang M, Wang Z, Li X, Wang H, Rui Y, ago‑gastric cancer. J Thorac Dis 10 (Suppl 22): S2671‑S2681,
Liu Z, Guo W, et al: Matrix Metalloproteinase expressions play 2018.
important role in prediction of ovarian cancer outcome. Sci 32. Wang Q, Wang F, Lv J, Xin J, Xie L, Zhu W, Tang Y, Li Y,
Rep 9: 11677, 2019. Zhao X, Wang Y, et al: Interactive online consensus survival
11. Gobin E, Bagwell K, Wagner J, Mysona D, Sandirasegarane S, tool for esophageal squamous cell carcinoma prognosis analysis.
Smith N, Bai S, Sharma A, Schleifer R and She JX: A pan‑cancer Oncol Lett 18: 1199‑1206, 2019.
perspective of matrix metalloproteases (MMP) gene expression 33. Lambert R and Hainaut P: Epidemiology of oesophagogastric
profile and their diagnostic/prognostic potential. BMC cancer 19: cancer. Best Pract Res Clin Gastroenterol 21: 921‑945, 2007.
581, 2019. 34. Coussens LM, Fingleton B and Matrisian LM: Matrix metal-
12. Peng HH, Zhang X and Cao PG: MMP‑1/PAR‑1 signal trans- loproteinase inhibitors and cancer‑trials and tribulations.
duction axis and its prognostic impact in esophageal squamous Science 295: 2387‑2392, 2002.
cell carcinoma. Braz J Med Biol Res 45: 86‑92, 2012. 35. Duffy MJ, Maguire TM, Hill A, McDermott E and O'Higgins N:
13. Han F, Zhang S, Zhang L and Hao Q: The overexpression and Metalloproteinases: Role in breast carcinogenesis, invasion and
predictive significance of MMP‑12 in esophageal squamous cell metastasis. Breast Cancer Res 2: 252‑257, 2000.
carcinoma. Pathol Res Pract 213: 1519‑1522, 2017. 36. Liu M, Hu Y, Zhang MF, Luo KJ, Xie XY, Wen J, Fu JH and
14. Yang X, Zhu S, Li L, Zhang L, Xian S, Wang Y and Cheng Y: Yang H: MMP1 promotes tumor growth and metastasis in
Identification of differentially expressed genes and signaling esophageal squamous cell carcinoma. Cancer Lett 377: 97‑104,
pathways in ovarian cancer by integrated bioinformatics analysis. 2016.
Onco Targets Ther 11: 1457‑1474, 2018. 37. Li H, Qiu Z, Li F and Wang C: The relationship between MMP‑2
15. Zheng MJ, Li X, Hu YX, Dong H, Gou R, Nie X, Liu Q, and MMP‑9 expression levels with breast cancer incidence and
Ying‑Ying H, Liu JJ and Lin B: Identification of molecular marker prognosis. Oncol Lett 14: 5865‑5870, 2017.
associated with ovarian cancer prognosis using bioinformatics 38. Zeng R, Duan L, Kong Y, Liang Y, Wu X, Wei X and Yang K:
analysis and experiments. J Cell Physiol 234: 11023‑11036, 2019. Clinicopathological and prognostic role of MMP‑9 in esophageal
16. Li J, Chen Z, Tian L, Zhou C, He MY, Gao Y, Wang S, Zhou F, squamous cell carcinoma: A meta‑analysis. Chin J Cancer
Shi S, Feng X, et al: LncRNA profile study reveals a three‑lncRNA Res 25: 637, 2013.
signature associated with the survival of patients with oesophageal 39. Gu ZD, Li JY, Li M, Gu J, Shi XT, Ke Y and Chen KN:
squamous cell carcinoma. Gut 63: 1700‑1710, 2014. Matrix metalloproteinases expression correlates with survival
17. Su H, Hu N, Yang HH, Wang C, Takikita M, Wang QH, Giffen C, in patients with esophageal squamous cell carcinoma. Am
Clifford R, Hewitt SM, Shou JZ, et al: Global gene expression J Gastroenterol 100: 1835‑1843, 2005.
profiling and validation in esophageal squamous cell carcinoma 40. Mroczko B, Kozłowski M, Groblewska M, Łukaszewicz M,
and its association with clinical phenotypes. Clin Cancer Res 17: Nikliński J, Jelski W, Laudański J, Chyczewski L and
2955‑2966, 2011. Szmitkowski M: The diagnostic value of the measurement of
18. Hu N, Wang C, Clifford RJ, Yang HH, Su H, Wang L, Wang Y, matrix metalloproteinase 9 (MMP‑9), squamous cell cancer
Xu Y, Tang ZZ, Ding T, et al: Integrative genomics analysis antigen (SCC) and carcinoembryonic antigen (CEA) in the
of genes with biallelic loss and its relation to the expression of sera of esophageal cancer patients. Clin Chim Acta 389: 61‑66,
mRNA and micro‑RNA in esophageal squamous cell carcinoma. 2008.
BMC Genomics 16: 732, 2015. 41. Li Y, Ma J, Guo Q, Duan F, Tang F, Zheng P, Zhao Z and Lu G:
19. Brierley JD, Gospodarowicz MK and Wittekind C (eds): TNM Overexpression of MMP‑2 and MMP‑9 in esophageal squamous
classification of malignant tumours, 8th edition. John Wiley & cell carcinoma. Dis Esophagus 22: 664‑667, 2009.
Sons, 2017. 42. Chai R, Zhang K, Wang K, Li G, Huang R, Zhao Z, Liu Y
20. Team RC: A language and environment for statistical computing and Chen J: A novel gene signature based on five glioblastoma
R Foundation for Statistical Computing, Vienna, Austria: ISBN stem‑like cell relevant genes predicts the survival of primary
3‑900051‑07‑0. Journal 2012. glioblastoma. J Cancer Res Clin Oncol 144: 439‑447, 2018.
21. Ritchie ME, Phipson B, Wu D, Hu Y, Law CW, Shi W and 43. Liu GM, Xie WX, Zhang CY and Xu JW: Identification of
Smyth G: limma powers differential expression analyses for a four‑gene metabolic signature predicting overall survival
RNA‑sequencing and microarray studies. Nucleic Acids Res 43: for hepatocellular carcinoma. J Cell Physiol 235: 1624‑1636,
e47, 2015. 2020.
22. Robinson MD, McCarthy DJ and Smyth GK: edgeR: A 44. Mariani P, Dureau S, Savignoni A, Rouic LL, Levy‑Gabriel C,
Bioconductor package for differential expression analysis of Piperno‑Neumann S, Rodrigues MJ, Desjardins L, Cassoux N
digital gene expression data. Bioinformatics 26: 139‑140, 2010. and Servois V: Development of a prognostic nomogram for liver
23. Cox DR: Regression models and life‑tables. J Royal Stat Soc metastasis of uveal melanoma patients selected by liver MRI.
Series B (Methodological) 34: 187‑202, 1972. Cancers (Basel) 11: E863, 2019.
24. Iasonos A, Schrag D, Raj GV and Panageas KS: How to build 45. Orlichenko LS and Radisky DC: Matrix metalloproteinases
and interpret a nomogram for cancer prognosis. J Clin Oncol 26: stimulate epithelial‑mesenchymal transition during tumor
1364‑1370, 2008. development. Clin Exp Metastasis 25: 593‑600, 2008.
25. Lüdemann L, Grieger W, Wurm R, Wust P and Zimmer C: 46. Moi ra ng t hem A, Bond hopad hyay B, Mu k her jee M,
Glioma assessment using quantitative blood volume maps Bandyopadhyay A, Mukherjee N, Konar K, Bhattacharya S
generated by T1‑weighted dynamic contrast‑enhanced magnetic and Basu A: Simultaneous knockdown of uPA and MMP9 can
resonance imaging: A receiver operating characteristic study. reduce breast cancer progression by increasing cell‑cell adhesion
Acta Radiol 47: 303‑310, 2006. and modulating EMT genes. Sci Rep 6: 21903, 2016.42 XU et al: UPREGULATED EXPRESSION OF THE MMP FAMILY OF GENES IS ASSOCIATED WITH POOR SURVIVAL IN ESCC
47. Pang L, Li Q, Li S, He J, Cao W, Lan J, Sun B, Zou H, Wang C, 57. Jabłońska‑Trypuć A, Matejczyk M and Rosochacki S: Matrix
Liu R, et al: Membrane type 1‑matrix metalloproteinase induces metalloproteinases (MMPs), the main extracellular matrix
epithelial‑to‑mesenchymal transition in esophageal squamous (ECM) enzymes in collagen degradation, as a target for anti-
cell carcinoma: Observations from clinical and in vitro analyses. cancer drugs. J Enzyme Inhib Med Chem 31: 177‑183, 2016.
Sci Rep 6: 22179, 2016. 58. Ricard‑Blum S: The collagen family. Cold Spring Harb Perspect
48. Osako Y, Seki N, Kita Y, Yonemori K, Koshizuka K, Kurozumi A, Biol 3: a004978, 2011.
Omoto I, Sasaki K, Uchikado Y, Kurahara H, et al: Regulation 59. Zhang H, Teng X, Liu Z, Zhang L and Liu Z: Gene expression
of MMP13 by antitumor microRNA‑375 markedly inhibits profile analyze the molecular mechanism of CXCR7 regulating
cancer cell migration and invasion in esophageal squamous cell papillary thyroid carcinoma growth and metastasis. J Exp Clin
carcinoma. Int J Oncol 49: 2255‑2264, 2016. Cancer Res 34: 16, 2015.
49. Bai X, Li YY, Zhang HY, Wang F, He HL, Yao JC, Liu L and 60. Kaminska B, Wesolowska A and Danilkiewicz M: TGF beta
Li SS: Role of matrix metalloproteinase‑9 in transforming signalling and its role in tumour pathogenesis. Acta Biochim
growth factor‑β1‑induced epithelial‑mesenchymal transition in Pol 52: 329‑337, 2005.
esophageal squamous cell carcinoma. Onco Targets Ther 10: 61. Wang X, Fu X, Brown P, Crimmin M and Hoffman R: Matrix
2837‑2847, 2017. metalloproteinase inhibitor BB‑94 (batimastat) inhibits human
50. Rajasinghe LD, Pindiprolu RH and Gupta SV: Delta‑tocotrienol colon tumor growth and spread in a patient‑like orthotopic model
in nude mice. Cancer Res 54: 4726‑4728, 1994.
inhibits non‑small‑cell lung cancer cell invasion via the inhi- 62. Erba E, Ronzoni S, Bassano L, Giavazzi R and D'lncalci M:
bition of NF‑κB, uPA activator, and MMP‑9. Onco Targets The metalloproteinase inhibitor batimastat (BB‑94) causes cell
Ther 11: 4301‑4314, 2018. cycle phase perturbations in ovarian cancer cells. Ann Oncol 10:
51. Ganguly SS, Hostetter G, Tang L, Frank SB, Saboda K, Mehra R, 589‑591, 1999.
Wang L, Li X, Keller ET and Miranti CK: Notch3 promotes 63. Kirkegaard T, Yde CW, Kveiborg M and Lykkesfeldt AE: The
prostate cancer‑induced bone lesion development via MMP‑3. broad‑spectrum metalloproteinase inhibitor BB‑94 inhibits
Oncogene 39: 204‑218, 2020. growth, HER3 and Erk activation in fulvestrant‑resistant breast
52. Takebe N, Nguyen D and Yang SX: Targeting notch signaling cancer cell lines. Int J Oncol 45: 393‑400, 2014.
pathway in cancer: Clinical development advances and chal- 64. Peng L, Bian XW, Xu C, Wang GM, Xia QY and Xiong Q:
lenges. Pharmacol Ther 141: 140‑149, 2014. Large‑scale RNA‑Seq transcriptome analysis of 4043 cancers
53. Ma J, Tang X, Wong P, Jacobs B, Borden EC and Bedogni B: and 548 normal tissue controls across 12 TCGA cancer types.
Noncanonical activation of Notch1 protein by membrane type 1 Sci Rep 5: 13413, 2015.
matrix metalloproteinase (MT1‑MMP) controls melanoma cell 65. Ricci S, Grandgirard D, Wenzel M, Braccini T, Salvatore P,
proliferation. J Biol Chem 289: 8442‑8449, 2014. Oggioni MR, Leib SL and Koedel U: Inhibition of matrix
54. Chen JS, Wang Q, Fu Xh, Huang XH, Chen XL, Cao LQ, metalloproteinases attenuates brain damage in experimental
Chen LZ, Tan HX, Li W, Bi J and Zhang LJ: Involvement of meningococcal meningitis. BMC Infect Dis 14: 726, 2014.
PI3K/PTEN/AKT/mTOR pathway in invasion and metastasis
in hepatocellular carcinoma: Association with MMP‑9. Hepatol
Res 39: 177‑186, 2009.
55. Powell E, Piwnica‑Worms D and Piwnica‑Worms H: Contribution This work is licensed under a Creative Commons
of p53 to metastasis. Cancer Discov 4: 405‑414, 2014. Attribution-NonCommercial-NoDerivatives 4.0
56. Mellor P, Deibert L, Calvert B, Bonham K, Carlsen SA and International (CC BY-NC-ND 4.0) License.
Anderson DH: CREB3L1 is a metastasis suppressor that
represses expression of genes regulating metastasis, invasion,
and angiogenesis. Mol Cell Biol 33: 4985‑4995, 2013.You can also read