Mutation Analysis of Colorectal and Gastric Carcinomas Originating from Adenomas: Insights into Genomic Evolution Associated with Malignant ...
←
→
Page content transcription
If your browser does not render page correctly, please read the page content below
Article

Mutation Analysis of Colorectal and Gastric
Carcinomas Originating from Adenomas: Insights
into Genomic Evolution Associated with Malignant
Progression
Sung Hak Lee 1, Jinseon Yoo 2,3, Young Soo Song 4, Chul-Hyun Lim 5,* and Tae-Min Kim 2,3,*
 1 Department of Hospital Pathology, Seoul St. Mary’s Hospital, College of Medicine, The Catholic University
   of Korea, 222 Banpodae-ro, Seocho-gu, Seoul 06591, Korea; hakjjang@catholic.ac.kr
 2 Department of Medical Informatics, The Catholic University of Korea, 222 Banpodae-ro, Seocho-gu,

   Seoul 06591, Korea; dbwlstjs0@gmail.com
 3 Cancer Research Institute, College of Medicine, The Catholic University of Korea, 222 Banpodae-ro,

   Seocho-gu, Seoul 06591, Korea
 4 Department of Pathology, College of Medicine, Konyang University, 158 Gwanjeodong-ro, Seo-gu,

   Daejeon 35365, Korea; lifen@hanyang.ac.kr
 5 Division of Gastroenterology, Department of Internal Medicine, Eunpyeong St. Mary’s Hospital, College of

   Medicine, The Catholic University of Korea, 1021, Tongil-ro, Eunpyeong-gu, Seoul 03312, Korea
 * Correspondence: diluck@catholic.ac.kr (C.-H.-L.); tmkim@catholic.ac.kr (T.-M.K.);
   Tel.: +82-2-2030-4316 (C.-H.-L.); +82-2-2258-7483 (T.-M.K.)

 Received: 23 December 2019; Accepted: 27 January 2020; Published: 31 January 2020

 Abstract: Small malignant tumor foci arising from benign lesions are rare but offer a unique
 opportunity to investigate the genomic evolution that occurs during malignant transformation. In
 this study, we analyzed 11 colorectal and 10 gastric adenoma–carcinoma pairs, each of which
 represented malignant tumors (carcinomas) embedded in benign lesions (adenomas) found in the
 same patient. Whole-exome sequencing revealed that mutation abundance was variable across
 different cases, but comparable between adenoma–carcinoma pairs. When mutations were
 classified as adenoma-specific, carcinoma-specific, or common, adenoma-specific mutations were
 more enriched with subclonal mutations than were carcinoma-specific mutations, indicative of a
 perturbation in mutational subclonal architecture (such as selective sweep) during malignant
 transformation. Among the recurrent mutations in colorectal cancers, APC and KRAS mutations
 were common between adenomas and carcinomas, indicative of their early occurrence during
 genomic evolution. TP53 mutations were often observed as adenoma-specific and therefore likely
 not associated with the emergence of malignant clones. Clonality-based enrichment analysis
 revealed that subclonal mutations of extracellular matrix genes in adenomas are more likely to be
 clonal in carcinomas, indicating potential roles for these genes in malignant transformation.
 Compared with colorectal cancers, gastric cancers showed more lesion-specific mutations than
 common mutations and higher levels of discordance in copy number profiles between matched
 adenomas and carcinomas, which may explain the elevated evolutionary dynamics and
 heterogeneity of gastric cancers compared to colorectal cancers. Taken together, this study
 demonstrates that co-existing benign and malignant lesions enable the evolution-based
 categorization of genomic alterations that may reveal clinically important biomarkers in colorectal
 and gastric cancers.

 Keywords: colorectal cancers; gastric cancers; somatic mutations; malignant progression; exome
 sequencing

Cancers 2020, 12, 325; doi:10.3390/cancers12020325                             www.mdpi.com/journal/cancers
Cancers 2020, 12, 325                                                                             2 of 16

1. Introduction
      Colorectal and gastric cancers are common gastrointestinal tumors worldwide representing
major causes of cancer-related morbidity and mortality [1,2]. Endoscope-based screening has been
useful in reducing the overall disease risk through detecting early stage diseases. However, at an
advanced stage these cancers are largely incurable, with limited therapeutic options available. Large-
scale cancer genome sequencing projects such as the Cancer Genome Atlas consortium have
generated mutation profiles for thousands of colorectal and gastric cancers, leading to previously
unrecognized driver mutations, perturbed regulatory programs, and distinct molecular taxa of the
disease [3,4]. However, the investigation of genomic snapshots from fully transformed tumors across
unrelated patients may be limited in gaining evolutionary insights. The acquisition of multiple
biopsies for longitudinal cancer genome analysis is also largely limited for solid tumors.
      During the multistep evolution of colorectal cancers, normal epithelial cells go through a series
of well-defined histological stages, from dysplasia to adenoma and eventually through to carcinoma
with metastases [5,6]. This stepwise evolution of cancer has been a widely accepted model for
colorectal cancers and gastric cancers [7]. This model postulates that the growth of malignant tumors
is followed by a selective sweep of the preceding lesions (such as adenomas) and thus, either benign
adenomas or malignant carcinomas are observed at the time of biopsy or surgical resection. However,
small malignant tumor foci are sometimes observed within residual adenomas [8]. Such histological
representations—malignant tumor foci embedded in adenomatous lesions—represent two
evolutionarily distinct states with a shared ancestry, offering an opportunity to investigate the genetic
evolution underlying malignant transformation.
      It is widely accepted that the histological progression of tumors occurs in parallel with the
accumulation of genomic aberrations, some of which play roles in malignant progression. Recent
cancer genome analyses have compared multiple specimens from a single individual to gain insights
into the evolutionary history of cancer genomes [9]. For example, primary tumor genomes have been
compared with matched, metastatic tumor genomes using genomic variants as evolutionary markers
[10]. The acquisition of premalignant or benign tumor genomes along with their matched malignant
tumor genomes is largely limited. The analysis of multiple, synchronous colorectal crypts has been
proposed [11], but it is not clear whether the synchronous lesions, often physically separated in the
organs, originate from the same ancestor or represent independent tumor foci.
      In this study, we performed whole-exome sequencing of 11 colorectal and 10 gastric pairs of
adenoma–carcinoma, all of which were obtained from histologically-confirmed invasive carcinomas
arising from benign adenomatous lesions.

2. Results

2.1. Whole-Exome Sequencing and Somatic Variants
      We performed whole-exome sequencing of paired benign and malignant lesions, consistent with
carcinomas arising from adenomas, for 11 colorectal and 10 gastric cancers. The clinicopathological
information of 21 patients is shown in Table S1.
      Somatic mutations were identified by comparing the tumor-derived whole-exome sequencing
data (adenoma or carcinoma) with those of matched normal data to subtract germline variants. We
first investigated the abundance of somatic mutations (i.e., the number of exonic single nucleotide
variants—SNVs—and insertions/deletions—indels) (Figure 1).
      Somatic mutations identified in these 21 cases are detailed in Table S2. In 11 colorectal cancers
(C1–C11), 90–237 and 75–163 mutations were observed for adenomas and carcinomas, respectively,
except for a hypermutated case with 2434 and 2495 mutations in the adenoma and carcinoma (C4;
Figure 1A). In 10 gastric cancers (S1–S10), 53–204 and 85–160 mutations were observed for adenomas
and carcinomas, respectively, while two hypermutated cases had 924/982 (adenoma/carcinoma; S4)
and 1148/1221 mutations (S10). Both tumor types did not show statistically significant differences in
the mutation abundance between matched adenomas and carcinomas (p = 0.336 and p = 0.684 for
colorectal and gastric cancers, respectively; paired t-test).
Cancers 2020, 12, 325                                                                                  3 of 16

      We also examined the ratio of lesion-specific mutations (i.e., adenoma- or carcinoma-specific) to
lesion-common mutations (i.e., those observed both in adenomas and carcinomas) (Figure 1B). This
ratio was not significantly different between paired adenomas and carcinomas (adenoma vs.
carcinoma; p = 0.180 and 0.09 for colorectal and gastric, respectively; paired t-test). However, we
observed a significantly higher ratio in gastric cancers compared to colorectal cancers, representing
a dominance of lesion-specific mutations over lesion-common mutations (colorectal vs. gastric, p =
0.015; Welch's t-test). In addition, we observed that the majority of mutations in the three
hypermutated cases are lesion-common mutations, as indicated by negative log ratios (C4, S4, and
S10; asterisks in Figure 1B). This suggests that mutation bursts in these cases are likely to have
occurred before the divergence of malignant cells from the benign lesions. Next, we examined the
cancer cell fraction (CCF) of mutations as a measure of clonality [12] (Figure 1C). Lesion-common
mutations show a higher CCF compared to lesion-specific mutations, indicative of their enrichment
for clonal mutations over subclonal mutations (p < 2.2 × 10⁻¹⁶ both for colorectal and gastric cancers;
t-test). We also note that the CCF of adenoma-specific mutations is significantly lower than that of
carcinoma-specific mutations (p = 0.044 and p = 0.016 in colorectal and gastric cancers, respectively).
The higher CCF of carcinomas may be a consequence of clonal selection, e.g., selective sweeps or
other evolutionary forces that are operative during malignant transformation. In addition, we
examined the proportion of somatic mutations leading to amino acid changes, as well as the six
mutation spectra (Figure S2). The proportions of different mutation categories in lesion-common
mutations were compared to those of adenoma- and carcinoma-specific mutations, but no statistically
significant difference was observed. This suggests that the mutation forces associated with an impact
on encoded proteins and sequence contexts are largely similar throughout the adenoma–carcinoma
transition in colorectal and gastric cancers.

      Figure 1. Exonic mutations of colorectal and gastric pairs of adenoma and carcinoma. (A) Mutational
      abundance (i.e., the number of exonic mutations) is shown for 21 pairs of adenoma and carcinoma (11
      colorectal and 10 gastric; left and right, respectively). Lesion-common (gray) mutations are
      distinguished from adenoma-specific and carcinoma-specific mutations (green and red, respectively).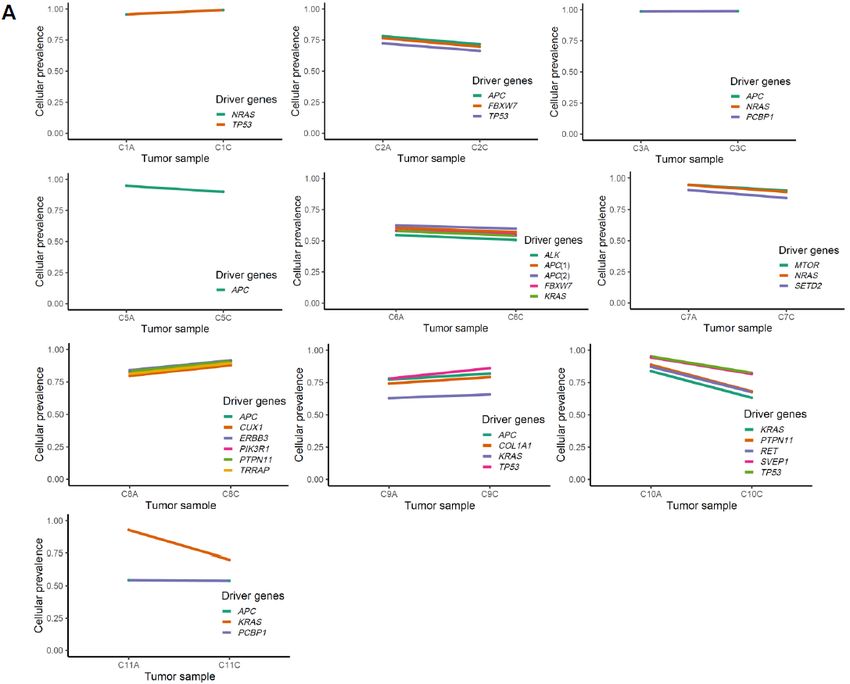
Cancers 2020, 12, 325                                                                                   4 of 16

      (B) For each lesion (gray and black for adenomas and carcinomas, respectively), the ratio of lesion-
      specific and lesion-common mutations are shown (log-scaled; y-axis). Dominance of lesion-specific
      mutations over lesion-common mutations is shown as positive log-ratios. Asterisks indicate the three
      hypermutated cases. (C) cancer cell fractions (CCFs) are shown as mutation allele frequencies
      adjusted for estimated tumor purity and ploidy levels. Ad-Co and Ca-Co mutations are lesion-
      common mutations of adenomas and carcinomas, respectively. Ad-Sp and Ca-Sp mutations are for
      those of adenoma- and carcinoma-specific mutations.

2.2. Genes Enriched to Regional Mutation Classes
      We identified recurrent mutations using MutSigCV [13] with respect to the regional mutation
classes (i.e., common and adenoma-/carcinoma-specific mutations). Genes substantially enriched for
mutations in three mutation categories are shown (MutSigCV p < 0.01; Figure 2A). In colorectal
cancers, eight genes enriched with lesion-common mutations include known cancer-related genes
involved in the colorectal adenoma–carcinoma sequence, such as APC, KRAS, and TP53. For example,
APC mutations occur early in the dysplastic epithelium and are followed by mutations in KRAS and
TP53 during the dysplasia–adenoma and adenoma–carcinoma sequences, respectively [5,6]. We note
that TP53 mutations were also observed as adenoma-specific mutations (six common TP53 mutations
along with two adenoma-specific TP53 mutations). Two adenoma-specific TP53 mutations (one
frameshifting indel/p.Pro169fs mutation and one missense/p.Leu125Pro mutation in C2 and C4,
respectively) occurred in the adenomatous lesions after the emergence of malignant clones. This
observation is consistent with the previously assumed temporal sequence of mutations, in which
TP53 mutations arise between the late adenoma and carcinoma stages [5,6]. However, it also implies
that these TP53 mutations may not necessarily be associated with the emergence of malignant clones.
      Recent investigation on colon adenoma–carcinoma samples has shown that APC, TTN, TP53,
KRAS, OBSCN, SOX9, PCDH17, SIGLEC10, MYH6, and BRD9 may represent early drivers in
colorectal carcinogenesis. Furthermore, AMER1 and PRICKLE2 mutations were classified as early
driver genes along with APC and SOX9 associated with dysregulation of Wnt signaling [14].
Compared with lesion-common mutations in this study, however, no overlaps of mutations were
observed beyond the APC, KRAS, and TP53 mutations.
      Among the common mutations in colorectal cancers, NRAS mutations were frequent
(p.Glu61Lys, p.Glu61Arg, and p.Glu61Leu missense/common mutations in C1, C3, and C7,
respectively), although this event has been previously reported to be relatively rare (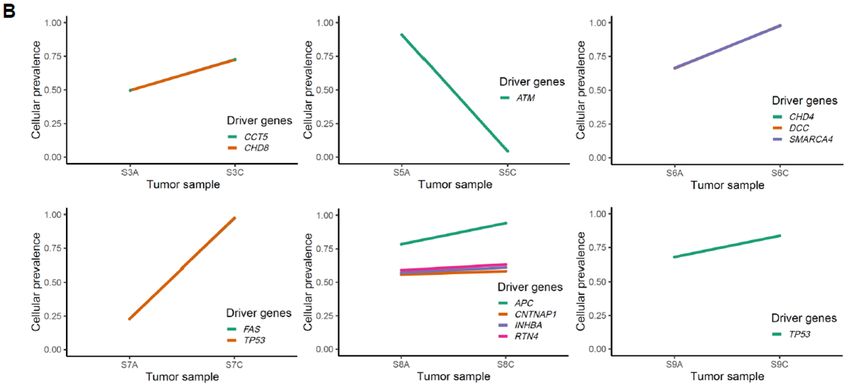
Cancers 2020, 12, 325 5 of 16
difference of mutation profiles may be partly because of the histologic difference between studies
(e.g., synchronous or co-existence of benign and malignant lesions). Lesion-specific mutations in
JMJD6, CNTNAP5 (adenoma-enriched), and GSG1L (carcinoma-enriched) were also identified.
We performed CCF or clonality-based gene set enrichment analysis for lesion-common
mutations. CCF is a measure of the fraction of cells harboring a mutation and has been used to classify
mutations as clonal or subclonal [12]. The changes in CCF between adenomas and carcinomas may
indicate the potential functionality of the mutations. For example, the mutations that can drive
malignant transformation arising in the adenoma may be present as subclonal and clonal mutations
in paired adenomas and carcinomas, respectively. Thus, we calculated the difference in the CCF
between paired lesions (CCFcarcinoma − CCFadenoma) for common mutations and performed a preranked
version of GSEA (Figure 2B). As a result, we observed that mutations in genes involved in the
extracellular matrix (ECM) had an elevated CCF in carcinomas compared to matched adenomas (Ca-
Clonal; CCFcarcinoma > CCFadenoma). Of note, ECM-related functions were also observed in Ca-Clonal
mutations in gastric cancers. Ad-Clonal genes (CCFcarcinoma < CCFadenoma) in colorectal cancers largely
represented signaling pathways, including the phosphatidylinositol, Wnt, and VEGF pathways. This
clonal change of mutations may indicate that the malignant transformation represents a transit from
aberrant signaling pathway-driven cellular proliferation to elevated invasive potential with aberrant
ECM molecules. Clonality-based GSEA results are listed in the Table S3. We further performed GSEA
of two cancer types combined with three hypermutated cases ignored (C4, S4, and S10), the most
enriched functional category in clonal mutations was ”focal adhesion”, which is consistent with
ECM-related functions (Table S3).
Figure 2. Recurrent mutations in region-specific classes. (A) Genes substantially enriched with three
regional mutation categories (p < 0.01; MutSigCV) are shown for colorectal and gastric cancers.
Common (lesion-common) mutations are shown with Ad-Sp and Ca-Sp (adenoma- and carcinoma-
specific, respectively). (B) Gene sets are shown for those enriched with Ca-Clonal and Ad-Clonal
mutations (those CCFcarcinoma > CCFadenoma and CCFcarcinoma < CCFadenoma, respectively).
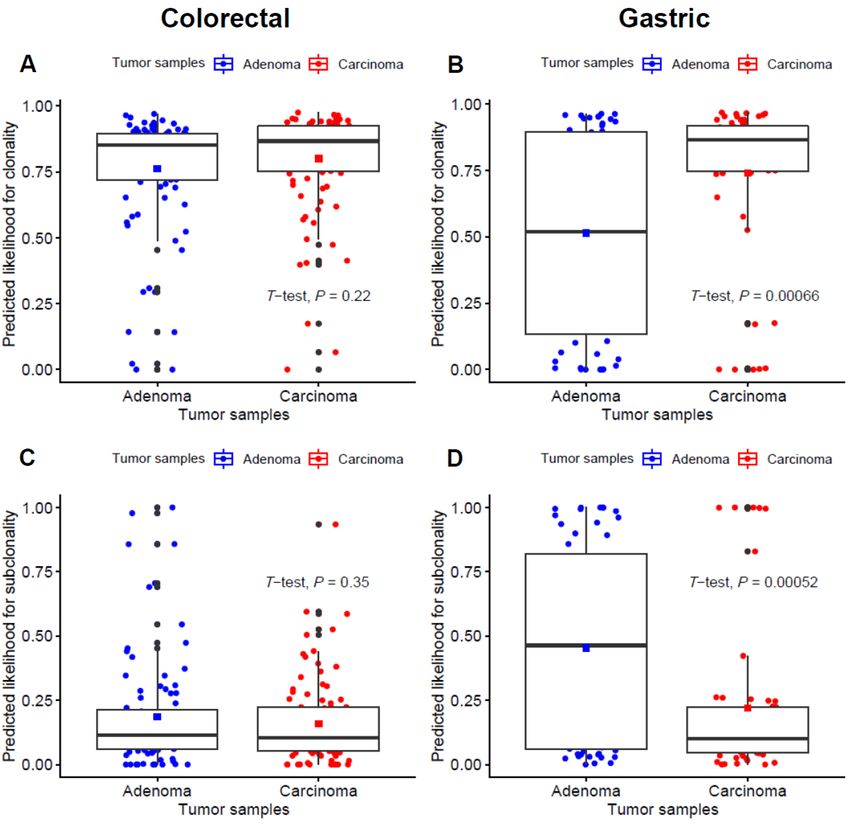
In addition, we conducted clonality analysis focused on driver mutations listed in the IntOGen
database between adenoma–carcinoma samples (Figure 3). For tier 1 and 2 mutations representing
functional cancer drivers, the predicted likelihood for clonality was significantly higher in gastric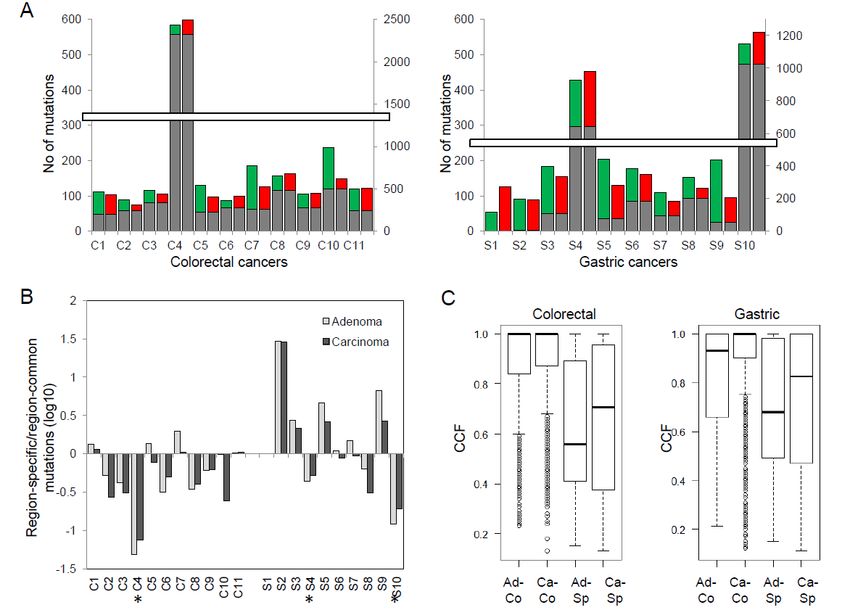
Cancers 2020, 12, 325                                                                                   6 of 16

carcinoma samples (p < 0.001; Figure 3B), while the estimated subclonality was significantly higher
in gastric adenoma samples (p < 0.001; Figure 3D). In line with this, there also seems to be a trend for
higher clonality and subclonality in colorectal adenoma and carcinoma samples, respectively,
although it did not reach statistical significance (p = 0.22 and 0.35 for the prediction for clonality and
subclonality, respectively; Figure 3A,C).

      Figure 3. Comparison of clonality for tier 1 and 2 driver gene mutations between adenoma and
      carcinoma pairs. (A and B) the predicted likelihood for clonality in colorectal and gastric samples,
      respectively. (C and D) the predicted likelihood for subclonality in colorectal and gastric samples,
      respectively.

     For gastric samples, we found that the mutations in cancer driver genes are likely to be subclonal
in adenomas but are clonal in carcinomas, suggestive of the functional roles of cancer driver
mutations in gastric carcinogenesis. Meanwhile, the probability of mutations being clonal was not
significantly different for colorectal adenoma–carcinoma pairs. The relative homogeneity of clonality
across driver mutations in colorectal cancers suggests that driver mutations acquire clonality early,
before the divergence of adenoma and carcinomas for these types of cancers.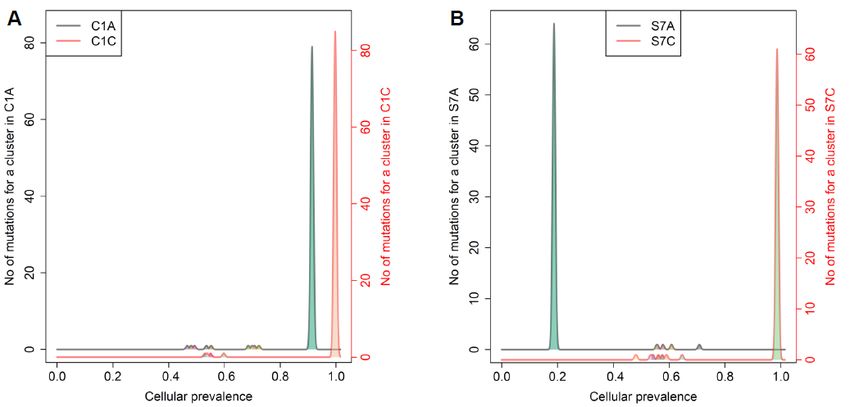
Cancers 2020, 12, 325                                                                             7 of 16

2.3. Mutation Clusters Between Adenoma–Carcinoma Pairs
     The change of clonality of driver genes during adenoma–carcinoma sequence was further
investigated using PyClone. For the clusters containing lesion-common driver mutations obtained
from PyClone analysis using the “two-sample” option, we compared the patterns of change in
cellular prevalence, for example differential CCF levels between adenoma and matched carcinoma
pairs (Figure 4A,B).

      Figure 4. Cellular prevalence of mutation clusters using PyClone between adenoma and carcinoma
      pairs. (A) and (B) show the inferred cellular frequency of mutation clusters containing driver
Cancers 2020, 12, 325 8 of 16
mutations in colorectal and gastric samples, respectively. The annotated genes (right) indicate the
lesion-common mutated driver genes.
The value of CCF in ABSOLUTE and cellular prevalence in PyClone seems generally concordant
because roughly PyClone can be considered to include an extra step of Bayesian non-parametric
clustering to the ABSOLUTE-like procedure to reduce noises in predicting proportions of cells having
the mutation.
In four colorectal cases (C1, C3, C8, and C9), we observed a minimal increase in the cellular
prevalence of mutations during the adenoma–carcinoma sequence, and six colorectal cases (C2, C5,
C6, C7, C10, and C11) showed a minimal reduction in the cellular prevalence of mutations during
this same sequence, indicative of random fluctuations rather than changes having directions. On the
other hand, for gastric cancers, all cases except one (S5) revealed clear increase in the cellular
prevalence of mutations in carcinoma samples (p = 0.09). This finding is consistent with our results
from clonality analysis, suggesting that not all driver mutations are associated with the emergence of
malignant clones, especially in colorectal carcinogenesis.
In evolutionary biology, fitness landscapes (evolutionary landscapes)—a concept introduced in
1932—have been used to describe the relationship between genotypes and reproductive successes
[20] where peaks represent adaptive genotypes and valleys for less fit genotypes.
Recently, Cross et al. revealed that colorectal adenomas may grow across an undulating
evolutionary fitness landscape, whereas carcinomas show a sharp fitness peak that may reflect
stabilizing selection [21]. In their study, the shape of the fitness peaks was assessed by SNV-based
intra-tumoral heterogeneity quantification and phylogenetic analyses. Considerable variations in
branch length suggest that mutations may be accumulated faster in some tumor regions, which can
be incurred by selection on a new fitness peak, suggesting that adenomas are more heterogeneous
than carcinomas, i.e., a broader fitness peak in colorectal adenomas.
In this study, we have attempted to roughly outline the evolutionary fitness landscape of
adenomas and carcinomas from Pyclone-based inference of clonal population structures. We
compared each pair of adenomas–carcinomas in view of clonal clusters and cellular prevalence. The
tumor with fewer clonal clusters and higher cellular prevalence compared to its pair can be
considered as sharper fitness peaks, suggesting a tendency for evolutionary convergence. On the
contrary, a rough fitness landscape consisting of a larger number of clonal clusters can result in
multiple peaks, which tends to be evolutionary divergence. In this context, with clustering based on
the estimated cellular prevalence and the number of mutations by PyClone analysis for each sample
(i.e., “one-sample-only” option), we inferred the differences in the fitness landscapes within
adenoma–carcinoma pairs (Figures 5A,B and S3).
Figure 5. Inference of evolutionary fitness landscape using cellular prevalence of mutation clusters
from PyClone analysis in representative colorectal and gastric tumors. The representative colorectalCancers 2020, 12, 325 9 of 16
(C1) (A) and gastric (S7) (B) cases show higher peaks by numbers of mutations for a cluster (y-axis)
and higher cellular prevalence with a smaller number of mutational clusters (x-axis) in carcinomas,
suggesting stabilizing mutational selection during cancer evolution.
The analyses revealed that the majority of the cases (e.g., 7/11 colorectal cases; C1, C2, C3, C4,
C7, C8, and C11 and 6/10 gastric cases; S3, S4, S6, S7, S8, and S9) showed sharper fitness peaks in
carcinomas than in adenomas.
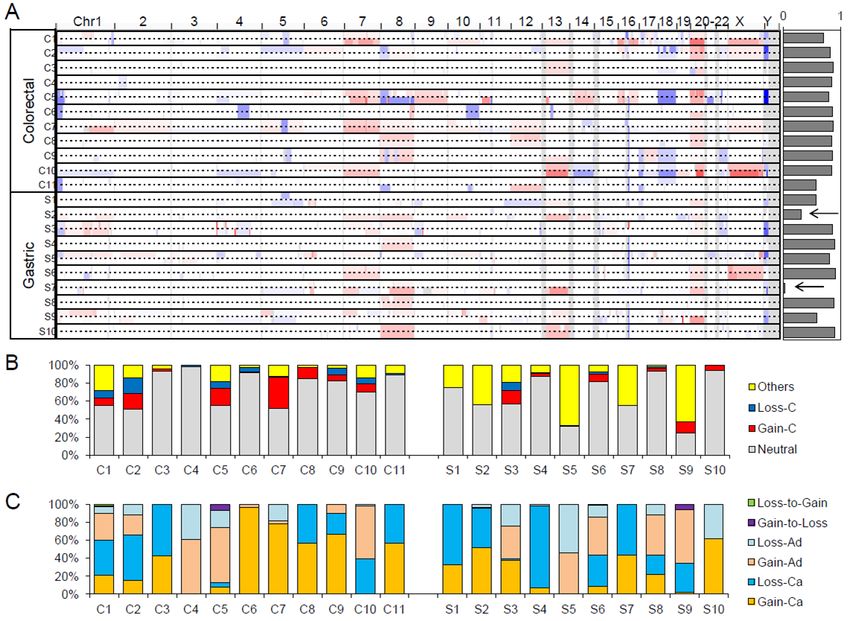
2.4. Copy Number Profiles
The genome-wide somatic copy number alterations (SCNAs) profiles of 21 adenoma–carcinoma
pairs are illustrated in Figure 6A. In the majority of cases, the SCNA profiles of adenomas and
matched carcinoma genomes are largely concordant, as indicated by the high level of correlation
between segment values of adenoma vs. carcinoma across the cases (Figure 6A; right). We noted two
gastric cancers with relatively discordant SCNA profiles where the correlation of copy number
segments between adenoma and carcinoma was less than 0.5 (arrows in Figure 6A). The discordance
of these cases is largely due to the presence of carcinoma-specific SCNAs, and for these gastric
cancers, a substantial number of SCNAs arise after the divergence of malignant tumor foci from the
adenomatous lesion.
Figure 6. Somatic copy number alteration (SCNA) profiles of benign and malignant pairs. (A)
Snapshot of Integrative Genomics Viewer (IGV) browser is shown as a genome-wide SCNA profile
of 21 genomes examinations. The pairs of adenoma–carcinoma genomes are shown as pairs of
individual lanes. The concordance level as the correlation between the segment level copy number
ratios between the matched adenoma and carcinoma genomes are shown on the right. Arrows are for
two cases with relatively discordant (correlationCancers 2020, 12, 325 10 of 16
The observed copy numbers of primary tumor specimens are highly dependent on tumor purity
and ploidy level, so the simple correlation of segment values is often misleading. To cope with this
technical issue, we further identified absolute copy numbers (n) for individual copy number
segments (i.e., copy number gains and losses for n > 2 and n < 2, respectively; n = 2 for neutral copy
numbers). Genes were then intersected onto the copy number segments and further classified in the
corresponding adenoma and carcinoma genomes. The relative proportion of genes in each case is
shown in Figure 6B. The proportion of genes under segments with no copy number changes (Neutral;
gray) as well as those in copy number gains and losses common in adenomas and carcinomas (Gain-
C and Loss-C as clonal gains and losses; red and blue in Figure 6B, respectively) are shown with those
under copy number changes between adenomas and carcinomas (Others). The relative proportions
are variable across the cases, but we note that the proportion representing copy number changes
between adenomas and carcinomas is higher in gastric cancers compared to colorectal cancers (p =
0.0275, t-test), suggesting that gastric cancer genomes acquire more SCNAs during the adenoma–
carcinoma sequence. Figure 6C further demonstrates the six categories of copy number changes
during the adenoma–carcinoma sequence, the extent of which is variable across cases.
2.5. Microsatellite Instability and Hypermutation
As a potential cause of hypermutated genomes, we examined microsatellite instability (MSI)
using whole-exome sequencing data as previously described [22]. Two cases (C4 and S10) showed a
substantial number of exonic MSI events, with significant (FDR < 0.05) DNA slippage events at exonic
microsatellite repeats (26/75 and 423/506 exonic MSI events in adenoma/carcinoma, respectively). In
contrast, the remaining cases showed fewer than five MSI events. These two cases were classified as
MSI-H genomes. Deficiency in DNA mismatch repair leading to MSI-H explains two of the three
hypermutated cases (C4, S4, and S10). Both genomes show characteristic length polymorphisms on
frequent MSI targets such as ACVR2A (C4) and TGFBR2 (S10) (Figure S4). The hypermutated case
with no evidence of MSI-H (S4) may have other factors accounting for its elevated mutation burden.
Since these genomes do not have mutations in genes known to cause hypermutation such as POLD1
or POLE, further investigation is required to determine the potential cause of hypermutation.
3. Discussion
Serial biopsies of benign and malignant lesions from the same individuals were previously
feasible only for rare clinical entities such as Barrett's esophagus [23]. The current evolutionary
studies therefore select a large number of adenomas and carcinomas from unrelated patients [16,21].
This cohort-level comparison may have limitations due to inter-patient heterogeneity.
Histological presentation of carcinomas arising from adenomas represents a unique clinical
setting where benign and malignant lesions co-exist in the same individuals. Unlike synchronous
presentation of multiple lesions of unclear origin, small malignant tumor foci are likely to have shared
ancestry, having likely arisen in their embedded adenomatous lesions. Their apparent evolutionary
relationship—ancestor adenomas and descendant carcinomas—provides an unprecedented
opportunity for comparative analysis of benign and malignant genomes in the same individuals,
enabling the following of adenoma–carcinoma sequences. Since DNA level alterations, including
somatic mutations, may serve as evolutionary markers [24], we investigated the genetic concordance
of adenoma–carcinoma pairs, as well as the mutation features and mutated genes associated with
adenoma–carcinoma transition of colorectal and gastric cancers.
In this study, we observed a substantial level of mutation overlap between matched adenomas
and carcinomas, i.e., 33.3%–95.4%/46.6%–93.0% of mutations in colorectal adenomas/carcinomas and
3.2%–89.3%/3.4%–83.9% of mutations in stomach adenomas/carcinomas were lesion-common
mutations. This substantial overlap suggests that the examined adenomas and carcinomas share
common evolutionary origins instead of representing synchronous lesions. However, it will require
further investigation whether two lesions represent the results of stepwise evolution (i.e., the benign-
to-malignant progression that does not accompany clonal sweep of adenomatous lesions) or parallelCancers 2020, 12, 325 11 of 16
evolution where adenomatous lesions are heterogeneous in nature and only some benign clones
possess the potential for malignant progression.
We also observed that the mutation abundance was not statistically different between matching
benign and malignant lesions, leading to the conclusion that mutation abundance was largely
comparable between the two lesions. Although the level of mutation abundance was relatively
constant between adenoma–carcinoma pairs, analysis across the mutation categories with respect to
mutation clonality measured by CCF revealed that the CCF was lower for adenoma-specific
mutations compared to carcinoma-specific mutations. Given that the CCF measure reflects the level
of heterogeneity in the subclonal mutation architecture, statistical differences in CCF values between
adenoma–carcinoma pairs suggests that coexisting adenomas and carcinomas have been subject to
different levels of evolutionary perturbation. There is evidence both against [25] and in favor of clonal
sweep during cancer evolution [26]. Our results support the presence of clonal evolution during
malignant transformation in the form of competition between major and minor subclones, instead of
complete dominance by a single clone (selective sweep). In addition, clonality among tier 1 and 2
mutations was predicted to be higher in carcinomas than adenoma samples, suggesting that the
known driver mutations have been subject to clonal selection, especially in gastric cancer evolution.
We observed a number of features indicating more accelerated evolutionary dynamics in gastric
cancers than colorectal cancers. For example, the dominance of lesion-specific mutations over lesion-
common mutations was more frequently observed in gastric cancers. It has been assumed previously
that the ratio of relative abundance of lesion-specific and lesion-common mutations may reflect the
extent of complexity in subclonal mutation architecture of cancer genomes with potential clinical
implications [27]. The dominance of subclonal SCNA events was also noted to be frequent for gastric
cancers, suggesting that gastric cancers may be more permissive to newly arising genomic
aberrations, including somatic mutations and SCNAs, leading to the inter- and intra-tumoral
heterogeneity of the disease [28].
Even for lesion-common mutations, the comparison of the CCF or clonality of mutations
between adenoma and carcinoma may further identify mutations associated with malignant
transformation. For example, mutations responsible for the malignant progression of benign
adenomas would be expected to be present in a subclonal fraction of the precedent benign adenomas
but become enriched in the progressed malignant carcinomas [11,26]. These subclonal-to-clonal
mutations in adenoma–carcinoma pairs can be identified by comparison of their CCF values, and we
identified a number of recurring molecular schemes (e.g., ECM) enriched with subclonal-to-clonal
mutations across both tumor types. Along with the mutations enriched in regional mutation classes,
these function-related mutations require further investigation for their roles in malignant
transformation.
According to a study by Cross et al., the evolutionary trail across colorectal tumor cell
populations appears to be a relatively flat fitness landscape for adenomas, in contrast to higher and
sharper peaks for carcinomas [21]. In the present study, we have attempted to infer the evolutionary
fitness landscape by comparing clusters and cellular prevalence between adenoma and matched
carcinoma samples. We revealed that the majority of cases (seven colorectal and six gastric pairs)
showed sharper peaks in carcinomas, representative of higher numbers of mutations per cluster and
higher cellular prevalence with less mutational clusters. These findings are largely consistent with
those of a previous study by Cross et al.
In the three hypermutated genomes identified in our study, the majority of mutations occurred
as lesion-common mutations, suggesting the mutation burst leading to the mutator phenotype and
their causal genomic events may occur early on in colorectal and gastric cancers. Two of the three
hypermutated cases can be attributed to a deficiency in DNA mismatch repair, causing an elevated
number of MSI events. Early studies have proposed that mutations of DNA mismatch repair genes
may be early events, consistent with our observations [29,30]. One hypermutated case that could not
be classed as a MSI-H genotype still showed an early mutation burst, but the cause of hypermutation
was elusive. Given recent attention to hypermutation as a predictive marker for immune checkpointCancers 2020, 12, 325 12 of 16
blockade treatment [31], the potential cause and evolution of hypermutated genomes such as those
described in our study requires further investigation.
4. Materials and Methods
4.1. Patient and Tumor Specimens
A total of 21 patients with early gastrointestinal cancer (11 colorectal and 10 gastric
adenocarcinomas) and coexisting adenoma who had previously undergone endoscopic submucosal
dissection in Seoul St. Mary’s hospital between 2013 and 2017 were enrolled. All cases were sporadic,
without any familial history of colorectal or gastric cancer. Clinicopathological parameters, including
age, sex, histologic type, tumor location, tumor size, and lymphovascular invasion status were
reviewed retrospectively from the medical records and pathology reports. The patient information is
summarized in Table S1. The study was approved by the Institutional Review Board of the Catholic
University of Korea, College of Medicine (KC14TISI0436 and KC16SISI0960). All patients provided
written informed consent before study enrollment. This study was conducted in accordance with the
Declaration of Helsinki.
The formalin-fixed, paraffin-embedded tissues were cut and examined under a microscope by a
pathologist specialized in gastroenterology. Figure S1 shows the representative hematoxylin–eosin
(H&E) stained tissue sections from colorectal and gastric adenoma and carcinoma. Adenoma and
carcinoma cells were selectively procured from H&E stained sections using a 30G1/2 hypodermic
needle by microdissection. Purity of the tumor cells from the microdissection was approximately
70%. For control DNA, we used blood samples from each patient. For genomic DNA extraction, we
used the DNeasy Blood and Tissue Kit (Qiagen, Hilden, Germany), following the manufacturer's
recommendation.
4.2. DNA Sequencing
Exonic DNA capture was done with the Agilent SureSelect Human 50 Mb kit (Agilent
Technology), using genomic DNA from tumor pairs (adenoma–carcinoma) and matched controls
(blood). Sequencing libraries were generated as per the manufacturer's protocol, and sequencing was
performed on an Illumina HiSeq2000 platform. For all libraries, 100 bp paired-end sequencing was
performed, with an average target coverage of 99.07%. Table S4 summarizes the sequencing
information.
4.3. Somatic Mutations
Sequencing reads were initially mapped on the reference sequence of UCSC hg19 human
genomes using BWA (Burrows–Wheeler aligner) [32]. We used SAMtools [33] and Picard
(http://broadinstitute.github.io/picard) to manage the sequencing data. The local realignment and
score recalibration of sequencing reads was further performed using Genome Analysis ToolKit
(GATK) [34]. Somatic single nucleotide substitutions (SNVs) and short insertions/deletions (indels)
were identified from tumor and matched normal genome sequences using MuTect [35] and
Indelocator [34], respectively. We also used ANNOVAR for functional annotation of somatic
mutations on their encoded amino acids [36].
4.4. Copy Number Alterations
Somatic copy number alterations (SCNAs) were identified using VarScan2 [37]. Ratios of
sequencing depth from the tumor and matched normal genomes were calculated for 1 kb bins, and
guanine-cytosine (GC) -corrected ratios were segmented using the circular binary segmentation
(CBS) algorithm [38]. Tumor purity and ploidy was estimated using the SCNA segment profiles and
the allele frequencies of somatic mutations using the ABSOLUTE algorithm [39]. The cancer cell
fraction (CCF) of somatic mutations as the proportion of cancer cells in the admixture cell population
was also estimated using ABSOLUTE. CCF-based gene set enrichment analysis (GSEA) [40] wasCancers 2020, 12, 325 13 of 16
performed using c2cp (curated pathway) gene sets as available in MSigDB
(http://software.broadinstitute.org/gsea/msigdb).
4.5. Microsatellite Instability
Microsatellite instability (MSI) was identified from the sequencing data as previously described
[22]. A total of 146,447 exonic microsatellites were used as a reference. The length of sequencing reads
from the tumor and matched normal genomes was identified for each exonic microsatellite. The
distribution of repeat length between the tumor and matched normal genomes was compared per
reference repeat, and the statistical significance was evaluated by Kolmogorov–Smirnov test.
4.6. Clustering of Tumor Cell Populations Using PyClone
To compare mutation-based subclonal structures between adenoma and carcinoma pairs, we
used Bayesian clustering with PyClone (version 0.13.1) [41] to estimate per-cluster cellular prevalence
based on somatic SNV and copy number using a Markov chain Monte Carlo-based (MCMC-based)
framework with 10,000 iterations. Somatic SNVs and purity-adjusted allele-specific copy numbers
were obtained from MuTect and ABSOLUTE, respectively, and used as inputs for PyClone. To
identify the changes of the subclonal landscape between adenoma and carcinoma, we also ran
PyClone using the “one-sample-only” option and assembled sample-wide results for individual
patients. Serial analysis for shared mutations between adenoma and carcinoma was also performed
using PyClone with the “two-sample” option to obtain changes of cellular prevalence of shared
clusters.
4.7. Driver Mutation Identification
We employed the tier system of driver genes for colorectal and gastric cancers using the IntOGen
database (catalog of driver mutations updated in May 2016, https://www.intogen.org/download).
With tier 1 and 2 driver mutations from the IntOGen database, we performed PyClone clustering and
CCF analysis between adenoma and carcinoma pairs [42,43].
Tier 1 driver mutations are those likely to be involved in oncogenic transformation with
documented and reproducible activity relevant to cancer. Tier 2 mutations are composed of genes
with strong indications of a role in cancer but considered to be of lower confidence as drivers. Tier 2
alterations are relatively more recent targets, where the body of evidence supporting their role is still
being accumulated [44]. In this study, 74 and 58 genes (a list of genes is shown in Table S5) were
obtained from the IntOGen database for the analysis of colorectal and gastric cases, respectively.
5. Conclusions
In summary, we report the genomic profiles of co-existing benign and malignant lesions that
may provide the evolution-based categorization of genomic alterations and the inferred evolution of
mutational landscape in colorectal and gastric cancers. In clinical practice, our results may aid in the
discovery and development of the clinically important biomarkers in colorectal and gastric cancers.
Supplementary Materials: The following are available online at www.mdpi.com/xxx/s1, Table S1, The
clinicopathological information of 21 patients. Table S2, The list of somatic mutations identified in 21 cases. Case
represent colorectal (C1–C11) and gastric (S1–S10) with “A” and “C” representing adenoma and carcinoma,
respectively. Genomic coordinates of chromosome (Chr) and start/end points are based on hg19. Mutation allele
frequencies are shown as TUMOR_ref and TUMOR_alt for read counts supporting the corresponding mutations
and wildtype alleles. CCG represents cancer census genes. Table S3, The list of genes substantially enriched from
CCF/clonality-based gene set enrichment analysis in colorectal and gastric tumors. Ca-clonal represents those
enriched with CCF (carcinoma) > CCF (adenoma) and vice versa for Ad-Clonal. ES and NES represent
enrichment score and normalized ES, respectively. “Common” tumor types represent the GSEA results of two
tumor types combined excluded for three hypermutated cases. Table S4, The basic information of sequencing in
21 cases. Table S5, The list of tier 1 and 2 driver genes for analyzing colorectal and gastric cases. Figure S1,
Representative histopathological micrograph of gastric and colorectal adenoma and carcinoma (H&E staining,Cancers 2020, 12, 325 14 of 16
magnification ×200). (A) colorectal adenoma, (B) colorectal carcinoma, (C) gastric adenoma and (D) gastric
carcinoma. Figure S2, The proportion of somatic mutations leading to different amino acid changes as well as
the six mutation spectra. The proportion of different mutation categories in lesion-common mutations were
compared to those of adenoma- and carcinoma-specific mutations, but no statistically significant difference was
shown. Colorectal (C1–C11) and stomach cases (S1–S10) are represented with C and S, respectively. Figure S3,
Inference of evolutionary fitness landscape using cellular prevalence of mutation clusters from PyClone analysis
per each tumor sample. (A) shows the inferred alteration of fitness landscape between colorectal adenoma–
carcinoma pairs from C1 to C11, respectively. (B) reveals the inferred alteration of fitness landscape between
gastric adenoma–carcinoma pairs from S2 to S10, respectively. The analyses revealed that the majority of the
cases (e.g., 7/11 colorectal cases; C1, C2, C3, C4, C7, C8, and C11 and 6/10 gastric cases; S3, S4, S6, S7, S8, and S9)
showed sharper fitness peaks in carcinomas. Figure S4, Examples of MSI events in two MSI-H cases. For 2 MSI-
H cases (C4 and S10), their example MSI events in AVCR2A and TGFBR2 loci are shown as the adenoma- or
carcinoma-specific shortening of MS repeat length (x-axis) compared to their matched normals.
Author Contributions: Conceptualization and experimental design: S.H.L., C.-H.L., T.-M.K., Development of
methodology: J.Y., T.-M.K., Investigation and collection of data: S.H.L, C.-H.L, Analysis and interpretation of
data: S.H.L., J.Y., Y.S.S., T.-M.K., Writing, review, and/or revision of the manuscript: S.H.L., Y.S.S., C.-H.L., T.-
M.K., Approval of the final version: S.H.L., T.-M.K. All authors have read and agreed to the published version
of the manuscript.
Funding: The authors wish to acknowledge the financial support of the Catholic Medical Center Research
Foundation, the Research Fund of Seoul St. Mary’s Hospital made in the program year of 2016 and the National
Research Foundation of Korea (2012R1A5A2047939). This research was supported by a grant (HI15C3224 and
HI15C1578) from the Korea Health Technology R&D Project through the Korea Health Industry Development
Institute (KHIDI), which is funded by the Ministry of Health & Welfare, Korea.
Conflicts of interest: The authors declare no conflicts of interest.
References
1. Siegel, R.L.; Miller, K.D.; Fedewa, S.A.; Ahnen, D.J.; Meester, R.G.S.; Barzi, A.; Jemal, A. Colorectal cancer
statistics, 2017. CA Cancer J. Clin. 2017, 67, 177–193, doi:10.3322/caac.21395.
2. Siegel, R.L.; Miller, K.D.; Jemal, A. Cancer Statistics, 2017. CA Cancer J. Clin. 2017, 67, 7–30,
doi:10.3322/caac.21387.
3. Cancer Genome Atlas Network. Comprehensive molecular characterization of human colon and rectal
cancer. Nature 2012, 487, 330–337, doi:10.1038/nature11252.
4. Cancer Genome Atlas Research Network. Comprehensive molecular characterization of gastric
adenocarcinoma. Nature 2014, 513, 202–209, doi:10.1038/nature13480.
5. Fearon, E.R. Molecular genetics of colorectal cancer. Annu. Rev. Pathol. 2011, 6, 479–507,
doi:10.1146/annurev-pathol-011110-130235.
6. Fearon, E.R.; Vogelstein, B. A genetic model for colorectal tumorigenesis. Cell 1990, 61, 759–767.
7. Correa, P. Human gastric carcinogenesis: a multistep and multifactorial process--First American Cancer
Society Award Lecture on Cancer Epidemiology and Prevention. Cancer Res. 1992, 52, 6735–6740.
8. Brini, C.; Bogliolo, G.; Pontone, S.; Ierfone, N.; Chessa, A.; Pontone, P. Adenomas with severe dysplasia and
early carcinoma of the colon-rectum: our experience of 27 patients. Il Giornale di Chirurgia 2001, 22, 26–28.
9. Meyerson, M.; Gabriel, S.; Getz, G. Advances in understanding cancer genomes through second-generation
sequencing. Nat. Rev. Genet. 2010, 11, 685–696, doi:10.1038/nrg2841.
10. Yachida, S.; Jones, S.; Bozic, I.; Antal, T.; Leary, R.; Fu, B.; Kamiyama, M.; Hruban, R.H.; Eshleman, J.R.;
Nowak, M.A.; et al. Distant metastasis occurs late during the genetic evolution of pancreatic cancer. Nature
2010, 467, 1114–1117, doi:10.1038/nature09515.
11. Kim, T.M.; An, C.H.; Rhee, J.K.; Jung, S.H.; Lee, S.H.; Baek, I.P.; Kim, M.S.; Chung, Y.J. Clonal origins and
parallel evolution of regionally synchronous colorectal adenoma and carcinoma. Oncotarget 2015, 6, 27725–
27735, doi:10.18632/oncotarget.4834.
12. Landau, D.A.; Carter, S.L.; Stojanov, P.; McKenna, A.; Stevenson, K.; Lawrence, M.S.; Sougnez, C.; Stewart,
C.; Sivachenko, A.; Wang, L.; et al. Evolution and impact of subclonal mutations in chronic lymphocytic
leukemia. Cell 2013, 152, 714–726, doi:10.1016/j.cell.2013.01.019.Cancers 2020, 12, 325 15 of 16
13. Lawrence, M.S.; Stojanov, P.; Polak, P.; Kryukov, G.V.; Cibulskis, K.; Sivachenko, A.; Carter, S.L.; Stewart,
C.; Mermel, C.H.; Roberts, S.A.; et al. Mutational heterogeneity in cancer and the search for new cancer-
associated genes. Nature 2013, 499, 214–218, doi:10.1038/nature12213.
14. Wolff, R.K.; Hoffman, M.D.; Wolff, E.C.; Herrick, J.S.; Sakoda, L.C.; Samowitz, W.S.; Slattery, M.L. Mutation
analysis of adenomas and carcinomas of the colon: Early and late drivers. Genes Chromosomes Cancer 2018,
57, 366–376, doi:10.1002/gcc.22539.
15. Irahara, N.; Baba, Y.; Nosho, K.; Shima, K.; Yan, L.; Dias-Santagata, D.; Iafrate, A.J.; Fuchs, C.S.; Haigis, K.M.;
Ogino, S. NRAS mutations are rare in colorectal cancer. Diagn. Mol. Pathol. 2010, 19, 157–163,
doi:10.1097/PDM.0b013e3181c93fd1.
16. Lin, S.H.; Raju, G.S.; Huff, C.; Ye, Y.; Gu, J.; Chen, J.S.; Hildebrandt, M.A.T.; Liang, H.; Menter, D.G.; Morris,
J.; et al. The somatic mutation landscape of premalignant colorectal adenoma. Gut 2017, 10.1136/gutjnl-
2016-313573, doi:10.1136/gutjnl-2016-313573.
17. Bloushtain-Qimron, N.; Yao, J.; Snyder, E.L.; Shipitsin, M.; Campbell, L.L.; Mani, S.A.; Hu, M.; Chen, H.;
Ustyansky, V.; Antosiewicz, J.E.; et al. Cell type-specific DNA methylation patterns in the human breast.
Proc. Natl. Acad. Sci. USA 2008, 105, 14076–14081, doi:10.1073/pnas.0805206105.
18. Han, B.; Bhowmick, N.; Qu, Y.; Chung, S.; Giuliano, A.E.; Cui, X. FOXC1: an emerging marker and
therapeutic target for cancer. Oncogene 2017, 36, 3957–3963, doi:10.1038/onc.2017.48.
19. Jung, S.H.; Kim, S.Y.; An, C.H.; Lee, S.H.; Jung, E.S.; Park, H.C.; Kim, M.S.; Chung, Y.J.; Lee, S.H. Clonal
Structures of Regionally Synchronous Gastric Adenomas and Carcinomas. Clin. Cancer Res. 2018, 24, 4715–
4725, doi:10.1158/1078-0432.CCR-18-0345.
20. Wright, S. The Roles of Mutation, Inbreeding, Crossbreeding, and Selection in Evolution. Proc. Natl. Acad.
Sci. USA 1932, 1, 356–366.
21. Cross, W.; Kovac, M.; Mustonen, V.; Temko, D.; Davis, H.; Baker, A.M.; Biswas, S.; Arnold, R.; Chegwidden,
L.; Gatenbee, C.; et al. The evolutionary landscape of colorectal tumorigenesis. Nat. Ecol. Evol. 2018, 2, 1661–
1672, doi:10.1038/s41559-018-0642-z.
22. Kim, T.M.; Laird, P.W.; Park, P.J. The landscape of microsatellite instability in colorectal and endometrial
cancer genomes. Cell 2013, 155, 858–868, doi:10.1016/j.cell.2013.10.015.
23. Stachler, M.D.; Taylor-Weiner, A.; Peng, S.; McKenna, A.; Agoston, A.T.; Odze, R.D.; Davison, J.M.; Nason,
K.S.; Loda, M.; Leshchiner, I.; et al. Paired exome analysis of Barrett's esophagus and adenocarcinoma. Nat.
Genet. 2015, 47, 1047–1055, doi:10.1038/ng.3343.
24. Shibata, D. Mutation and epigenetic molecular clocks in cancer. Carcinogenesis 2011, 32, 123–128,
doi:10.1093/carcin/bgq239.
25. Sottoriva, A.; Kang, H.; Ma, Z.; Graham, T.A.; Salomon, M.P.; Zhao, J.; Marjoram, P.; Siegmund, K.; Press,
M.F.; Shibata, D.; et al. A Big Bang model of human colorectal tumor growth. Nat. Genet. 2015, 47, 209–216,
doi:10.1038/ng.3214.
26. Walter, M.J.; Shen, D.; Ding, L.; Shao, J.; Koboldt, D.C.; Chen, K.; Larson, D.E.; McLellan, M.D.; Dooling, D.;
Abbott, R.; et al. Clonal architecture of secondary acute myeloid leukemia. N. Engl. J. Med. 2012, 366, 1090–
1098, doi:10.1056/NEJMoa1106968.
27. Yap, T.A.; Gerlinger, M.; Futreal, P.A.; Pusztai, L.; Swanton, C. Intratumor heterogeneity: seeing the wood
for the trees. Sci. Transl. Med. 2012, 4, 127ps110, doi:10.1126/scitranslmed.3003854.
28. Hudler, P. Challenges of deciphering gastric cancer heterogeneity. World J. Gastroenterol. 2015, 21, 10510–
10527, doi:10.3748/wjg.v21.i37.10510.
29. Huang, J.; Papadopoulos, N.; McKinley, A.J.; Farrington, S.M.; Curtis, L.J.; Wyllie, A.H.; Zheng, S.; Willson,
J.K.; Markowitz, S.D.; Morin, P.; et al. APC mutations in colorectal tumors with mismatch repair deficiency.
Proc. Natl. Acad. Sci. USA 1996, 93, 9049–9054.
30. Shibata, D.; Navidi, W.; Salovaara, R.; Li, Z.H.; Aaltonen, L.A. Somatic microsatellite mutations as
molecular tumor clocks. Nat. Med. 1996, 2, 676–681.
31. Le, D.T.; Uram, J.N.; Wang, H.; Bartlett, B.R.; Kemberling, H.; Eyring, A.D.; Skora, A.D.; Luber, B.S.; Azad,
N.S.; Laheru, D.; et al. PD-1 Blockade in Tumors with Mismatch-Repair Deficiency. N. Engl. J. Med. 2015,
372, 2509–2520, doi:10.1056/NEJMoa1500596.
32. Li, H.; Durbin, R. Fast and accurate short read alignment with Burrows-Wheeler transform. Bioinformatics
2009, 25, 1754–1760, doi:10.1093/bioinformatics/btp324.Cancers 2020, 12, 325 16 of 16
33. Li, H.; Handsaker, B.; Wysoker, A.; Fennell, T.; Ruan, J.; Homer, N.; Marth, G.; Abecasis, G.; Durbin, R. The
Sequence Alignment/Map format and SAMtools. Bioinformatics 2009, 25, 2078–2079,
doi:10.1093/bioinformatics/btp352.
34. DePristo, M.A.; Banks, E.; Poplin, R.; Garimella, K.V.; Maguire, J.R.; Hartl, C.; Philippakis, A.A.; del Angel,
G.; Rivas, M.A.; Hanna, M.; et al. A framework for variation discovery and genotyping using next-
generation DNA sequencing data. Nat. Genet. 2011, 43, 491–498, doi:10.1038/ng.806.
35. Cibulskis, K.; Lawrence, M.S.; Carter, S.L.; Sivachenko, A.; Jaffe, D.; Sougnez, C.; Gabriel, S.; Meyerson, M.;
Lander, E.S.; Getz, G. Sensitive detection of somatic point mutations in impure and heterogeneous cancer
samples. Nat. Biotechnol. 2013, 31, 213–219, doi:10.1038/nbt.2514.
36. Wang, K.; Li, M.; Hakonarson, H. ANNOVAR: functional annotation of genetic variants from high-
throughput sequencing data. Nucleic Acids Res. 2010, 38, e164, doi:10.1093/nar/gkq603.
37. Koboldt, D.C.; Zhang, Q.; Larson, D.E.; Shen, D.; McLellan, M.D.; Lin, L.; Miller, C.A.; Mardis, E.R.; Ding,
L.; Wilson, R.K. VarScan 2: somatic mutation and copy number alteration discovery in cancer by exome
sequencing. Genome Res. 2012, 22, 568–576, doi:10.1101/gr.129684.111.
38. Olshen, A.B.; Venkatraman, E.S.; Lucito, R.; Wigler, M. Circular binary segmentation for the analysis of
array-based DNA copy number data. Biostatistics 2004, 5, 557–572, doi:10.1093/biostatistics/kxh008.
39. Carter, S.L.; Cibulskis, K.; Helman, E.; McKenna, A.; Shen, H.; Zack, T.; Laird, P.W.; Onofrio, R.C.; Winckler,
W.; Weir, B.A.; et al. Absolute quantification of somatic DNA alterations in human cancer. Nature
biotechnology 2012, 30, 413–421, doi:10.1038/nbt.2203.
40. Subramanian, A.; Tamayo, P.; Mootha, V.K.; Mukherjee, S.; Ebert, B.L.; Gillette, M.A.; Paulovich, A.;
Pomeroy, S.L.; Golub, T.R.; Lander, E.S.; et al. Gene set enrichment analysis: a knowledge-based approach
for interpreting genome-wide expression profiles. Proc. Natl. Acad. Sci. USA 2005, 102, 15545–15550,
doi:10.1073/pnas.0506580102.
41. Roth, A.; Khattra, J.; Yap, D.; Wan, A.; Laks, E.; Biele, J.; Ha, G.; Aparicio, S.; Bouchard-Cote, A.; Shah, S.P.
PyClone: statistical inference of clonal population structure in cancer. Nat. Methods 2014, 11, 396–398,
doi:10.1038/nmeth.2883.
42. Gonzalez-Perez, A.; Perez-Llamas, C.; Deu-Pons, J.; Tamborero, D.; Schroeder, M.P.; Jene-Sanz, A.; Santos,
A.; Lopez-Bigas, N. IntOGen-mutations identifies cancer drivers across tumor types. Nat. Methods 2013, 10,
1081–1082, doi:10.1038/nmeth.2642.
43. Tamborero, D.; Rubio-Perez, C.; Deu-Pons, J.; Schroeder, M.P.; Vivancos, A.; Rovira, A.; Tusquets, I.;
Albanell, J.; Rodon, J.; Tabernero, J.; et al. Cancer Genome Interpreter annotates the biological and clinical
relevance of tumor alterations. Genome Med. 2018, 10, 25, doi:10.1186/s13073-018-0531-8.
44. Rubio-Perez, C.; Tamborero, D.; Schroeder, M.P.; Antolin, A.A.; Deu-Pons, J.; Perez-Llamas, C.; Mestres, J.;
Gonzalez-Perez, A.; Lopez-Bigas, N. In silico prescription of anticancer drugs to cohorts of 28 tumor types
reveals targeting opportunities. Cancer Cell 2015, 27, 382–396, doi:10.1016/j.ccell.2015.02.007.
© 2020 by the authors. Licensee MDPI, Basel, Switzerland. This article is an open access
article distributed under the terms and conditions of the Creative Commons Attribution
(CC BY) license (http://creativecommons.org/licenses/by/4.0/).You can also read