Sensory assessment of grape polyphenolic fractions: an insight into the effects of anthocyanins on in-mouth perceptions - OENO One
←
→
Page content transcription
If your browser does not render page correctly, please read the page content below
Received: 23 Juillet 2020 y Accepted: 28 September 2020 y Published: 19 November 2020
DOI:10.20870/oeno-one.2020.54.4.4142
                                                                                                                    VINE AND WINE
                                                                                                                    OPEN ACCESS JOURNAL

Sensory assessment of grape polyphenolic fractions:
an insight into the effects of anthocyanins on in-mouth perceptions

Maria Alessandra Paissoni1,2,3,*, Pierre Waffo-Teguo2,3, Wen Ma2,3,4, Michael Jourdes2,3, Simone Giacosa1,
Susana Río Segade1, Luca Rolle1 and Pierre-Louis Teissedre2,3
1
  Dipartimento di Scienze Agrarie, Forestali e Alimentari. Università degli Studi di Torino, Grugliasco, Italy
2 ISVV, EA 4577 Œnologie, 33140, Université de Bordeaux, Villenave d’Ornon, France
3 Inrae, ISVV, USC 1366 Œnologie, 33140, Villenave d’Ornon, France
4 Wine School, Ningxia University, Yinchuan, Ningxia, 750021, P.R. China

*corresponding author: mariaalessandra.paissoni@unito.it

     ABSTRACT

Anthocyanins are extracted from grape skins during maceration and are responsible for the red colour of wine. Their
contribution to in-mouth sensations is mainly related to their interactions with condensed tannins, which are largely
responsible for wine astringency and mouthfeel-related features. Recently, the influence of several groups of
polyphenols, together with other relevant non-phenolic wine constituents, was investigated in terms of their ability
to modify the sensory perception of condensed tannins. The aim of this study was to investigate the influence of
three acylation groups of anthocyanins (glucoside, acetylglucoside, and p-coumaroylglucoside) extracted from grape
skins on in-mouth related features. An extract of total anthocyanins and their individual fractions were tasted using
different sensory approaches (triangle test, check-all-that apply and descriptive analysis) and compared to
polyphenols extracted from grape skins and seeds. The investigated sensations were overall astringency and
astringency sub-qualities, which were divided into two groups: sensation during tasting (in-mouth, particulates) and
sensation after expectoration (surface smoothness). Bitterness was also studied. Anthocyanin fractions were added
to skin and seed extracts and tasted as mixtures to find out if anthocyanins modify in-mouth perception. Although
the anthocyanin fractions showed a low sensory impact, total anthocyanins and the glucoside fraction were
perceived at the concentration ranges found in wines (400 mg/L), and they were found to influence astringency
intensity and soft astringency sub-qualities, such as “velvety” and “chalky”. The addition of glucoside anthocyanin
(400 mg/L) to skin and seed extract (1000 mg/L) modified in-mouth perception; in particular, seed extract was
perceived as being more astringent and was characterised by harsher astringency sub-qualities (surface smoothness
and particulates). In contrast, the addition of glucoside anthocyanin to the skin extract led to lower surface
smoothness, although the intensity of overall astringency was unchanged. These results confirm that the presence of
anthocyanins can modify the perception of in-mouth sensations and interact to different extents with other
polyphenols, thus leading to the modification of the intensity of astringency and its sub-qualities.

    KEYWORDS
anthocyanins, winegrapes, check-all-that-apply (CATA), descriptive analysis (DA), sensory analysis, polyphenols

OENO One 2020, 54, 4, 1059-1075                                 © 2020 International Viticulture and Enology Society - IVES 1059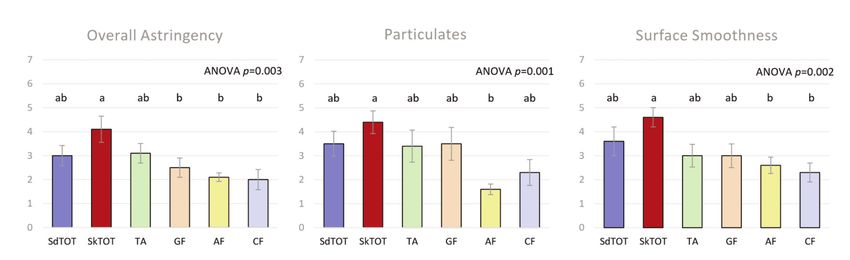
Maria Alessandra Paissoni et al.

                 INTRODUCTION                                      the unspiked fractions (Broussard et al., 2001).
                                                                   These results have been supported by
In red wines, colour and “in-mouth” features                       winemaking experiments in which anthocyanins
strongly influence the sensory perception of                       or grape pomace were added to white grape
quality (Peynaud, 1987; Parpinello et al., 2009,                   juices before fermentation, showing that
Piombino et al., 2020). These characteristics are                  anthocyanins increase astringency sub-qualities
mainly connected to the polyphenols extracted                      related to surface smoothness (fine grain), as
from black grapes. Among them, two groups are                      well as other “in-mouth” attributes, such as
particularly relevant in terms of content:                         “dry”, “grippy” and perceived viscosity in final
anthocyanins and condensed tannins (also                           wines (Oberholster et al., 2009). These
generally referred to as proanthocyanidins), and                   descriptors agreed in part with the results of
their constituting monomers, the flavan-3-ols.                     previous studies, in which anthocyanins were
Anthocyanins are responsible for the red wine                      tasted in model wine solutions: they were found
colour, whereas condensed tannins are involved                     to contribute to “fullness”, as well as to
in both colour stabilisation and the “in-mouth”                    “chalkiness” and “coarseness” sensations (Vidal
characteristics of wine, such as astringency and                   et al., 2004b), and to increase “dryness” and
bitterness (Ma et al., 2014). Recently, wine                       “roughness” (Vidal et al., 2004c). Anthocyanin
research has focused on the improvement of                         purification of grape skins and wines in high
colour parameters and the modification of “in                      quantities is still a challenge, since there are
mouth” features with the development of                            several compounds which interfer with sensory
technologies and practices aiming to improve the                   properties (mainly flavonol-belonging
initial grape phenolic content and composition,                    molecules) and which are difficult to avoid in
their extraction into grape juice during                           extraction steps. In an improvement in
maceration, and wine ageing management                             purification, fractions of free glucoside and
(Harrison, 2018). Nevertheless, wine tannin                        p-coumaroylated anthocyanins were shown not
concentration and properties alone do not                          to differ from the unspiked model wine solution
represent the full “in-mouth” complexity of                        in both the wine range (13 % v/v) and at a
wine. Wine technological parameters, such as                       reduced ethanol level (5 % v/v) (Vidal et al.,
ethanol content, total acidity and pH influence                    2004a). Besides fraction composition and purity,
perception of astringency (Pickering and                           such different results from sensory analyses may
Demiglio, 2008; Fontoin et al., 2008, Laguna et                    be due to the variability of the sensory technique
al., 2017). Furthermore, in wine, other                            used (e.g., different descriptors, reference
macromolecules (e.g., polysaccharides, proteins,                   standards and matrix solutions), as well as to
and ellagitannins) derived from grape, yeasts, or                  differences in assessor training (Gawel, 1997;
external sources (e.g., wood used in ageing) can                   Gibbins and Carpenter, 2013; Sáenz-Navajas et al.,
modulate the tannin effect or directly elicit                      2016)
astringency sensations (Glabasnia and Hofmann,
2006; Fukui et al., 2002; Laguna et al., 2017).                    Another possible option for evaluating the
                                                                   sensorial impact of polyphenols is the
The role of anthocyanins in particular has been                    instrumental analysis of astringency and
investigated to better understand how and to                       bitterness (Table 1). Astringency is a complex
what extent they can modulate “in-mouth”                           sensation involving several mechanisms, from
properties (Table 1). Although they are known to                   sensory active molecules interacting with
contribute to depleting the astringency of tannins                 different salivary protein families to the
with the formation of complexes (Vidal et al.,                     formation of soluble and precipitable complexes.
2004a) by the reduction of the available -OH                       The onset of astringency involves hydrogen
group interacting with salivary proteins, the                      bonds, as well as hydrophobic and electrostatic
direct eliciting capacity of anthocyanins is far                   interactions between sensory active molecules
from clear. Pure anthocyanins have been                            and proteins, and their complexity increases in
reported to have a very “mild indistinctive taste”                 mixed polyphenol solutions (Soares et al., 2019).
(Singleton and Noble, 1976), supporting the                        Moreover, additional phenomena can occur, such
hypothesis that their role may only be relevant to                 as the direct activation of mechanoreceptors, or
the pigments formed with flavan-3-ols. In                          direct interaction with the mouth epithelium
contrast, the addition of a mixture of isolated                    (Gibbins and Carpenter, 2013; Soares et al.,
grape anthocyanins to seed and skin extracts has                   2016). Recently, the involvement of
been found to increase astringency compared to                     anthocyanins in the onset and formation of

1060 © 2020 International Viticulture and Enology Society - IVES                          OENO One 2020, 54, 4, 1059-1075
TABLE 1. Studies which have carried out sensory and instrumental analyses on anthocyanin sensory properties.
Sensory analysis
Year Astringency Bitterness Mouthfeel Notes References
1976 "indistinct mild taste" Singleton and Noble (1976)
2001 + = - Anthocyanin extract added to seed and skin tannins in white wine Brossaud et al. (2001)
OENO One 2020, 54, 4, 1059-1075
2004 + dryness, roughness, chalkiness Anthocyanin extract (0.5 g/L, purity 78 %) added to model wine at 13 % ethanol Vidal et al. (2004c)
2004 + = fullness, chalkiness, coarseness Anthocyanin extract (0.5 g/L, purity 70 %) added to model wine at 11, 13, and 15 % ethanol Vidal et al. (2004b)
Anthocyanin glucosides (0.5 g/L, purity 98 %) and coumaroylated (0.5 g/L, purity 87 %) in model
in-mouth dryness
2004 wine at 13 % ethanol Vidal et al. (2004a)
= - Anthocyanin glucosides and coumaroylated (0.5 g/L) in un-buffered, 5 % ethanol solution
2009 + = fine grain, dryness, grippiness, viscosity Anthocyanin extracts (purity 95 %) added at 1.44 g/L in white juice during winemaking Oberholster et al. (2009)
Two p-coumaroylated anthocyanin contributors of bitterness, p-coumaroylated petunidin and
2014 + + Gonzalo-Diago et al. (2014)
malvidin-3-O-gucoside contributors to astringency
2015 + Glucoside anthocyanin extract (purity 95 %), moderate velvety and astringency intensity Ferrer-Gallego et al. (2015)
2017 + + dryness, bitterness, persistency Oligomeric anthocyanins from wine fractions redissolved in 7 % ethanol buffer Sáenz-Navajas et al. (2017)
Anthocyanin extracts, glucoside, acetylated, and coumaroylated fractions (purity 95, 98, 87 and
2018 + + Paissoni et al. (2018)
91 % respectively) in model wine at 12 % ethanol; BETa 255, 297, 68, and 58 mg/L, respectively
Chemical analysis
Year Astringency Bitterness Interaction Notes
Malvidin-3-O-glucoside activates TAS2R7 bitterness receptors (threshold of activation 6.0 µM),
2013 + TAS2Rsb activation Soares et al. (2013)
whereas cyanidin-3-O-glucoside did not activate TAS2Rs studied
Precipitable/soluble complexes Individual glucoside formed complexes with acidic PRPs. Evidence of soluble complexes between
2015 + Ferrer-Gallego et al. (2015)
with saliva PRPsc malvidin-3-O-glucoside with Histatin and PRPs.
Decrease in acetylated and coumaroylated fractions when saliva was added. Precipitation occurs
2018 + Precipitable complexes with saliva Paissoni et al. (2018)
depending on the anthocyanin acylation.
Malvidin-3-O-glucoside and (-) epicatechin synergic interaction with PRPs. The first driven by
2019 + Electrostatic interactions electrostatic interactions, the latter by hydrophobic and hydrophilic interactions. Interactions are Soares et al. (2019)
increased in the presence of mixture. At high concentration non-specific reactions
Anthocyanins (glucosides extract) are retained by different oral cells (HSC-3 from tongue and
2020 + Oral cell interactions TR146 from buccal mucosa). Saliva and mucosal pellicle on the cell line decreased the Soares et al. (2020)
anthocyanins retained.
Symbols “+” and “=” indicate increased or unchanged perception respectively. a BET=Best estimated threshold, b TAS2Rs = human bitter taste receptors encoded by the TASTE 2 Receptor
(TAS2R) gene family, c PRPs = Proline-rich proteins.
© 2020 International Viticulture and Enology Society - IVES 1061Maria Alessandra Paissoni et al.
complexes has been demonstrated (Ferrer- fractions.
Gallego et al., 2015; Paissoni et al., 2018;
Soares et al., 2019). Considering bitterness, 1.1. Anthocyanin extracts
anthocyanins have been found to activate the Total anthocyanin (TA) and its derived glucoside
corresponding taste receptors (Soares et al., (GF), acetylglucoside (AF), and coumaroyl-
2013). Nevertheless, testing this stimulus in an glucoside (CF) fractions were extracted and
alcoholic media is still impossible and it is purified by means of Centrifugal Partition
difficult to study complex polyphenol matrices, Chromatography (CPC) and preparative HPLC
as is the case for wine. Therefore, despite the as described in detail by Paissoni et al. (2018.
possibility to instrumentally study the different The final extract purity was 95 %, 98 %, 87 %,
mechanisms driving astringency sensations, the and 91 % for TA, GF, AF, and CF respectively,
final perception is influenced by the complexity calculated using the area ratios of 520 nm and
of wine polyphenols and other sensory active 280 nm by HPLC-DAD. Total anthocyanin
molecules mixture. Therefore, together with the extracts (TA) from Barbera and Nebbiolo were
instrumental evidence of anthocyanin individually tasted in a preliminary evaluation
involvement in astringency-driver mechanisms (triangle test; ISO 4120:1983), whereas
and bitterness stimuli, sensory analysis is still subsequent evaluations were performed on
necessary for understanding the final in-mouth Barbera TA only. The fractions differentiated by
features of solutions. acylation were obtained from a mixture of the
The aim of this study was to investigate the two different varieties.
sensory properties of grape extracts, with a 1.2. Total polyphenol extract
particular focus on grape anthocyanins. First,
grape extracts were tasted to establish their Skin and seed polyphenol extraction was
sensory active thresholds, and the appropriate performed as described by González-Centeno et
terminology was selected in order to evaluate al. (2012) with an ASE 350 Accelerated Solvent
their contribution to in-mouth sensory properties Extraction System (Dionex Corporation.
by using a check-all-that-apply (CATA) Sunnyvale, CA, USA). A mixture of Barbera and
methodology. After that, the assessors received Nebbiolo ground grape seeds and skins was used
training in the selected categories and to produce the polyphenol extracts. Grape skins
descriptors, and then carried out a descriptive and seeds were separately subjected to eight
analysis (DA) of different individual grape solid/liquid consecutive extractions with
extracts: polyphenol extracts from skins and acetone/water (80:20, v/v) for the solvent system
seeds and anthocyanin extracts divided (40 mL of the corresponding solvent system).
according to acylation group. Moreover, to find The ASE experimental settings were reported in
out if anthocyanins can influence the in-mouth Ma et al. (2016). The extract was then
perception of wine, the anthocyanin extract and evaporated under reduced pressure and
its derived fractions were added to the lyophilised to create crude skin and seed
polyphenol-based extracts and evaluated extracts. The crude polyphenol extract (equal to
following the same descriptive sensory 5 g of dried powder of skins or seeds) was
procedure. solubilised in 250 mL of water/ethanol
(95:5, v/v) and extracted three times with
MATERIALS AND METHODS chloroform to remove the lipophilic material
1. Extraction and purification (Lorrain et al., 2011). This aqueous extract was
of grape polyphenols concentrated and lyophilised to obtain a dry
powder, indicated as SkTOT and SdTOT for skin
Grape samples from Vitis vinifera L. cv and seed extracts respectively. The obtained
Nebbiolo and Barbera were collected at maturity extracts were analysed via phloroglucinolysis
in the Piedmont region (Northwestern Italy) (Lorrain et al., 2011). Mean degree of
during the 2015 vintage. Grape skins were polymerisation (mDP) was 15.5 ± 0.45 and
peeled using a laboratory spatula and grape 3.7 0± 0.10 for SkTOT and SdTOT respectively.
seeds were manually removed. The obtained The percentage of galloylation (G %) was
grape material was lyophilised and then ground 15.20 ± 0.27 for SdTOT and 2.20 ± 0.10 for
in a ball grinder; the resulting powder was used SkTOT. The percentage of prodelphinidins
to carry out the extraction of grape polyphenol (Pd %) was 34.00 ± 0.23 for SkTOT, whereas no
1062 © 2020 International Viticulture and Enology Society - IVES OENO One 2020, 54, 4, 1059-1075prodelphinidins were detected in SdTOT. For the 2.2. Preliminary extracts’ evaluation
skin extract, anthocyanin content was determined
by HPLC-DAD (Paissoni et al., 2018), 2.2.1. Triangle test
accounting for 130.2 ± 2.8 mg malvidin-3-O-
Two sessions were dedicated to determining a
glucoside /g of extract, (Sigma–Aldrich, Saint
Quentin Fallavier, France). All the extracts were suitable extract concentration for the experiment.
lyophilised twice before sensory analysis to Triangle tests (ISO 4120:1983) were conducted
ensure the absence of solvents. taking into account the usual wine concentration
ranges and detection thresholds. Two total
2. Sensory analysis of grape extracts anthocyanin extracts (from different grape
cultivars, Nebbiolo and Barbera TA; 250 mg/L),
2.1. General procedure glucoside fractions (GF; 300 and 400 mg/L),
acetylglucosides and coumaroylglucosides
The sensory analyses were conducted in a tasting
fractions (AF and CF; 100 mg/L each), skin
room at the University of Bordeaux, Oenology
polyphenol extract (SkTOT; 500 mg/L), and seed
research unit (ISVV, France). The room fulfilled
the ISO 8589:2007 standard (sound insulation, polyphenol extracts (SdTOT; 500 and 750 mg/L)
constantly regulated temperature). were tasted. The selected extracts were dissolved
in model wine solutions (12.5 % v/v ethanol,
A panel of 18 volunteer assessors from the 4 g/L of tartaric acid, pH 3.5), and were
Oenology department at the University of randomly tasted along with the unspiked model
Bordeaux (ISVV, France) took part in the wine solutions. Nebbiolo vs Barbera TA extracts
experiment. All assessors are considered wine were also tested to find any differences between
experts according to the definition of Parr et al. the two. Barbera TA vs un-spiked model wine
(2002). Nevertheless, a preliminary panel and Barbera TA vs Nebbiolo TA were evaluated
selection process was carried out, in which the in duplicate (once per session) to confirm the
assessors tasted standard solutions: aluminium obtained results. Seed extract and skin extract at
sulphate (AlSu; 2000 mg/L) for astringency, 500 mg/L, GF at 300 mg/L, CF and AF at
quinine sulphate (Qsu; 15 mg/L) for bitterness, 100 mg/L were evaluated in the first session;
tartaric acid (5 g/L) for acidity, and catechin whereas seeds extract at 750 mg/L and GF at
(1 g/L) for both astringency and bitterness (Chira 400 mg/L were evaluated in the second session,
et al., 2012). In order to do this, two tests were with the aim of achieving higher discrimination
performed: a discrimination test (triangle test; from the unspiked model wine. In addition to the
ISO 4120:1983) and an identification test. In the triangle tests, the assessors were asked to report
triangle test, the assessors were asked to the descriptors that helped them identify the
recognise different samples in the series correct sample.
composed of spiked water solution and water
without the standard molecules. For the 2.2.2. Check-All-That-apply (CATA)
identification test, the assessors were asked to for the selection of descriptors
taste four spiked water solutions, and to identify
Four extracts representative of the groups under
and describe the in-mouth sensations perceived.
evaluation were selected for a Check-All-That-
Only those who recognised the sensations
Apply (CATA) analysis, in order to identify the
elicited by the reference standards were accepted
as assessors for the experiment (16 assessors most frequently reported attributes and the terms
remained in the experiment). which were able to best discriminate the extracts
(Varela and Ares, 2012). The selected grape
The assessors were informed of the purification extracts were skin extract (SkTOT; 1000 mg/L),
methodology for obtaining the fractions seed extract (SdTOT; 1000 mg/L), total
conducted in the laboratory. If they chose to anthocyanin extract from Barbera (TA;
continue in the experiment, they signed a consent 400 mg/L), and glucoside fraction of
form. A total of nine sessions were conducted anthocyanins (GF; 400 mg/L) in model wine
prior to the formal evaluation, comprising three solution (12.5 % v/v ethanol, pH 3.5, 4 g/L of
preliminary assessments of the extracts and six tartaric acid). The selection of attributes was
training sessions on the attribute scales of the based on the following: results previously
descriptive analysis (DA). Finally, the formal obtained by Paissoni et al. (2018), the
descriptive analysis (DA) of the investigated descriptors reported in the triangle tests (only the
extracts was conducted in five sessions. ones by assessors who correctly discriminated
OENO One 2020, 54, 4, 1059-1075 © 2020 International Viticulture and Enology Society - IVES 1063Maria Alessandra Paissoni et al.
among samples), and bibliographic research on from astringency, they were provided with
the tasting of grape/wine extracts and fractions, solutions of the mixed stimuli and asked to score
in particular anthocyanins (Oberholster et. al., low/high astringency or bitterness; one solution
2009; Gawel et al., 2000; Vidal et al., 2004a; was representative of low bitterness and high
Vidal et al., 2004b; Vidal et al., 2004c; Sáenz- astringency (2.5 mg/L Qs and 4000 mg/L AlSu),
Navajas et al., 2017). The selected attributes (23 and the other of high bitterness and low
in total) belonged to taste (sweet, bitter, salty, astringency (30 mg/L QSu and 500 mg/L AlSu).
acid), and the selection of astringent sub- The assessors’ scores allowed us to slightly
qualities was based on the mouth-feel wheel modify the scale used for training based on the
terminology proposed by Gawel et al. (2000). tasted fractions (section 2.2.2). Part of the second
The introduced sub-qualities were: weight session focused on the reference standard
(watery, viscous, dense), texture (oily), heat solutions for astringency and bitterness in model
(hot), irritation (prickle, tingle), drying (dry), wine solutions (12.5 % (v/v) ethanol, pH 3.5,
and those related to astringency including 4 g/L of tartaric acid), by carrying out an
surface smoothness (emery, silky) and ordination test of selected scales; i.e., for
particulates (dusty, grainy, chalky), complex astringency (model wine, and model wine plus
terms (soft, round, mouthcoating, aggressive), a 1000, 2000, 4000, and 6000 mg/L AlSu) and for
dynamic attribute (adhesive), and the term bitterness (model wine, and model wine plus 2.5,
“rich”. 5, 10, and 20 mg/L QSu). The assessors were
also asked to distinguish in low, moderate, and
2.3. Descriptive analysis (DA) high astringency and bitterness in mixed
solutions (2.5, 10, 20 mg/L of QSu for bitterness;
2.3.1 Sensory training for descriptive analysis 1000, 4000, and 6000 mg/L of AlSu for
(DA) astringency).
The assessor training on astringency and In the second part of the training (three sessions),
bitterness scales was a slightly modified version the assessors were familiarised with the scales to
of that proposed by Chira et al. (2012). During be used for overall astringency and bitterness,
the first part (two sessions), the assessors were and with the definitions of astringency sub-
familiarised with the different sensations, using a qualities. The assessors discussed the definitions
stimuli concentration range. In the first session, of particulate (in-mouth sensation), surface
low (500 mg/L AlSu and 2.5 mg/L QSu) and smoothness (after expectoration) and irritation.
high (4000 mg/L AlSu and 30 mg/L QSu) Tactile standards were used when possible,
reference standards of astringency and bitterness whereas terms that did not have standards were
dissolved in water were evaluated. To improve agreed upon by written definition. Attribute
the assessors’ ability to distinguish bitterness rating was done on an 8-point scale: 0 =
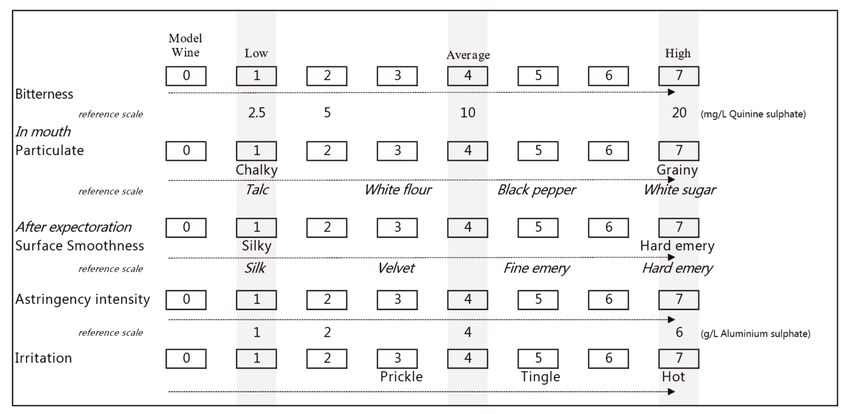
FIGURE 1. Tasting scorecard with anchored standard references.
1064 © 2020 International Viticulture and Enology Society - IVES OENO One 2020, 54, 4, 1059-1075TABLE 2. Descriptors, definitions, and reference standards used in descriptive analysis.
Descriptor Standard or definition Reference
OENO One 2020, 54, 4, 1059-1075
Bitterness (oral) Quinine sulphate (max 20 mg/L, average 10 mg/L)
Overall astringency (oral) Aluminium sulphate (max 6 g/L, average 4 g/L)
Feeling of particulate matter brushing against the surface of the mouth through the movement of the solution
Talc: talc powder
Particulate
Dusty: white flour Gawel et al. (2001)
powder (manual)
Sandy: grounded pepper
Grainy: white sugar
Texture felt on mouth surfaces when the different surfaces came in contact with each other (after expectoration)
Silky: silk
Surface smoothness
Velvety: velvet Gawel et al. (2001)
fabric (manual)
Fine grain: fine cotton
Hard grain: corduroy
Sense of irritation usually associated with carbonation
Irritation Tingly (low) Pickering
definition Prickly (moderate) and Demiglio (2008)
Hot (high)
© 2020 International Viticulture and Enology Society - IVES 1065Maria Alessandra Paissoni et al.
“absence”, 1 = “low” and 7 = “high”). “Low” respectively) to help standardise the use of the
and “high” levels were anchored with the use of scale before sample evaluation. Fabric samples
reference standards for each attribute (Figure 1). for surface smoothness and powdery standards
for particulates were provided during each
For example, for overall astringency, scores of session in each individual booth. The complete
1,4 (corresponding to the average value) and 7 scales for bitterness and overall astringency
corresponded to 1000, 4000, and 6000 mg/L were available in case assessors wanted to try
AlSu respectively, whereas for bitterness, these them again before tasting. All fractions were
scores corresponded to 2.5, 10 and 20 mg/L QSu. served at room temperature and evaluated in
Fabric samples were selected to anchor the individual booths. All extracts were evaluated in
surface smoothness line scale: “silky” (silk model wine (12.5 % v/v ethanol, 4 g/L tartaric
fabric) and “hard emery” (corduroy) were acid, pH 3.5). The final concentrations were
located along the scale at 1 and 7 points
chosen according to the wine concentration
respectively. For the particulate attribute,
range and triangular tests as explained above,
“chalky” (talc powder) and “grainy” (white
which were 1000 mg/L for both SdTOT and
sugar) corresponded to 1 and 7 points. For
SkTOT, 400 mg/L for TA and GF, and 100 mg/L
irritation, definitions were given and placed on a
for CF and AF.
low, moderate, and high scale (defined as
“tingle”, “prickle”, and “hot” at 3, 5 and 7 The individual fractions of anthocyanins, TA,
respectively). The 0 score represented the model GF, and CF, were also added to the SkTOT and
wine solution. SdTOT solutions (1000 mg/L each) in the same
A summary of definitions, standard scales and concentration at which they were tasted
references is provided in Table 2. During the last individually (400 mg/L for TA and GF, and
training session (the sixth), the assessors took 100 mg/L for CF) to investigate if they could
part in a simulation of a descriptive analysis to modify the sensory properties of other
become familiar with the tasting procedure and polyphenols in the wine concentration range.
scorecard. They tasted solutions for stimuli To minimise fatigue and standardise the
enhanced by the samples under evaluation; in assessment process, a tasting and rinsing
particular, a seed tannin extract from cv Nebbiolo procedure was established: the assessors were
(1250 mg/L), skin tannins (1000 mg/L skin asked to (1) sip and swirl the solution in their
commercial oenological tannin) and catechin and mouth for 5-10 s, (2) expectorate, and (3) fill out
gallic acid solutions (both 1000 mg/L). At the the scorecard. After each sample, the assessors
end of each training session, the selected were asked to rinse their mouth out with water,
descriptors or intensity scores for each solution eat a piece of unsalted cracker and rinse again
were compared in a discussion led by the panel with water.
leader.
3. Data analysis
2.3.2. Formal DA of grape extracts
Data were analysed using R software (R Core
The assessors evaluated a maximum of four
team, Version 3.5.0; R Studio, Version 1.1.453).
extract solutions per session for a total of five
The panel performance for CATA questions was
sessions, in each session one sample was
checked using the reproducibility index (Ri), as
repeated to evaluate the assessor’s performance
described by Campo et al. (2008), and calculated
(a maximum total of five samples per session).
Each extract solution was coded with a three- on the replicate sample to check assessor
digit random code, and black ISO repeatability. For the CATA descriptors of
3591:1977 wine glasses were used and randomly selected data, the attributes on the list were
placed in order not to bias perception. ranked according to their citation frequency to
identify the most relevant descriptors for tasting
In each evaluation session, the assessors were and to better distinguish each extract. A
asked to assess the reference model wine Correspondence Analysis (CA) was performed
solution (0 on the scale) and the medium point of on the CATA frequencies table (descriptors in
the scale on which they were trained for overall rows and evaluated extract in columns) using
astringency and bitterness (i.e., 4000 mg/L Factominer R package (Lê et al., 2008). CATA
aluminium sulphate and 10 mg/L quinine significant attributes were assessed with
sulphate for astringency and bitterness Cochran’s Q test (Varela and Ares, 2012). Since
1066 © 2020 International Viticulture and Enology Society - IVES OENO One 2020, 54, 4, 1059-1075CATA was performed as a preliminary approach Concerning total anthocyanin extract (TA), two
to underlining attributes potentially relevant for different extracts from Vitis vinifera L. cv
further investigation, the criteria for significance Nebbiolo and Barbera (with a different ratio of
was increased to p < 0.1 to avoid missing individual anthocyanins and acylation; Paissoni
relevant terms. et al., 2018) were tasted at a concentration of
250 mg/L. Both the extracts were perceived as
The panel performance for descriptive analysis being different to the unspiked model wine
(DA) was evaluated using PanelCheck software solution (p < 0.01). Interestingly, when these two
(version 1.4.2). The panel performance was fractions were compared (400 mg/L), they were
tested on the subset of replicate samples by not perceived as being different. Therefore, just
three-way ANOVA with “replicate”, “sample” one (TA from cv Barbera) was used for the
(extract), and “assessors” as factors and their following experiments. To improve sensitivity, a
interaction. The evaluation was considered concentration of 400 mg/L was chosen, which is
adequate when there were no significant in accordance with young red wine
differences (p > 0.05) in “assessors”*“replicates” concentrations and is similar to other sensory
and “assessors”*“sample” interactions. Principal assessments (Vidal et al., 2004a; 2004b; Ferrer-
component analysis (PCA) as Tucker-1 plots Gallego et al., 2015).
were performed for both attributes and assessors
as described by Tomic et al., 2010. The Regarding the individual fractions, glucoside
assessors’ projections were checked in the anthocyanins (GF) were perceived as different at
loading plot for bitterness, overall astringency, 300 mg/L (p < 0.05), but more so at 400 mg/L
(p < 0.01); thus the latter concentration was
particulate, irritation and surface smoothness in
chosen for further analysis. Acetylated (AF) and
order to assess their agreement on each attribute.
p-coumaroylated (CF) anthocyanins were found
Two-way ANOVA (assessors as random and to differ at 100 mg/L (p < 0.01 and p < 0.05 for
extracts as fixed factors; R package nlme, AF and CF respectively). Therefore, these
Pinheiro et al., 2020) was used to compare DA concentrations were chosen after the triangle
data from the formal sessions, and in case of tests, as they could be easily perceived by the
significant differences, the Tukey HSD post-hoc assessors, although they are very high compared
test (R package multcomp, Hothorn et al., 2008) to the concentrations found in commercial
was performed to establish differences among wines.
extracts. 2. CATA results
RESULTS AND DISCUSSION Assessor performance in a wine CATA analysis
is considered to be adequate if Ri > 0.20 (Campo
1. Triangle test results
et al., 2008). In our case, assessors who failed
The first experiment aimed to assess the this repeatability test were excluded from further
concentrations at which the fractions could be analysis (n = 2). The overall panel performance
perceived by the panel in a triangle test: the (n = 10) was Ri = 0.43, which fulfilled the
tested concentrations and results are reported in repeatability requirement. Only descriptors cited
Table 3. The initial concentration to be tested by at least 20 % of the panel were considered for
was 500 mg/L total polyphenols from the skin further analysis. A frequency table summarises
(SkTOT) and seed (SdTOT) extracts. Although each descriptor individually, which were
SdTOT had already been perceived as different grouped into arbitrarily chosen categories based
by most of the panel (p < 0.05), SkTOT was not on bibliography (Gawel et al., 2000), namely
taste, mouthfeel, astringency sub-qualities and
easily recognised as being different (p > 0.05).
complexive astringency (Table 4).
When the concentration of SdTOT increased to
750 mg/L, more differences were perceived The frequency table shows the most cited terms
(p < 0.001). Because the polyphenol range of a and the most frequently used “group” to describe
red wine can vary by up to several grams per the selected grape extracts. The frequencies were
liter, the concentration chosen for the tasting of also analysed in a Correspondence Analysis
these two fractions was 1000 mg/L, which (CA, Figure 2) to find out if these terms
fulfilled the red wine range and allowed the differentiated the selected fractions. A
fraction to be clearly perceived by the assessors. combination of the most cited attributes and
OENO One 2020, 54, 4, 1059-1075 © 2020 International Viticulture and Enology Society - IVES 1067Maria Alessandra Paissoni et al.
TABLE 3. Triangle test results for the perception of phenolic fraction additions
to the model wine solution.
Concentration ! value (correct answer)
Sample Reference solution
(mg/L) n = 16
Total anthocyanin extract (Nebbiolo, TA) 250 model wine 0.01 (11)a
0.01 (11)a
Total anthocyanin extract (Barbera, TA) 250 model wine
0.01 (11)b
Glucoside fraction (GF) 300 model wine 0.05 (9)a
Glucoside fraction (GF) 400 model wine 0.01 (11)b
Acetylated fraction (AF) 100 model wine 0.01 (11)a
Coumaroylated fraction (CF) 100 model wine 0.05 (10)a
Skin polyphenols (SkTOT) 500 model wine ns (7)a
Seed polyphenols (SdTOT) 500 model wine 0.05 (10)a
Seed polyphenols (SdTOT) 750 model wine 0.001 (12)b
total anthocyanin extract ns (8)a
Total anthocyanin extract (Nebbiolo, TA) 400
(Barbera, TA) ns (4)b
a First session results and b and second session results.
TABLE 4. Frequencies of CATA analysis.
Grouping Frequencies of citation
Descriptor
Group Sub-qualities a Rank % in the group % in total p-valueb
Bitter (amer) Taste 1 46.9 13.3 0.464
Acid (acide) Taste 4 21.9 6.2 0.476
Sweet (sucré) Taste 13 7.8 2.2 0.738
Salty (salé) Taste 3 23.4 6.6 0.045
Hot (brûlant) Mouthfeel heat 4 22.2 6.2 0.651
Dry (asséchant) Mouthfeel drying 12 9.5 2.7 0.037
Tingly (piquant) Mouthfeel irritation 8 15.9 4.4 0.641
Prickly (pointu) Mouthfeel irritation 11 11.1 3.1 0.478
Oily (onctueux) Mouthfeel texture 7 17.5 4.9 0.069
Watery (acqueux) Mouthfeel weight 9 14.3 4.0 0.762
Dense (dense) Mouthfeel weight 12 9.5 2.7 1.000
Emery (rugueux) Astringency sub-qualities surface smoothness 6 24.0 5.3 0.383
Dusty (poussiéreux) Astringency sub-qualities particulate 5 26.0 5.8 0.697
Grainy (granuleux) Astringency sub-qualities particulate 12 12.0 2.7 0.242
Chalky (talc) Astringency sub-qualities particulate 8 20.0 4.4 0.742
Silky (soyeux) Astringency sub-qualities surface smoothness 9 18.0 4.0 0.040
Rich (gras) Complexive astringency 12 12.2 2.7 0.336
Adhesive (adhérant) Complexive astringency dynamic 9 18.4 4.0 0.801
Soft (doux) Complexive astringency complex 8 20.4 4.4 0.475
Mouthcoating (enrobant) Complexive astringency complex 10 16.3 3.5 0.928
Aggressive (agressif) Complexive astringency complex 2 32.7 7.1 0.071
a Sub-qualities grouping taken from Gawel et al. (2000). b p-value according to the Cochran’s Q test for descriptors in
discrimination of samples. Values in bold indicate relevant terms based on Cochran’s Q test (p < 0.1) or rank of citation (1st to 8th
most cited terms).
1068 © 2020 International Viticulture and Enology Society - IVES OENO One 2020, 54, 4, 1059-1075their ability to discriminate samples was taken “mouthcoating” attributes (+ 0.396 and + 0.345
into consideration for further sensory assessment respectively), and negatively correlated with
of grape extracted fractions. “dry” and “grainy” attributes (- 0.995, p = 0.037
and - 0.504 respectively). Nevertheless, these
The three most frequently cited descriptors were attributes were not able to significantly
“bitter” (13.3 %, 1st), “aggressive” (7.1 %, 2nd), discriminate samples even with increased
and “salty” (6.6 %, 3rd) (Table 4). Interestingly, significance criteria (p < 0.1). Moreover, the
“bitter” was often reported, but did not allow the “mouthcoating”, “watery”, “grainy”, and “dry”
samples to be differentiated (p = 0.464). In attributes belong to different groups; i.e.,
contrast, “salty” and “aggressive” were complex (overall astringency), weight
relevantly used for the GF and SdTOT sample (mouthfeel), particulate (astringency sub-
characterisation respectively, and showed better qualities), and drying (mouthfeel) respectively.
sample differentiation (p = 0.045 and p = 0.071, Despite the variability of the group and the low
for “salty” and “aggressive” respectively). These discrimination ability (p > 0.1), the descriptors
descriptors, together with “acid” and “hot” reported in the upper quadrant are linked by a
(6.2 %, 4th) can be explained in part by the model general softer sensation with respect to those
wine solution, since tartaric acid and low pH are located in the lower quadrants of the plot.
in accordance with acidic traits. Additionally, According to the plot description, Sk-TOT is
ethanol has been reported to be perceived as related to harsher sensations, such as “grainy”
bitter and to induce a hot sensation (Vidal et al., and “dry”, whereas SdTOT corresponds to
2004b). Likewise, phenolic compounds have “aggressive” and “emery” attributes.
been reported as bitter markers (Gonzalo-Diago
et al., 2014; Hufnagel and Hofmann, 2008), and Regarding anthocyanin-based fractions, TA and
they therefore are common descriptors for grape GF are in the upper part of the plot, and are
extracts. therefore represented by “watery” and
“mouthcoating” sensations. The glucoside
Terms for astringent sub-qualities accounted for fraction (GF), however, is differentiated by
22.1 % of the total citations, the terms for softer astringency sub-qualities, such as “silky”,
“dusty” and “emery” being the most cited with in contrast to total anthocyanins (TA), which are
5.8 % (5th) and 5.3 % (6th) of the total citation more associated with “emery”. Interestingly,
frequencies. Furthermore, “chalky” and “silky” SkTOT and GF were well differentiated from
were frequently cited (4.4 %, 8th and 4.0%, 9th SdTOT, whereas TA was slightly different from
respectively; Table 4). GF and SkTOT, and more like SdTOT in the
tasted concentrations.
The CA biplot is shown in Figure 2. The two
first dimensions account for 81.0 % of the In terms of both frequency and discrimination
explained variance among samples. Dimension 1 ability, the most cited term, “bitter”, was
(Dim1) contributed 46.3 %, and it was mainly considered relevant enough to be investigated.
described by astringency sub-quality attributes: Astringent sub-qualities such as surface-
“silky” was negatively correlated (-0.805) and smoothness and particulate were also found to
contributed to sample discrimination (p = 0.040), be both highly cited and able to discriminate the
whereas “emery” mainly contributed to the samples. Therefore, they were chosen to train
positive loading (+ 0.394, p > 0.1). In general, assessors in using the scales. For example,
samples on the right side of the plot can be particulate was described as “feelings of
considered to have harsher astringency sub- particulate matter brushing against the surface of
qualities (“emery”), whereas samples plotted on the mouth through the movement of the
the left side evoked softer sensations (“silky”). solution”, thus as “in-mouth” astringency;
This is in accordance with the “aggressive” whereas surface smoothness was defined as
attribute, which characterised the right side of “texture felt on mouth surfaces when the
the axis (p = 0.071), in contrast with “oily” different surfaces came in contact with each
(p = 0.069) and “silky” (p = 0.040), which other”, therefore after expectoration. Reference
characterised the left side. standards and scales were defined, slightly
modifying the scales proposed by Pickering and
On the other hand, Dimension 2 (Dim2) Demiglio (2008), for the evaluation of oral
accounted for 34.7 % of the explained variance, sensations elicited by white wine. Overall
and was positively correlated with “watery” and astringency was chosen for the scales to
OENO One 2020, 54, 4, 1059-1075 © 2020 International Viticulture and Enology Society - IVES 1069Maria Alessandra Paissoni et al.
summarise the intensity of both in-mouth and agreed on the interpretation of these terms. For
post expectoration astringency. irritation, however, the assessors were spread
over the loading plot, which suggests that the
Moreover, given the high citation frequency of
the term “acid” and “hot” (6.2 %, 4th) and also assessors did not interpret this attribute in the
“tingly” and “prickly” (together 7.5 %), the same way. In addition, for the terms involved,
panel discussed and attempted to scale these the ANOVA test for assessors resulted in
sensations and to verbally explain them. In this significant differences (p < 0.05), underlining the
case, the Pickering and Demiglio (2008) differences in the evaluation of these attributes
definition of “tingly” was once again used, and on the scale. Hence, irritation was no longer
the scale was divided into low, moderate and considered in subsequent analyses, confirming
high irritation. that the use of standard references should be
3. DA results preferred to verbal description of terms. ANOVA
also showed that there was a significant
Panel performance was evaluated using a PCA assessors* -sample interaction (p < 0.05) for the
approach (data not shown) to understand the attribute bitterness. Examination of the PCA
consensus in the attributes investigated and
projection indicated that two assessors rated
ANOVA for the effects of assessors, extracts and
replicates and their interactions in order to assess bitterness differently from the rest of the panel.
panel repeatability. Regarding consensus, Accordingly, none of the scores from these two
assessor projections were grouped in the loading assessors were taken into consideration for
plot for overall astringency, particulate, and further analysis. Therefore, the final DA panel
surface smoothness, showing that the panel had consisted of ten assessors.
FIGURE 2. Correspondence Analysis (CA) of descriptors for the selected grape extracts performed on
the citation frequencies.
GF = glucoside anthocyanin fraction; TA = total anthocyanin fraction; SdTOT = seed polyphenol extract; SkTOT = skin
polyphenol extract. Ellipses represent confidence ellipses (p = 0.05).
1070 © 2020 International Viticulture and Enology Society - IVES OENO One 2020, 54, 4, 1059-10753.1. Grape extract sensory characterisation Interestingly, the astringency sub-qualities,
particulate and surface smoothness, differed
The result of the ANOVA test for the extract
among samples, and they agreed with the overall
effect (Figure 3) shows that overall astringency,
perceived astringency results. In fact, SkTOT
particulate, and surface smoothness were
was also perceived as the highest on the scale of
significantly different among extracts (p = 0.003,
p = 0.001, and p = 0.002, respectively), but not sub-qualities, corresponding to anchored
bitterness (p > 0.05). Likewise, Brossaud et al. reference, “fine emery”, for surface smoothness,
(2001) did not find significant differences and close to “grainy” for particulate attribute.
between total anthocyanin extract and tannins This could agree with higher mean
from seeds and skins added to white wine, polymerisation (mDP) of skin tannins, which
whereas differences were reported in citric acid increases both the overall astringency and the
solutions, in which seed extracts were puckery sensation in the mouth (Ma et al.,
significantly higher than skin and anthocyanin 2014). TA, GF, and CF fractions did not differ
extracts. Our different results can be imputed to from polyphenol extracts in particulate attribute,
differences in polyphenol extracts. In fact, although they were rated lower. Total
different content and composition of polyphenols anthocyanins added to white juice have
in skin and seed extracts can vary depending on previously been reported to result in a wine with
the grape features and the purification steps an increased “fine grain” attribute (Oberholster
applied. Alcohol can also enhance bitterness et al., 2009). Our results seem to agree with the
(Mattes and DiMeglio, 2001), which may CATA test, since TA rating corresponds to
conceal individual differences between fractions. “dusty” and “sandy” on the scale, referring to
the moderate particulate sensations in the mouth.
In contrast, overall astringency differed among
The acetylated fraction (AF) was rated the
the fractions: SkTOT was the highest in
lowest and was significantly different from
astringency, but not significantly different from
SdTOT and TA. Anthocyanin fractions (GF, AF, SkTOT extract, evoking a “chalky” sensation
and CF) were rated lower in overall astringency, previously reported in literature in an
significantly less than SkTOT, but not different anthocyanin sensory analysis (Vidal et al.,
from SdTOT and TA. In previous research, 2004a; Vidal et al., 2004b). Surface smoothness
anthocyanin astringency ratings have been found of AF and CF was significantly lower than that
to be lower than seed or skin extracts, and of skin polyphenol extracts (p = 0.002).
differences have been found depending on the According to the scale, AF and CF were closer
media in which they were tasted; i.e., model to a “silky” sensation and TA and GF correspond
wine at different ethanol level, citric acid to a “velvety” one, whereas SkTOT
solution, and white wine (Brossaud et al., 2001; corresponded to “fine emery”. Interestingly, a
Vidal et al., 2004b). Regarding GF, anthocyanin previous study (Ferrer-Gallego et al., 2015)
glucoside has been reported to have moderate reported an increase in the descriptor “velvety”
astringency (Ferrer-Gallego et al., 2015). in wine with added anthocyanin glucoside
FIGURE 3. Descriptive analysis (DA) of grape extracts.
SdTOT = seed polyphenol extract; SkTOT = skin polyphenol extract; TA = total anthocyanin extract; GF = glucoside
anthocyanin fraction; AF = acetylated anthocyanin fraction; CF = p-coumaroylated anthocyanin fraction. Data are expressed as
means of assessor ratings and error bars are calculated as s/(n)1/2, where s is standard deviation and n is the number of assessors.
p-values are reported according to ANOVA, and different Latin letters indicate significant differences according to the HSD
Tukey test (p < 0.05).
OENO One 2020, 54, 4, 1059-1075 © 2020 International Viticulture and Enology Society - IVES 1071Maria Alessandra Paissoni et al.
(400 mg/L), which is in line with the results of with added GF. Conversely, a significant
present study. increase was found when GF was added to
SdTOT for the particulate and surface
3.2. Mixed fractions sensory analysis smoothness sub-qualities (p = 0.010 and
Anthocyanin fractions tasted alone were p = 0.030 respectively), as well as for overall
perceived as contributing to bitterness, overall astringency (p = 0.009). Depending on the
astringency and its sub-qualities, surface polyphenol fraction, surface smoothness
smoothness and particulate to different extents, descriptors showed an inverse trend when
depending on their compositions and their anthocyanins were added, decreasing when
concentrations. Although these contributions had glucoside anthocyanins were added to skin
lower ratings with respect to other phenol polyphenols (p < 0.05) and increasing when they
fractions, it is interesting to determine whether were added to seed polyphenols (p < 0.05).
the sensory perceptions of polyphenol extracts Recently, Soares et al. (2019) showed that the
are influenced by the addition of total mixture of epicatechin and malvidin-3-glucoside
anthocyanin extracts (TA) and their derived increased the interaction with salivary proline-
fractions GF and CF (Table 5). In previous rich proteins when compared to epicatechin
research, total anthocyanin extracts were found alone, which may result in an increased
to increase overall astringency when added to perceived astringency, and thus justify the results
seed or skin extracts (Brossaud et al., 2001; obtained here for SdTOT. Nevertheless, this
Vidal et al., 2004b), although this increase increase could be hidden in the skin polyphenol
depends on the concentration of proantho- extract, because of the lower amount of
cyanidins (Vidal et al., 2004b). Under our monomeric flavanols usually reported in skin
experimental conditions, when anthocyanin with respect to seeds. The condensed tannins of
fractions were added to the SkTOT extract, no skins are conversely known to be highly
significant differences (p > 0.05) were found for polymerised, and increased polymerisation is
any of the investigated attributes, except for positively correlated with perceived astringency
surface smoothness, which was rated (Ma et al., 2014). In fact, condensed tannins are
significantly lower (p = 0.043) in the sample the first drivers of in-mouth related sensations,
TABLE 5. Descriptive Analysis (DA) of mixed extracts.
Mixed extracts Bitterness Particulate Surface smoothness Overall astringency
SkTOT 3.6 ± 0.5 4.4 ± 0.5 4.6 ± 0.4 a 4.1 ± 0.5
SkTOT + TA 3.7 ± 0.5 4.3 ± 0.6 4.1 ± 0.5 ab 3.9 ± 0.5
SkTOT + GF 5.0 ± 0.5 5.3 ± 0.4 3.8 ± 0.3 b 5.4 ± 0.4
SkTOT + CF 4.3 ± 0.4 4.6 ± 0.5 4.0 ± 0.6 ab 4.0 ± 0.7
Sign ns ns * ns
p value 0.201 0.441 0.043 0.077
SdTOT 4.2 ± 0.5 3.5 ± 0.5 b 3.6 ± 0.6 b 3.0 ± 0.4 b
SdTOT + TA 5.2 ± 0.4 4.0 ± 0.5 ab 4.0 ± 0.4 ab 3.6 ± 0.3 ab
SdTOT + GF 3.8 ± 0.4 5.3 ± 0.5 a 5.1 ± 0.4 a 4.9 ± 0.5 a
SdTOT + CF 4.5 ± 0.6 3.3 ± 0.4 b 4.1 ± 0.4 ab 3.4 ± 0.4 b
Sign ns * * **
p value 0.177 0.010 0.030 0.009
SdTOT = seed polyphenol extract; SkTOT = skin polyphenol extract; TA = total anthocyanin fraction; GF = glucoside
anthocyanin fraction; CF = p-coumaroylated anthocyanin fraction. Data are expressed as means of assessors rating and error bars
are calculated as s/(n)1/2, where s is standard deviation and n is the number of assessors. Sign: *, **, and ns indicate significance
at p < 0.05, 0.01, and not significant respectively, for the differences among samples according to ANOVA. Different Latin
letters indicate significant differences according to HSD Tukey test (p < 0.05).
1072 © 2020 International Viticulture and Enology Society - IVES OENO One 2020, 54, 4, 1059-1075particularly mouthfeel (Ferrero-del-Teso et al., Chira, K., Jourdes, M., & Teissedre, P. L. (2012).
2020). However, these results confirm the Cabernet-Sauvignon red wine astringency quality
involvement - even if to a different extent - of control by tannin characterization and polymerization
other relevant groups of polyphenols (such as during storage. European Food Research and
anthocyanins) in the final oro-sensory perception Technology, 234(2), 253-261. doi.org/10.1007/
s00217-011-1627-1
of wine, as has already been suggested by
Ferrero-del-Teso et al. (2020). Ferrer-Gallego, R., Soares, S., Mateus, N., Rivas-
Gonzalo, J., Escribano-Bailó n , M. T., &
CONCLUSIONS Freitas, V. D. (2015). New anthocyanin–human
salivary protein complexes. Langmuir, 31(30), 8392-
The role of anthocyanins in the in-mouth sensory 8401. doi.org/10.1021/acs.langmuir.5b01122
properties of wine has been evaluated in Ferrero-del-Teso, S., Suárez, A., Jeffery, D. W.,
previous studies with contradictory results. The Ferreira, V., Fernández-Zurbano, P., & Sáenz-
aim of the present study was to adapt common Navajas, M. P. (2020). Sensory variability associated
methodology for sensory analysis to the with anthocyanic and tannic fractions isolated from
investigation of the contribution of anthocyanins red wines. Food Research International, 109340.
alone and in more complex solutions, such as doi.org/10.1016/j.foodres.2020.109340
mixed polyphenol extracts. The results showed Fontoin, H., Saucier, C., Teissedre, P. L., &
that anthocyanins extracted from grape skins are Glories, Y. (2008). Effect of pH, ethanol and acidity
involved in the “in-mouth” perception of model on astringency and bitterness of grape seed tannin
wine solutions, although their contribution is less oligomers in model wine solution. Food Quality and
relevant than other polyphenolic groups, such as Preference, 19(3), 286-291. doi.org/10.1016/
j.foodqual.2007.08.004
condensed tannins. At the wine level, glucoside
anthocyanins were related to sensations of Fukui, M., Yokotsuka, K., Ishii, R., O’Mahony, M.,
“velvety” sub-qualities, whereas when mixed & Rousseau, B. (2002). Investigation of potential
with the other acylation groups (total taste reduction of catechin and grape seed dimeric
phenols in water by wine proteins. LWT-Food
anthocyanin extract) they showed higher overall
Science and Technology, 35(4), 355-361. doi.org/
astringency and harsher sub-qualities than when 10.1006/fstl.2001.0887
alone. In particular, glucoside anthocyanins led
to a decrease in overall astringency in the Gawel, R. (1997). The use of language by trained and
untrained experienced wine tasters. Journal of
presence of skin polyphenols, whereas they Sensory Studies, 12(4), 267-284. doi.org/10.1111/
seemed to enhance the overall astringency and j.1745-459X.1997.tb00067.x
related sub-qualities of seed polyphenols. This
Gawel, R., Oberholster, A., & Francis, I. L. (2000). A
behaviour could be relevant when explaining the
‘Mouth-feel Wheel’: terminology for communicating
final in-mouth perceptions of wine, and thus the mouth-feel characteristics of red wine. Australian
further studies would be required on the different Journal of Grape and Wine Research, 6(3), 203-207.
interactions of fractions with a suppression or doi.org/10.1111/j.1755-0238.2000.tb00180.x
enhancing effects of sensory attributes. Gibbins, H. L., & Carpenter, G. H. (2013).
Acknowledgements: M.A.P. would like to thank Alternative mechanisms of astringency - what is the
role of saliva? Journal of Texture Studies, 44(5), 364-
Università Italo-Francese (Torino, Italy) for the
375. doi.org/10.1111/jtxs.12022
Vinci Grant 2017 supporting co-jointed PhD.
Glabasnia, A., & Hofmann, T. (2006). Sensory-
REFERENCES directed identification of taste-active ellagitannins in
American (Quercus alba L.) and European oak wood
Brossaud, F., Cheynier, V., & Noble, A. C. (2001). (Quercus robur L.) and quantitative analysis in
Bitterness and astringency of grape and wine bourbon whiskey and oak-matured red wines. Journal
polyphenols. Australian Journal of grape and wine of Agricultural and Food Chemistry, 54(9), 3380-
research, 7(1), 33-39. doi.org/10.1111/j.1755- 3390. doi.org/10.1021/jf052617b
0238.2001.tb00191.x
González-Centeno, M. R., Jourdes, M., Femenia, A.,
Campo, E., Do, B.V., Ferreira, V., Valentin, D. Simal, S., Rosselló, C., & Teissedre, P. L. (2012).
(2008). Aroma properties of young Spanish Proanthocyanidin composition and antioxidant
monovarietal white wines: A study using sorting task, potential of the stem winemaking byproducts from 10
list of terms and frequency of citation. Australian different grape varieties (Vitis vinifera L.). Journal of
Journal of Grape and Wine Research, 14 (2008), pp. Agricultural and Food Chemistry, 60(48), 11850-
104-115. doi.org/10.1111/j.1755-0238.2008.00010.x 11858. doi.org/10.1021/jf303047k
OENO One 2020, 54, 4, 1059-1075 © 2020 International Viticulture and Enology Society - IVES 1073You can also read