Long-Term Pollen Monitoring in the Benelux: Evaluation of Allergenic Pollen Levels and Temporal Variations of Pollen Seasons - Sciensano
←
→
Page content transcription
If your browser does not render page correctly, please read the page content below
ORIGINAL RESEARCH
                                                                                                                                                  published: 08 July 2021
                                                                                                                                         doi: 10.3389/falgy.2021.676176

                                             Long-Term Pollen Monitoring in the
                                             Benelux: Evaluation of Allergenic
                                             Pollen Levels and Temporal
                                             Variations of Pollen Seasons
                                             Letty A. de Weger 1,2*† , Nicolas Bruffaerts 3† , Mieke M. J. F. Koenders 4 ,
                                             Willem W. Verstraeten 5 , Andy W. Delcloo 5 , Pierre Hentges 6 and François Hentges 7
                                             1
                                              Department of Pulmonology, Leiden University Medical Center, Leiden, Netherlands, 2 Department of Public Health and
                                             Primary Care, National eHealth Living Lab, Leiden University Medical Center, Leiden, Netherlands, 3 Mycology and
                                             Aerobiology, Sciensano, Brussels, Belgium, 4 Clinical Chemistry, Elkerliek Hospital, Helmond, Netherlands, 5 Dispersion and
                                             Atmospheric Composition, Royal Meteorological Institute of Belgium, Brussels, Belgium, 6 Aerobiology Data Analysis
                                             Consulting, Centre Hospitalier de Luxembourg, Luxembourg, Luxembourg, 7 Unit of Immunology-Allergology, Centre
                                             Hospitalier de Luxembourg, Luxembourg, Luxembourg

                            Edited by:       Airborne pollen is a major cause of allergic rhinitis, affecting between 10 and 30% of the
                        Carmen Galan,
                                             population in Belgium, the Netherlands, and Luxembourg (Benelux). Allergenic pollen is
          University of Cordoba, Spain
                                             produced by wind pollinating plants and released in relatively low to massive amounts.
                       Reviewed by:
                          Jesús Rojo,        Current climate changes, in combination with increasing urbanization, are likely to affect
           Complutense University of         the presence of airborne allergenic pollen with respect to exposure intensity, timing
                        Madrid, Spain
       Athanasios Charalampopoulos,          as well as duration. Detailed analysis of long-term temporal trends at supranational
                Aristotle University of      scale may provide more comprehensive insight into these phenomena. To this end, the
                 Thessaloniki, Greece
                                             Spearman correlation was used to statistically compare the temporal trends in airborne
                     *Correspondence:
                                             pollen concentration monitored at the aerobiological stations which gathered the longest
                       Letty A. de Weger
                  l.a.de_weger@lumc.nl       time-series (30–44 years) in the Benelux with a focus on the allergenic pollen taxa: Alnus,
     † These                                 Corylus, Betula, Fraxinus, Quercus, Platanus, Poaceae, and Artemisia. Most arboreal
               authors have contributed
                    equally to this work     species showed an overall trend toward an increase in the annual pollen integral and
                                             peak values and an overall trend toward an earlier start and end of the pollen season,
                   Specialty section:
                                             which for Betula resulted in a significant decrease in season length. For the herbaceous
         This article was submitted to
      Environmental and Occupational         species (Poaceae and Artemisia), the annual pollen integral and peak values showed a
                         Determinants,       decreasing trend. The season timing of Poaceae showed a trend toward earlier starts and
               a section of the journal
                     Frontiers in Allergy
                                             longer seasons in all locations. In all, these results show that temporal variations in pollen
            Received: 04 March 2021
                                             levels almost always follow a common trend in the Benelux, suggesting a similar force
             Accepted: 03 June 2021          of climate change-driven factors, especially for Betula where a clear positive correlation
             Published: 08 July 2021
                                             was found between changes in temperature and pollen release over time. However, some
                             Citation:
                                             trends were more local-specific indicating the influence of other environmental factors,
           de Weger LA, Bruffaerts N,
   Koenders MMJF, Verstraeten WW,            e.g., the increasing urbanization in the surroundings of these monitoring locations. The
          Delcloo AW, Hentges P and          dynamics in the observed trends can impact allergic patients by increasing the severity
  Hentges F (2021) Long-Term Pollen
 Monitoring in the Benelux: Evaluation
                                             of symptoms, upsetting the habit of timing of the season, complicating diagnosis due
       of Allergenic Pollen Levels and       to overlapping pollen seasons and the emergence of new symptoms due allergens that
         Temporal Variations of Pollen
                                             were weak at first.
   Seasons. Front. Allergy 2:676176.
     doi: 10.3389/falgy.2021.676176          Keywords: pollen, seasonal trends, allergy, climate change, Benelux

Frontiers in Allergy | www.frontiersin.org                                          1                                               July 2021 | Volume 2 | Article 676176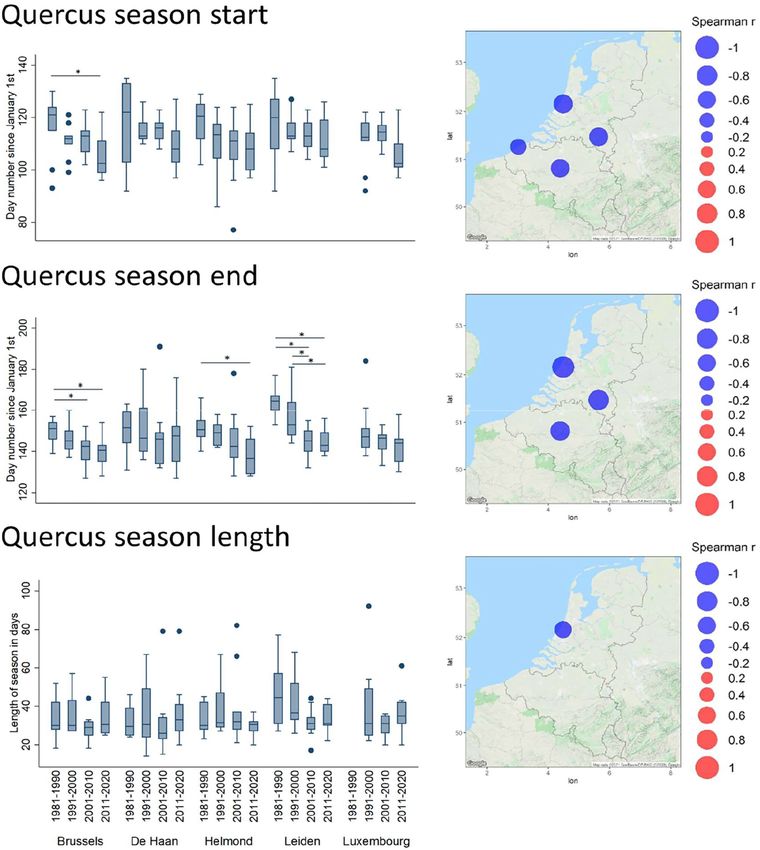
de Weger et al.                                                                                            Long-Term Pollen Monitoring in the Benelux

INTRODUCTION                                                               also contains a smooth gradient of biogeographical regions (25)
                                                                           from Atlantic in Netherlands and North Belgium to continental
It is widely recognized that the prevalence of respiratory allergies       in South-East Belgium and Luxembourg, which are reported
such as asthma and allergic rhinitis is globally increasing,               to be sensitive to the variations in climate (26). Within this
especially in the industrialized world (1, 2). For Belgium, the            temperate climate region, the average temperature has increased
Netherlands and Luxembourg (whose usual acronym is Benelux)                ∼2◦ C since the beginning of the 20th century. The annual rainfall
the prevalence of asthma varies between 10 and 15% of the                  has increased due to more winter precipitation, which contrasts
population (3) and for allergic rhinitis it is estimated to be             with a decrease in summertime precipitation (27, 28). Five pollen
10–30% (4–6). The increase in prevalence of these diseases                 monitoring stations in this region are among the pioneer ones
may be related to improved hygiene, increased antibiotic use               worldwide, so far collecting long time series of airborne pollen
and vaccination, and changes in lifestyle, dietary habit, and air          concentration data which are valuable for studying potential
pollution (7). In addition, the increase in amount of airborne             trends. In this study, we perform a trend analysis of pollen
allergenic pollen and prolonged pollen seasons caused by climate           seasons over 39–44 years at two stations in Belgium and two
change and/or by changes in land use may also contribute (8, 9).           stations in the Netherlands, and over 30 years at one station in
    According to the Intergovernmental Panel on Climate Change             Luxembourg. The annual pollen integrals, the peak values in daily
(IPCC) the human influence on the climate system is clear (10),            concentration and the timing of pollen seasons observed in the
warming of the climate system is unmistakable and globally                 past decades are analyzed for a selection of taxa that are clinically
average temperature has been increasing (11). As an example, the           considered as moderately relevant (ash, plane, oak, and mugwort)
World Meteorological Organization (WMO) reported that 2020                 to highly relevant (hazel, alder, birch, and grasses) in regard to
was 1.2 ± 0.1◦ C warmer than the pre-industrial baseline (1850–            pollen induced respiratory allergies in this region.
1900) (12). These long-term changes in the climate have multiple
impacts on the environment and on health.
    Pollen emitted by wind pollinating plants is one of the                MATERIALS AND METHODS
most relevant triggers of respiratory allergies, and therefore
monitoring of pollen is relevant for individuals with respiratory          Study Sites
allergies. So far, pollen has been monitored for more than five            The five monitoring sites are located in the Northwestern part
decades in Europe and 25 years ago the first studies appeared              of Europe, bordering the North Sea in the Benelux countries
noticing changes in airborne pollen concentrations and shifts              (Figure 1). In the center of Belgium, the monitoring site in
in the pollen seasons (13–15), Ziello et al. (16) showed in                Brussels Capital Region (16,138 ha, 1,218,255 inhabitants in 2020,
2012 an increase in the annual pollen count for many pollen                while ∼960,000 in 2000) is located within a functional urban
taxa in Europe, without a clear relation to temperature change.            area that extends to a buffer zone of 30 km around the site (29).
Since the increase was more pronounced in urban areas than                 The availability of open land surface in this region has been
in rural sites, it was suggested that the increase in pollen could         drastically reduced for three decades [– 56% agricultural land,
be due to a possible anthropogenic rise of atmospheric CO2 .               – 45% meadow, and – 40% wasteland (Belgian Federal Statistics
Several recent studies showed significant increasing airborne              2017)]. While in dominantly rural Belgian areas the allergenic
pollen concentration trends in relation to the changing climate            tree species distribution is mainly driven by soil characteristics,
as well as in shifts in the timing of the pollen seasons in                in dominantly urban areas it appears to be driven by more
Northern (13, 17, 18) and in southern Europe (19–21). The                  environmental covariates explaining urban heterogeneity (29). In
results often differ per region and pollen type. Most studies show         particular, inventory datasets of urban green spaces in Brussels
an overall trend of increasing pollen concentrations, in particular        show that among the 10 most frequent tree species, a series of
for tree species (13, 20), although some other studies present             them present allergenic properties, i.e., ashes, hornbeams, horse
contrasting results (22). Regarding the season timing, shifts also         chestnuts, beeches, planes, limes, oaks and birches (30). The
appear to vary depending on the region and the analyzed species,           sampler is located on the rooftop of a 15 m high building at the
which is illustrated by some examples. Several studies report an           Sciensano site in the municipality of Elsene.
advancement of the pollen season of tree species like hazel, birch,            The monitoring site located in the coastal Belgian
oak and pine (17, 18, 23), or of herbaceous plants like grasses and        municipality of De Haan (4,614 ha, 12,700 inhabitants in
nettles (13). A Swedish study found a season-shift to later end            2020) is surrounded by mixed rural and urban landscapes (29).
dates for grasses and mugwort (18), while in Belgium both the              The airborne pollen levels are usually lower on the Belgian
start and the end of the grass pollen season have shifted to an            coast than inland, which makes it a recommended location for
earlier date (17).                                                         allergic sufferers during the high pollen season. The sampler
    Benelux, which is located in Northwestern Europe, usually              is located on the rooftop (10 m above ground level) of the
refers in many domains to a supranational territory, although              Zeepreventorium building.
it started from a simple economic union. According to the                      Helmond is located in the south center of the Netherlands
Köppen–Geiger climate classification map for Europe (24), the              enclosed by populated towns and suburbs. Helmond has 92,400
region has a temperate climate, i.e., no dry season and warm               inhabitants and the township spans 5,475 ha. The city is densely
summers, although relatively colder in Luxembourg which lies               populated with 1,759 households per square kilometer. Since
between 200 and 500 m above sea level. Consequently, Benelux               1996, the population has grown with 23%. To accommodate this

Frontiers in Allergy | www.frontiersin.org                             2                                         July 2021 | Volume 2 | Article 676176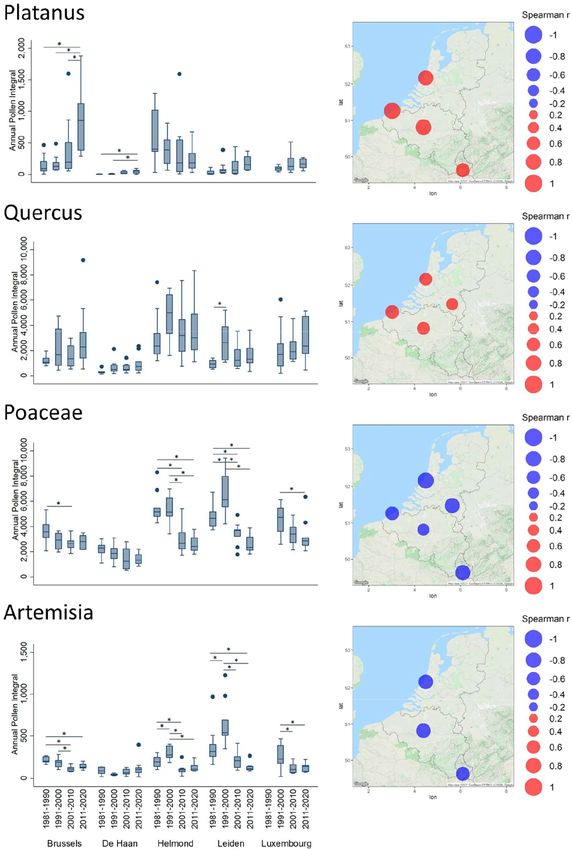
de Weger et al.                                                                                               Long-Term Pollen Monitoring in the Benelux

                                                                               being made up by hornbeam, birch, ash, maple, alder, hazel,
                                                                               willow and poplar, while planes mainly planted on line roads.
                                                                               The sampler is located on the roof of the Centre Hospitalier
                                                                               de Luxembourg about 20 m above ground. The hospital itself is
                                                                               situated in the Western outskirts of the city.

                                                                               Pollen Monitoring and Weather Parameters
                                                                               At all sites, airborne pollen is sampled by using a Hirst-type 7-
                                                                               day volumetric spore trap (32) (Burkard Manufacturing Co., Ltd.,
                                                                               UK) placed on rooftops at 10–20 m height above ground level.
                                                                               The methodological guidelines requirements of the European
                                                                               Aerobiology Society (EAS) were followed to the best ability (33),
                                                                               apart from the average daily pollen concentrations (pollen/m3 )
                                                                               which were calculated after counting two (Brussels, De Haan,
                                                                               and Luxembourg) or three (Leiden, Helmond) longitudinal lines
                                                                               of daily slides. The sampling and the manual identification
                                                                               and counting of pollen by microscopy has been carried out by
                                                                               independent teams in all the stations. Based on abundance and
                                                                               allergenic potential, the following eight taxa were chosen for
                                                                               further analysis: alder (Alnus spp.), hazel (Corylus spp.), birch
                                                                               (Betula spp.), ash, (Fraxinus spp.), oak (Quercus spp.), plane
                                                                               (Platanus spp.), grasses (Poaceae), and mugwort (Artemisia spp.).
 FIGURE 1 | Map of the selected monitoring stations. Corresponding city            Weather        parameters      related    to    temperature
 name and altitude above sea level (a.s.l.) expressed in meters.               (mean/minimum/maximum of daily temperatures in ◦ C;
                                                                               net solar radiation in J/m2 or converted to Watt/m² per day)
                                                                               were obtained from weather stations close to the traps: Ukkel
new population, houses were built from this year on, resulting                 for Brussels, Zeebrugge for De Haan, Schiphol for Leiden;
that ∼20% of the houses in Helmond date from after 2000. In                    Eindhoven for Helmond. For Luxembourg, weather data were
between, the urbanized areas there are areas of farmland, forest               obtained from the Copernicus ERA5 dataset for map coordinates
and heather. The streets in the city are lined with oak, linden,               49.618999N, 6.1E, corresponding to the location closest to the
alder, birch, maple horse chestnut, and poplar. The sampler is                 pollen sampler.
located on the roof of the hospital (∼20 m above ground level).
In 2000, a large stretch of wasteland close to the hospital was used           Data Analysis
for building a residential area. Until today, this residential area            Since for most sites the data were recorded from January
has still been expanding. More to the north in the Netherlands,                1st to September 30th, the time series analysis was generally
Leiden (1 m above sea level) is located at 20 km distance from the             encompassing this monitoring period. Any major data gap of
coast. The sampler is located on the roof of the hospital (∼20 m               more than 5 days during the usual window of a specific pollen
above ground level) in the middle of the urban area. Leiden has                season, involved the omission of the related yearly dataset for a
125,000 inhabitants and the township covers an area of 2,327 ha.               given taxon. Platanus was not registered in Leiden before 1982
Although the city is situated in the most populated part of the                and in Helmond not before 1986. Due to too low amounts of
Netherlands, to the east the surroundings consist of polderlands.              Platanus pollen in De Haan in the early decades the timing of
The streets in the city are lined with alder, birch, ash, plane,               the pollen season was not analyzed for this pollen type at De
willow, maple, horse chestnut, oak, or poplar (31). From 1991                  Haan. The overview of the years used for this study is given in
to 2000 close to the sampler a stretch of waste land was present               Supplementary Table 1.
where old hospital buildings had been demolished. Since 2000                      The total taxon-specific airborne pollen accumulated during
this waste land has been rebuilt with a large research- and an                 a yearly monitoring period was expressed as Annual Pollen
education building which both were finished in 2006.                           Integral (API) (32). The peak value corresponds to the maximum
    Luxembourg City is the capital of the Grand Duchy                          daily pollen concentration measured during a yearly monitoring
Luxembourg, and is the highest location above sea level of the five            period. The peak day is the day on which this maximum was
sites. It lies in the southern part of a large plateau of early Jurassic       reached, expressed as day number since January 1st. Since a “gold
sandstone formation. Luxembourg City has 125,000 inhabitants                   standard” for season start/end dates is lacking we chose two
with a population increase of 30% over the last 30 years. It covers            methods based on the percentage of the API, as these methods
an area of 51.46 km2 . While 20% of the territory of Luxembourg                may be beneficial when API values are low (34). Individual pollen
city is covered by woodland, this even increases to 33% in the                 taxa at some of the sites showed low API values (e.g., Artemisia in
surrounding region where the rest of the unbuilt land is mainly                Luxembourg, Corylus in De Haan). For the start/end dates of the
covered by grassland. Two third of the trees are deciduous.                    pollen season, two definitions were used: (i) the day number since
Among them beech and oak are largely predominant the rest                      January 1st upon which the accumulated sum of daily pollen/m3

Frontiers in Allergy | www.frontiersin.org                                 3                                        July 2021 | Volume 2 | Article 676176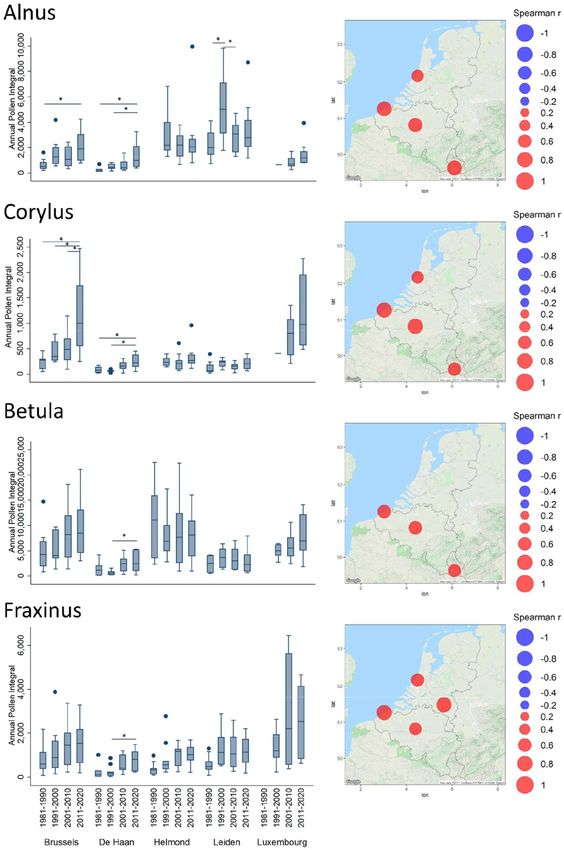
de Weger et al.                                                                                          Long-Term Pollen Monitoring in the Benelux

reached, respectively 1 and 99% of the API, or (ii) respectively 5          Regarding Betula pollen, it is interesting to see that lower
and 95%. The length of the season was calculated by subtracting          API values were observed on the Belgian and Dutch coasts
the start day from the end day of the season.                            (De Haan and Leiden). The Spearman correlation coefficients
    Since most data were not normally distributed according              (Supplementary Table 2) show significant increasing trends in
to the Shapiro–Wilk test, trends were analyzed using the non-            airborne birch pollen levels in Belgium and Luxembourg. In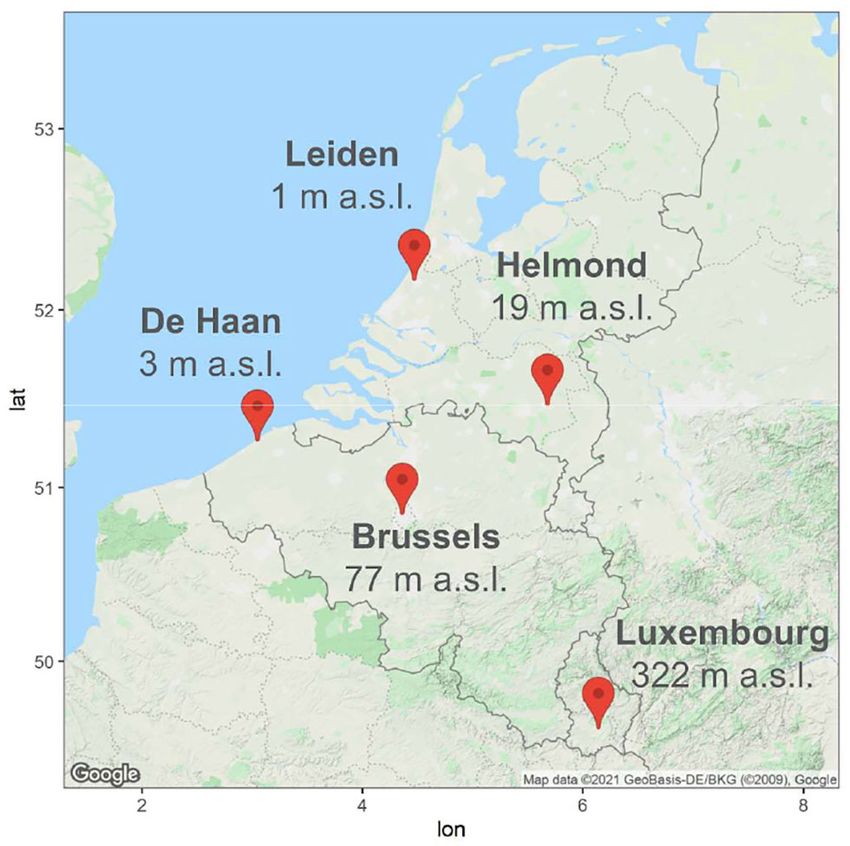
de Weger et al.                                                                                                                 Long-Term Pollen Monitoring in the Benelux

 FIGURE 2 | Trends of Annual Pollen Integrals (API) for Alnus, Corylus, Betula, and Fraxinus. Spearman correlation coefficient (Rho) values between API and years are
 plotted in bubble maps at the location of the monitoring stations, from negative (in blue) to positive (in red). The bubble size relates to the magnitude of the Rho value.
                                                                                                                                                                 (Continued)

Frontiers in Allergy | www.frontiersin.org                                           5                                                 July 2021 | Volume 2 | Article 676176
de Weger et al. Long-Term Pollen Monitoring in the Benelux
FIGURE 2 | Non-significant values are not shown on the maps. API values, averaged per decade (1981–1990, 1991–2000, 2001–2010, and 2011–2020), are
depicted in boxplots. The upper and lower limits of the boxplot are the 75 (Q3) and 25 (Q1) % percentile. The median is shown as a line in the box. The whiskers of a
boxplot extend to values known as adjacent values. These are the values in the data that are furthest away from the median on either side of the box but are still within
a distance of 1.5 times the interquartile range [=1.5* (Q3–Q1)]. Values outside the adjacent values are plotted as separate points. The horizontal lines above the
boxplots indicate significant differences (one-way ANOVA) between the decades; *p < 0.05. Absence of the horizontal lines above box plots indicates differences
among those decades are non-significant.
season start is not coupled to an earlier seasonal end, which has are already well-established in this Northern region. Some recent
a tendency to be later in Helmond. Therefore, the resulting trend studies from Central Europe (34, 36) also showed increases in
in grass pollen season length has clearly tended to increase in all pollen load and advances in the start of the season for Betulaceae
stations, as shown by significantly positive Spearman correlation species, which seem to be driven by climate change. Another,
values in all stations and also by the significant decadal changes multi-site study performed in the Northern hemisphere (35)
in length for all stations except Leiden (Supplementary Table 2 showed that the impact of temperature on the increase in pollen
and Figure 5). concentrations, in terms of intensity and duration, appears to be
Besides, it is interesting to observe a series of changes for global and independent of latitude. Our results are in line with
specific timing parameters of some taxa. For instance, the pollen these findings.
season of Corylus, which is already among the earliest of the The analysis of the Betula pollen change rate and the
year, has tended to start even earlier over the decades. This corresponding change rate in temperature and radiation showed
is shown by significantly negative correlation values between significantly positive correlation at three of the five sites
season start dates (1% API) and years, in all stations except (Table 1). The Betula pollen season is relatively short consisting
in Luxembourg (Supplementary Table 2). The same significant mostly of one or two major peaks and the birch trees typically
trend is observed for the start of Fraxinus pollen season, which flower during late March and April, a period which shows the
has also progressively started earlier in the year, i.e., in Brussels, highest positive changes in the Sen slopes of temperature and
De Haan, and Helmond. Finally, significantly negative trends radiation over decades at these study sites (data not shown).
are observed in all stations regarding the end of the Betula Considering temperature changes it need to be noticed that the
pollen season. study sites are located in urban environments and may also be
The statistical association between the temporal pollen and influenced by urban heat island effects (16).
weather trends measured in all the Benelux stations—which is an The lack of statistically significant associations does not
indication of climate change effects on pollen releases—suggests exclude the possibility that additional weather variables
a substantial contribution of the increasing temperature and/or contribute to the observed changes, only that their effect is below
radiation on the increasing amounts of pollen emitted by birch the sensitivity of our analysis. For instance, precipitation can
trees during the spring (Table 1). The changes we observe over have opposing effects, reducing pollen release in the short-term
time for the Alnus season (flowering in winter) and Poaceae through wet deposition, while potentially increasing pollen
season (flowering in summer) were more complex than those of production as a longer-term effect due to its impact on plant
the Betula season, both temporally (different stages of the season water availability. Such complexity makes the detection of an
are altered in different locations) and geographically (significant effect more difficult. For other taxa such as Poaceae and Alnus,
associations with some weather variables in some locations but the analysis of association was inconclusive in that we did not
not others). The analysis of the association between Alnus, or identify a uniform or generalizable pattern in the five locations.
Poaceae pollen and weather trends was thus inconclusive in the It might be hampered due to the longer flowering periods and
sense that we did not observe a uniform or generalizable pattern. the existence of multiple successive flowering (due to early and
late flowering species). And particularly for grasses, their long
DISCUSSION pollen season covers very different meteorological patterns from
late spring to summer. The relationship between weather trends
The results show that airborne pollen concentrations are subject and pollen trends in the context of climate change is complex
to complex dynamics mainly depending on the type of pollen and warrants further study. Furthered, it is assumed that climate
and to a relatively lesser extent on the location. Indeed, distanced change indirectly impacts airborne pollen concentrations by
by a maximum of 300 km (from Leiden to Luxembourg City), disrupting their production cycle (also called mast seeding cycle),
we observe similar trends in API, season start, end and length resulting in an increase in the frequency of pollen-rich years,
both upward and downward, for all aerobiological stations in coupled with an average increase in seasonal amounts (37, 38).
the Benelux, which is in line with previous findings (16, 35). It should also be noted that the trend toward an increase in
Given the biogeographic region gradient from NW to SE, one the intensity of the Fraxinus season in Luxembourg is masked
might have expected more latitude dependent discrepancies. (non-significant correlation coefficient) because of this high
Certainly, some differences are noticeable, such as the slightly variance, showing the importance of analyzing trends using
less pronounced trend of increase in intensity for the Betulaceae several complementary methods.
tree family in the North of the Benelux. But this is probably In addition, as a more general reminder, if we aim to increase
partly due to the fact that some species such as alder and birch the quality of such trend analyses in the future, it is essential
Frontiers in Allergy | www.frontiersin.org 6 July 2021 | Volume 2 | Article 676176de Weger et al. Long-Term Pollen Monitoring in the Benelux FIGURE 3 | Trends of Annual Pollen Integrals (API) for Platanus, Quercus, Poaceae, and Artemisia. For further details see, legend of Figure 2. Frontiers in Allergy | www.frontiersin.org 7 July 2021 | Volume 2 | Article 676176
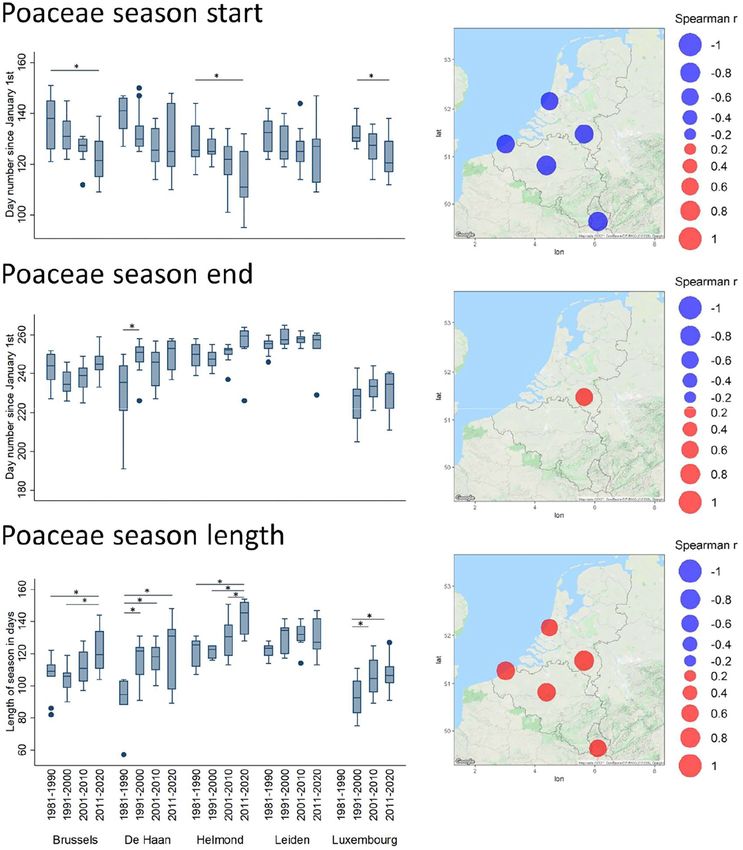
de Weger et al.                                                                                                               Long-Term Pollen Monitoring in the Benelux

 FIGURE 4 | Trends of timing shifts in pollen seasons for Quercus. Spearman correlation coefficient (Rho) values between the day of the year for the season start/end
 and years, and between season length and years, are plotted in bubble maps at the location of the monitoring stations, from negative (in blue) to positive (in red). The
 bubble size relates to the magnitude of the Rho value. Non-significant values are not shown on the maps. Timing parameters, averaged per decade (1981–1990,
 1991–2000, 2001–2010, and 2011–2020), are depicted in boxplots. For further details, see legend of Figure 2.

Frontiers in Allergy | www.frontiersin.org                                          8                                                July 2021 | Volume 2 | Article 676176
de Weger et al.                                                                                                        Long-Term Pollen Monitoring in the Benelux

 FIGURE 5 | Trends of timing shifts in pollen seasons for Poaceae. For further details see, legend of Figure 4.

to guarantee the continuity of monitoring over the long term.                          new trends that were previously undetectable. For example, the
Indeed, statistical tests will in principle be more efficient in                       significantly earlier start of the hazel pollen season in Brussels was
highlighting a significant trend if the time series are longer.                        shown in this study (data up to 2020) whereas in a previous study
The most recent years of observation are therefore beginning                           (17), it was not significant (data up to 2015). Also, the decreasing
to remarkably complete the oldest data series and to highlight                         trends for Poaceae pollen observed in the current study was not

Frontiers in Allergy | www.frontiersin.org                                         9                                         July 2021 | Volume 2 | Article 676176
de Weger et al.                                                                                                                      Long-Term Pollen Monitoring in the Benelux

TABLE 1 | Association between the rates of change in the seasonal cycles for birch pollen concentrations and the corresponding temperature and radiation change rates.

Station                                                                            Temperature                                                                          Radiation

                                             Mean                                  Maximum                                    Minimum

Brussels                                     0.72***                                 0.86***                                    0.90***                                  −0.09 ns
De Haan                                      0.09 ns                                 0.28 ns                                    0.00 ns                                   0.79***
Helmond                                      0.19 ns                                 0.18 ns                                     0.27*                                     0.33*
Leiden                                       0.63***                                 0.68***                                    0.59***                                   0.78***
Luxembourg                                   0.79***                                 0.82***                                    0.80***                                   0.21 ns

*P < 0.05; ***P < 0.001; ns, not significant.
Spearman correlation coefficient (Rho) was computed between the daily Sen slopes of the birch pollen levels and the daily Sen slopes of the corresponding temperature and radiation.

detected in a previous study with data from Leiden and Brussels                              influence of other environmental factors, e.g., the increasing
up to 2001 (39).                                                                             urbanization in the surroundings of these monitoring locations.
   From the results of this study, we also note that, regardless                             In all, these aeroallergen exposure dynamics might have direct
of variance, the API averaged per decade could in some cases                                 impacts on public health, either by increasing the severity of the
show varying rates of change from one decade to the next. The                                allergic symptoms, or by requesting an adjustment in treatment
best example is the variation of API in Leiden and Helmond                                   timing, or by complicating specific allergy diagnosis if pollen
for the pollen of herbaceous plants (Poaceae and Artemisia).                                 seasons overlap, and by the occurrence of new types of pollen
The increase in API during the 1991–2000 decade is most                                      induced respiratory allergies that have so far a weak prevalence
likely caused by the waste/fallow land in the close vicinity                                 in the Benelux, e.g., against plane and ash pollen.
of both monitoring stations in Helmond and Leiden in that
period. In subsequent years, those areas were rebuilt which                                  DATA AVAILABILITY STATEMENT
resulted in a reduction in the number of Poaceous and Artemisia
plants in the neighborhood of the sites and concomitantly a                                  The data can be made available upon request to the
reduction in API of those species is observed in those subsequent                            corresponding author.
decades. Previous studies also indicate that increasing levels of
urbanization result in lower grass pollen concentrations (40, 41),                           AUTHOR CONTRIBUTIONS
which would explain why the trend in herbaceous plant pollen
concentrations is generally downward in the largest cities of                                Analysis was carried out by LW, NB, WV, AD, and PH. LW
this study. In the case of grasses, this decrease in intensity is                            and NB drafted the first version of the manuscript. All authors
accompanied by a longer season length (due to a progressively                                contributed to revision and final approval of the manuscript
earlier start of the season). Longer pollen season in urban                                  and provided contributions to study conception and design and
environments has also been reported by others (40, 42). However,                             acquisition of data and interpretation of the results.
it might be that there is also an effect of climate on the flowering
of certain grass species of this large family, which is very sensitive                       FUNDING
to temperature and water availability (13, 43). This paradoxical
observation is also similar to that reported in Brussels using                               The monitoring activities at the stations of De Haan and
another method (17), where the season duration defined by                                    Brussels from the Belgian aerobiological surveillance network
the number of days >1 pollen/m3 tended to increase while the                                 are financed by the Flemish Agency for Care and Health and
duration defined by the number of days >50 pollen/m3 tended                                  Brussels-Environment. The aerobiological station at the CHL is
to decrease. It is therefore tempting to extrapolate this with the                           financed by the Ministry of Health of Luxembourg. WV is partly
results of our study, by interpreting that the symptomatic season                            funded by B2/191/P2/RETROPOLLEN from the Belgian Science
(the so-called high season) for grass pollen has progressively                               Policy Office (BELSPO).
been decreasing in the whole Benelux. Definitely, this needs
more research.
   To conclude, our results show that temporal variations in                                 SUPPLEMENTARY MATERIAL
annual pollen levels almost always follow a similar trend in the
Benelux, suggesting the impact of large-scale climate change-                                The Supplementary Material for this article can be found
driven factors, especially for birch pollen. Trends in herbaceous                            online at: https://www.frontiersin.org/articles/10.3389/falgy.
species tend to be more local-specific, most likely under the                                2021.676176/full#supplementary-material

Frontiers in Allergy | www.frontiersin.org                                              10                                                  July 2021 | Volume 2 | Article 676176
de Weger et al. Long-Term Pollen Monitoring in the Benelux
REFERENCES 21. Velasco-Jiménez MJ, Alcázar P, Díaz de la Guardia C, Trigo MdM, de Linares
C, Recio M, et al. Pollen season trends in winter flowering trees in South Spain.
1. Bousquet J, Anto JM, Bachert C, Baiardini I, Bosnic-Anticevich S, Aerobiologia. (2020) 36:213–24. doi: 10.1007/s10453-019-09622-x
Walter Canonica G, et al. Allergic rhinitis. Nat Rev Dis Primers. (2020) 22. Schinko HAE, Lamprecht B, Schmidt R. How will climate change alter the
6:95. doi: 10.1038/s41572-020-00227-0 dynamics of airborne pollen and pollen load of allergenic plants? Allergo J Int.
2. van der Heyden J, Charafeddine R. Maladies et affections Chroniques. (2020) 30:96–108. doi: 10.1007/s40629-020-00152-4
Sciensano Epidemiologie et sante publique (2018). Available online at: https:// 23. Frei T, Gassner E. Trends in prevalence of allergic rhinitis and correlation
his.wiv-isp.be/fr/Documents%20partages/MA_FR_2018.pdf (accessed June 1, with pollen counts in Switzerland. Int J Biometeorol. (2008) 52:841–
2021). 7. doi: 10.1007/s00484-008-0178-z
3. To T, Stanojevic S, Moores G, Gershon AS, Bateman ED, Cruz AA, et al. Global 24. Beck HE, Zimmermann NE, McVicar TR, Vergopolan N, Berg A, Wood
asthma prevalence in adults: findings from the cross-sectional world health EF. Present and future Köppen-Geiger climate classification maps at 1-km
survey. BMC Public Health. (2012) 12:204. doi: 10.1186/1471-2458-12-204 resolution. Sci Data. (2018) 5:180214. doi: 10.1038/sdata.2018.214
4. Bauchau V, Durham SR. Prevalence and rate of diagnosis of allergic rhinitis in 25. Cervellini M, Zannini P, Di Musciano M, Fattorini S, Jiménez-Alfaro
Europe. Eur Respir J. (2004) 24:758–64. doi: 10.1183/09031936.04.00013904 B, Rocchini D, et al. A grid-based map for the Biogeographical Regions
5. Blomme K, Blomme K, Tomassen P, Lapeere H, Huvenne W, Bonny M, of Europe. Biodivers Data J. (2020) 8:e53720. doi: 10.3897/BDJ.8.
et al. Prevalence of allergic sensitization versus allergic rhinitis symptoms e53720
in an unselected population. Int Arch Allergy Immunol. (2013) 160:200– 26. KNMI’14 klimaatscenario’s. Available online at: http://www.klimaatscenarios.
7. doi: 10.1159/000339853 nl/scenarios_samengevat/index.html (accessed March 20, 2020).
6. Dahl R, Andersen PS, Chivato T, Valovirta E, de Monchy J. National 27. Climate Change Post. (2020). Available online at: https://www.
prevalence of respiratory allergic disorders. Respir Med. (2004) 98:398– climatechangepost.com/belgium/climate-change/ (accessed June 1, 2021).
403. doi: 10.1016/j.rmed.2003.11.015 28. KNMI. Available online at: https://www.knmi.nl/nederland-nu/klimatologie/
7. Smits HH, Hiemstra PS, Prazeres da Costa C, Ege M, Edwards M, Garn H, maand-en-seizoensoverzichten/2019/jaar (accessed February 19, 2020).
et al. Microbes and asthma: opportunities for intervention. J Allergy Clin 29. Stas M, Aerts R, Hendrickx M, Dendoncker N, Dujardin S, Linard C, et al. An
Immunol. (2016) 137:690–7. doi: 10.1016/j.jaci.2016.01.004 evaluation of species distribution models to estimate tree diversity at genus
8. Anderegg WRL, Abatzoglou JT, Anderegg LDL, Bielory L, Kinney level in a heterogeneous urban-rural landscape. Landscape Urban Plann.
PL, Ziska L. Anthropogenic climate change is worsening North (2020) 198:103770. doi: 10.1016/j.landurbplan.2020.103770
American pollen seasons. Proc Natl Acad Sci U S A. (2021) 30. Aerts R, Bruffaerts N, Somers B, Demoury C, Plusquin M, Nawrot
118:e2013284118. doi: 10.1073/pnas.2013284118 TS, et al. Tree pollen allergy risks and changes across scenarios in
9. García-Mozo H, Oteros JA, Galán C. Impact of land cover changes and climate urban green spaces in Brussels, Belgium. Landscape Urban Plann. (2021)
on the main airborne pollen types in Southern Spain. Sci Total Environ. (2016) 207:104001. doi: 10.1016/j.landurbplan.2020.104001
549:221–28. doi: 10.1016/j.scitotenv.2016.01.005 31. de Weger LA, Molster F, de Raat K, den Haan J, Romein J, van
10. IPCC. The Physical Science Basis. Contribution of Working Group I to the Leeuwen W, et al. A new portable sampler to monitor pollen at
Fifth Assessment Report of the Intergovernmental Panel on Climate Change. street level in the environment of patients. Sci Total Environ. (2020)
Cambridge; New York, NY: Cambridge University Press (2013). 741:140404. doi: 10.1016/j.scitotenv.2020.140404
11. IPCC. Climate Change 2014: Synthesis Report. Contribution of Working 32. Hirst JM. An automatic volumetric spore trap. Ann Appl Biol. (1952) 39:257–
Groups I, II III to the Fifth Assessment Report of the Intergovernmental Panel 65. doi: 10.1111/j.1744-7348.1952.tb00904.x
on Climate Change R.K.P.a.L.A.M. Core Writing Team. Geneva (2014). 33. Galán C, Smith M, Thibaudon M, Frenguelli G, Oteros J, Gehrig R, et al.
12. WMO. The State of the Global Climate 2020. Available online at: https:// Pollen monitoring: minimum requirements and reproducibility of analysis.
public.wmo.int/en/our-mandate/climate/wmo-statement-state-of-global- Aerobiologia. (2014) 30:385–95. doi: 10.1007/s10453-014-9335-5
climate (accessed June 1, 2021). 34. Glick S, Gehrig R, Eeftens M. Multi-decade changes in pollen season onset,
13. Bruffaerts N, De Smedt T, Delcloo A, Simons K, Hoebeke L, Verstraeten C, duration, and intensity: a concern for public health? Sci Total Environ. (2021)
et al. Comparative long-term trend analysis of daily weather conditions with 781:146382. doi: 10.1016/j.scitotenv.2021.146382
daily pollen concentrations in Brussels, Belgium. Int J Biometeorol. (2018) 35. Ziska LH, Makra L, Harry SK, Bruffaerts N, Hendrickx M, Coates F, et al.
62:483–91. doi: 10.1007/s00484-017-1457-3 Temperature-related changes in airborne allergenic pollen abundance and
14. Emberlin J, Detandt M, Gehrig R, Jaeger S, Nolard N, Rantio-Lehtimaki A. seasonality across the northern hemisphere: a retrospective data analysis.
Responses in the start of Betula (birch) pollen seasons to recent changes Lancet Planet Health. (2019) 3:e124–e31. doi: 10.1016/S2542-5196(19)30015-4
in spring temperatures across Europe. Int J Biometeorol. (2002) 46:159– 36. Rojo J, Picornell A, Oteros J, Werchan M, Werchan B, Bergmann
70. doi: 10.1007/s00484-002-0139-x K-C, et al. Consequences of climate change on airborne pollen
15. Spieksma FTM, Emberlin JC, Hjelmroos M, Jäger S, Leuschner RM. in Bavaria, Central Europe. Regional Environ Change. (2021)
Atmospheric birch (Betula) pollen in Europe: trends and fluctuations in 21:9. doi: 10.1007/s10113-020-01729-z
annual quantities and the starting dates of the seasons. Grana. (1995) 34:51– 37. Bogdziewicz M, Kelly D, Thomas PA, Lageard JGA, Hacket-Pain A. Climate
7. doi: 10.1080/00173139509429033 warming disrupts mast seeding and its fitness benefits in European beech. Nat
16. Ziello C, Sparks TH, Estrella N, Belmonte J, Bergmann KC, Bucher E, Plants. (2020) 6:88–94. doi: 10.1038/s41477-020-0592-8
et al. Changes to airborne pollen counts across Europe. PLoS One. (2012) 38. Bogdziewicz M, Szymkowiak J, Bonal R, Hacket-Pain A, Espelta
7:e34076. doi: 10.1371/journal.pone.0034076 JM, Pesendorfer M, et al. What drives phenological synchrony?
17. Hoebeke L, Bruffaerts N, Verstraeten C, Delcloo A, De Smedt T, Packeu Warm springs advance and desynchronize flowering in oaks. Agric
A, et al. Thirty-four years of pollen monitoring: an evaluation of the Forest Meteorol. (2020) 294:108140. doi: 10.1016/j.agrformet.2020.
temporal variation of pollen seasons in Belgium. Aerobiologia. (2018) 34:139– 108140
55. doi: 10.1007/s10453-017-9503-5 39. Spieksma FTM, Corden JM, Detandt M, Millington W, Nikkels
18. Lind T, Ekebom A, Alm Kübler K, Östensson P, Bellander T, Lõhmus M. Pollen H, Nolard N, et al. Quantitative trends in annual totals of five
Season Trends (1973-2013) in Stockholm Area, Sweden. PLoS One. (2016) common airborne pollen types (Betula, Quercus, Poaceae, Urtica,
11:e0166887. doi: 10.1371/journal.pone.0166887 and Artemisia), at five pollen-monitoring stations in western Europe.
19. Damialis A, Halley JM, Gioulekas D, Vokou D. Long-term trends in Aerobiologia. (2003) 19:171–84. doi: 10.1023/B:AERO.0000006528.37
atmospheric pollen levels in the city of Thessaloniki, Greece. Atmos Environ. 447.15
(2007) 41:7011–21. doi: 10.1016/j.atmosenv.2007.05.009 40. Charalampopoulos A, Damialis A, Lazarina M, Halley JM, Vokou D.
20. Galán C, Alcázar P, Oteros J, García-Mozo H, Aira MJ, Belmonte J, et al. Spatiotemporal assessment of airborne pollen in the urban environment:
Airborne pollen trends in the Iberian Peninsula. Sci Total Environ. (2016) the pollenscape of Thessaloniki as a case study. Atmos Environ. (2021)
550:53–9. doi: 10.1016/j.scitotenv.2016.01.069 247:118185. doi: 10.1016/j.atmosenv.2021.118185
Frontiers in Allergy | www.frontiersin.org 11 July 2021 | Volume 2 | Article 676176de Weger et al. Long-Term Pollen Monitoring in the Benelux
41. Hugg TT, Hjort J, Antikainen H, Rusanen J, Tuokila M, Korkonen Conflict of Interest: The authors declare that the research was conducted in the
S, et al. Urbanity as a determinant of exposure to grass pollen absence of any commercial or financial relationships that could be construed as a
in Helsinki Metropolitan area, Finland. PLoS One. (2017) potential conflict of interest.
12:e0186348. doi: 10.1371/journal.pone.0186348
42. Rodriguez-Rajo FJ, Astray G, Ferreiro-Lage JA, Aira MJ, Jato- Copyright © 2021 de Weger, Bruffaerts, Koenders, Verstraeten, Delcloo, Hentges and
Rodriguez MV, Mejuto JC. Evaluation of atmospheric Poaceae pollen Hentges. This is an open-access article distributed under the terms of the Creative
concentration using a neural network applied to a coastal Atlantic Commons Attribution License (CC BY). The use, distribution or reproduction in
climate region. Neural Netw. (2010) 23:419–25. doi: 10.1016/j.neunet.2009. other forums is permitted, provided the original author(s) and the copyright owner(s)
06.006 are credited and that the original publication in this journal is cited, in accordance
43. Garcia-Mozo H. Poaceae pollen as the leading aeroallergen worldwide: a with accepted academic practice. No use, distribution or reproduction is permitted
review. Allergy. (2017) 72:1849–58. doi: 10.1111/all.13210 which does not comply with these terms.
Frontiers in Allergy | www.frontiersin.org 12 July 2021 | Volume 2 | Article 676176You can also read