A-League Report The 2017/18 PFA - Professional Footballers Australia
←
→
Page content transcription
If your browser does not render page correctly, please read the page content below

The 2017/18 PFA

A-League
 Report
A-League
                                                             Foreword
Supporting                                                   The A-League has reached its next great
                                                             crossroads.
                                                                                                               The season catapulted the likes of Andrew
                                                                                                               Nabbout, Josh Risdon, Daniel Arzani and
                                                                                                                                                                 entertaining and high-scoring competition,
                                                                                                                                                                 while sensible and collaborative decision-

the Players
                                                                                                               Dimitri Petratos to the World Cup, and the        making will ensure positive outcomes for
                                                             Before exploring the big questions facing the     A-League played a foundational role in the        players, fans, clubs and the broader game.
                                                             future of the men’s domestic competition, I       careers of the majority of the Socceroos          This includes working with the PFA to ensure
                                                             will start, as always, with the achievements of   squad – a squad that continues to achieve the     the best possible Collective Bargaining
                                                             the players, and the compelling season they       incredible given the odds it faces.               Agreement for the 2019/20 season, working

Building
                                                             delivered in 2017/18.                                                                               with clubs to ensure the best possible model
                                                                                                               These stories go on.                              for an independent league and working with
                                                             Sydney FC continued to set the benchmark                                                            the entire football community to ensure the
                                                             with another record-setting season,               Despite these achievements, this report           A-League is embedded at every contact point
                                                             featuring a Premiership and FFA Cup double.       reveals a number of pressing challenges           within the game. It will cultivate a unity of

the Game
                                                             Our annual survey of A-League players             facing the A-League. Attendance and TV            purpose across the sport’s army of followers.
                                                             showed that Sydney’s on-field success was         figures are down. Player churn is at historic
                                                             underpinned by the league’s most highly rated     highs. Competitive balance and financial          The PFA will continue to work tirelessly to
                                                             club culture. It demonstrates the inherent        robustness are myths, yet players – and           ensure the A-League fulfils its full, vast
                                                             value in positive workplaces and the benefit of   clubs through the inability to build value in     potential sooner rather than later.
                                                             creating professional, respectful and honest      their squads - continue to endure significant
                                                             environments to consistently maximise high        adverse side effects of a broken Salary
                                                             performance.                                      Cap that was supposed to promote those
                                                                                                               outcomes.
                                                             Melbourne Victory became the first A-League
                                                             team to win the Championship from outside         Our low levels of available match minutes,
                                                             the top two in the regular season, showing        relative to the rest of the world, threaten our
                                                             incredible character and the winner’s             international competitiveness at all levels.
                                                             mentality that we have come to expect from        On this front two new clubs from 2019/20          John Didulica | PFA Chief Executive
                                                             their current and emerging leaders.               are welcomed, but the game is in danger of
                                                                                                               remaining too distracted with personality
                                                             Newcastle’s resurgence captured the               politics to ensure mistakes will not be made.
                                                             imagination of a proud football region and
                                                             highlighted the organic potential of our clubs    I remain, however, so optimistic about the
                                                             and competitions at their best. Riley McGree’s    future of the A-League.
                                                             wondrous Puskas Award contender in the
                                                             Finals Series captured, in one moment, the        Yes, we are at the crossroads. However, the
                                                             audacity and freshness of their entire season.    report highlights we still have an all-action,

Professional Footballers Australia          Photography:
2/55 Walsh Street
West Melbourne VIC 3003                 Aleksander Jason
                                               Anita Milas
p 1300 650 497                       Sproule Sports Focus
e info@pfa.net.au                        Jamie Castaneda
www.pfa.net.au

                                                                                                                                                                                                               3
Contents                                                                                A-League
    Employment
    Framework
                            League
                            Assessment
                                                  Technical
                                                  Report
                                                               Injury
                                                               Report
                                                                                        Survey
    7                       15                    25           33
    Snapshot                Snapshot              Snapshot     Snapshot

    8                       16                    26           34                           Introducing the
    Minimum Wage
    Benchmarking
                            Competitive Balance   Goals        Methodology
                                                                                            survey widget

    9                       18                    27           34                           Where this symbol appears, you will see data
                                                                                            and quotes from our major annual survey of
    Player Churn            Scheduling            Creation     Location of Injuries         A-League players. Every A-League player
                                                                                            was sent a link to the online survey in the
                                                                                            weeks leading up to and following the 2017-18
                                                                                            A-League Grand Final. Sixty-nine players
    10                      20                    28           37                           responded to the survey, although not every
                                                                                            player completed every question.
    Player Analysis         Attendance            Passing      Injury Comparison
                                                                                            The survey covered a broad range of areas
                                                                                            impacting a player’s career, from their
                                                                                            contract, to work and study outside of football,
    11                      22                    29                                        to transition-readiness, to assessments of
                                                                                            their club, the A-League, the next Collective
    Starting XI Stability   Viewership            Possession                                Bargaining Agreement, social media and the
                                                                                            PFA.

    12                      23                    30
    Match Minutes           Pitch Ratings         Defending

    12                                            31           38
    Foreign Players                               Refereeing   PFA Player Development
                                                               Program

4                                                                                                                                              5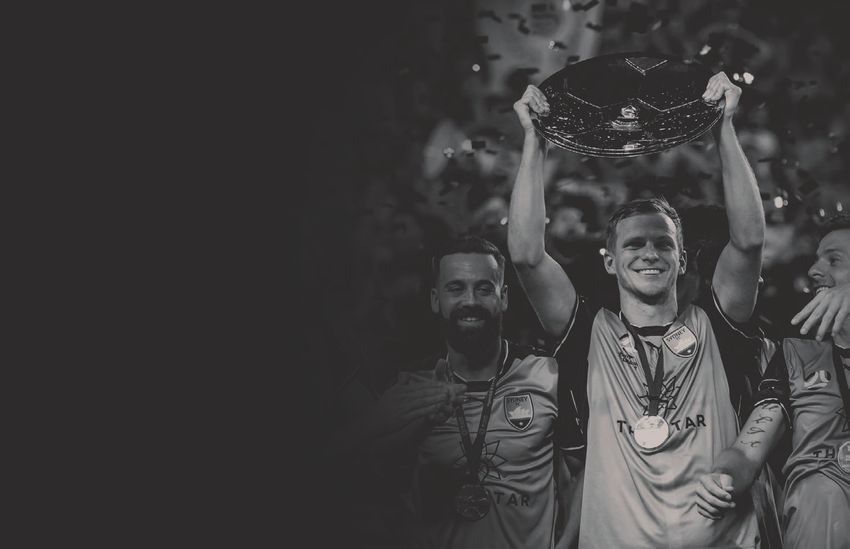
Snapshot

             63.4%                                                         40%
             Players who were coming off                Players in their first year at
             contract this season                                 their current club

             2.4                                                       54.5%

Employment
             Average number of                               Players slightly or not
             seasons at current club                          at all confident about
                                                                    career direction

Framework    6.1%
             Minutes played by U21 players
                                                                      15,390
                                                      More minutes played in the J1
                                                        League than the A-League

             In this section we highlight the
             record levels of player churn in the
             A-League this season and how it
             harms players, clubs and the league
             as a whole. We also find that the
             most successful clubs this season
             were those that used the fewest
             players, reinforcing the importance
             of squad stability for performance.

             The results of this section underpin
             the case for significant reform to the
             employment framework in the next
             Collective Bargaining Agreement.

             We also break down the minutes
             played by different age groups and
             foreign players and compare the
             amount of playing opportunities
             with global leagues, highlighting
             the need to expand and lengthen
             the A-League to achieve globally
             competitive development outcomes.

6                                                                                        7
Minimum Player
Wage Churn
Benchmarking
Percentage of players attending fewer games or not renewing their
memberships because their favourite players
off contract have left their club. One third of players coming off contract
this season were 22 or younger
Research from CIES Football Observatory
63.4%
A-League 2017/18 $61,287 (Monthly Report #34) has shown that across
31 European leagues, there is a strong
55.8% correlation between squad stability and team
52.3% 53.0% success. Sydney FC have been an exemplar of
this trend locally. In addition, clubs can only
A-League U20
collect transfers fees if the players who attract
2017/18 $45,686 interest are under contract.
But despite these incentives for clubs to sign
players longer term, the evidence shows the
trends moving the other way. So the reality of
Cricket 2017/18 $66,243 clubs’ behaviour suggests the forces pushing
State player towards higher churn are stronger than those
listed above.
These problems are symptoms of the
AFL 2018 $105,000 + $5,000 Match Fee A-League’s labour market model. The only
way the current model could be logically
defended is if it was achieving positive
outcomes that justified the negative side
effects. That is, if the good outweighed the
AFL 2018 $88,200 + $4,300 Match Fee bad. But the salary cap is not achieving the
2014/15
2015/16
2016/17
2017/18
legitimate outcomes it is explicitly designed
First year / first round
to achieve.
draft pick
According to the A-League website, the cap
NRL 2018 $100,000 exists to promote sustainable clubs and
competitive balance.
The 2017/18 season saw a record level of
contract insecurity for A-League players. At The A-League’s chequered history of
the start of the season, over 63% of players unsustainable clubs and ongoing pressure
NRL 2018 $60,000 + $3,000 Match Fee were coming out of contract, and nearly 40% on the viability of smaller market clubs makes
it difficult to claim this outcome has been
of players becoming unemployed on June 1.
Development list achieved.
40% of players were only in the first year
at their current club and the average time And as we will see in more detail on page 16,
Super Rugby 2019 $85,000 players had spent at their current club was
just 2.4 seasons.
the competitive balance of the A-League has
been increasingly compromised in recent
Core playing squad seasons to accommodate investment in more
In addition, more than half of players (54%) marketable and higher quality players by the
have been in the A-League for less than 3 clubs that can afford to do so.
seasons and more than half (53%) of players
under 20 had a year or less remaining on their This investment in quality is more important
contracts at season’s end. to the league’s health in a competitive sports
The majority of A-League survey respondents and entertainment market than close games,
indicated a slight-to-non-existent level of This spiralling level of churn is harmful not which is why the top flight of England and not
Extremely
Confident 8.8% confidence about where their football careers only to players but to clubs and the league Russia (Europe’s most balanced league) is
are heading. overall. the most commercially successful league in
Europe.
Very The players also indicated they are largely Clubs are striving to maintain a compelling
Confident 36.8% supportive of labour market reforms that connection with their fans, but fans are just So, players, fans and clubs suffer the
would drive more stable careers in the as likely to see their favourite players scoring unwanted side effects of a mechanism not
A-League. against them as for them next season. achieving its primary aims. This is why
A-League Survey Slightly
Confident 47.1% the PFA has described the current labour
A PFA-commissioned survey of A-League market model as ‘not fit for purpose’ and
In general, how confident are you fans revealed that 77% of fans would like will advocate for reforms which will promote
about the direction of/your control Not Confident to see more stable squads in the A-League more stable careers for players and a more
7.4%
over your football career? at all and over a third of fans have considered successful league.
9
Player Analysis                                              Starting XI
                                                             Stability
Total players used in
the A-League 2017/18
                                                             Spread of minutes

        246
                                                             within each team
                                                                                                           Minutes played
                    Eight players played at
                    two different clubs
                                                                        0   200   400   600   800   1000   1200    1400     1600   1800   2000   2200   2400   2600

Club by Club                                            27
Breakdown

                                                        28

                                                    26

                                                    26

                                               23

                                                   24

                                                        27

                                              21

                                                        27

                                                   25

10
Match Minutes Match minutes comparison Regular seasons only
A-League 2430 12,150
Match minutes by age
Bundesliga 3060 27,540
There was a correlation between clubs using
J1 League
Number who made Average minutes Percentage of fewer players throughout the season and on-
Age Total minutes played 3060 27,540
field success. Premiers Sydney FC used the
an appearance per player total minutes
fewest players, 21, while Champions Melbourne
Victory used the second fewest, 23.
MLS 3060 33,660
U21 43 17,016 396 6.1% There is no right or wrong share of minutes that
players from different age groups should play. Max minutes per player Total Minutes
For each opportunity a young player gets, an
older player must make way, so there is always
a compromise between the priorities of youth
21-25 67 71,049 1,060 25.7% development and career longevity. It’s clear the A-League is falling short of played in the A-League at some point,
providing a globally competitive volume the league’s role as a development
We do know that ages in the A-League are of match minutes for our players. platform for the national team is
creeping upwards. Some excellent young as prevalent as ever. This role must
26-30 60 76,295 1,272 27.6% talents broke through this season, headlined by Our collective playing group is seeing be given appropriate weight when
Daniel Arzani, but by average age, this season less than half the pitch time of those in considering the length and size of the
eclipsed the previous two as the ‘oldest’ on the top divisions of Japan, the United professional competition, alongside
record. States and Germany. An individual other factors.
A-League player has about 20% fewer
31+ 76 112,449 1,480 40.6% The A-League’s talent development imperative match minutes available to him than Obviously the addition of two new
is evidently in conflict with the coaches’ those in the other leagues. teams for the 2019/20 season will be
prerogative to rely on more experienced players a welcome development in terms of
to get the results that preserve their jobs. Given that 14 of the 15 Australians who creating more opportunities for players.
Total 246 276,809 1,125 100% played at the 2018 World Cup have
It is expected that the addition of two new
clubs for the 2019/20 season will create more
opportunities for young players and lower the
average age, but we must continue to monitor
this trend in respect of the competing interests A large majority of players would like to
of clubs, coaches and the broader game. The see the professional footprint expanded,
Foreign Players
A-League’s purpose and key performance through either more A-League clubs, a
indicators may need to be better defined so that second division, or both.
its success can be measured and, if appropriate,
interventions employed. Specific comments from players all
touched on the theme of sustainability,
showing that players are engaged
with the complexity around growing
A-League Survey
professional opportunities in a way
that doesn’t compromise the stability
of their careers and quality of their
working environments.
87.1%
Total foreign
players: Do you think the 74.2% Do you think there
0 38 A-League should should be a second
51
1
expand as soon as division below the
possible? A-League?
A-League Survey
16.1%
3 Do you think the number of foreign 9.7% 9.7%
3.2%
2
players in the A-League should change?
Percentage of minutes 7 Less 4.8% Yes No Not sure Yes No Not sure
played by foreign players:
27.8%
Stay the
same 75.8%
Player comment:
“As players we all want expansion as it creates more jobs and gives more players
opportunities. But we need to learn from the past and not just dive into expansion until
More 19.4% the right amount of planning/research etc. has been done.”
Snapshot

                 44                                                                  17
                 points between first and last                 times the five big market clubs
                 for the past two seasons                        have made the finals out of a
                                                                                   possible 20

League           18.6%
                 matches won by 3
                                                                       13.4%
                                                                          decrease in crowds

Assessment
                 or more goals                                              from last season

             In this section we analyse the 2017/18
             A-League season across several metrics.

             Perhaps the most important measures of
             all – crowds and TV viewers – have dropped
             this season. Feedback from A-League players
             suggests dissatisfaction with the matchday
             experience for supporters and a strong
             appetite for the A-League to become an
             independent entity.

             We also analyse the competitive balance of
             the league and find that the same teams
             are winning more consistently and by larger
             margins in recent seasons. This points to
             a failure in the stated aim of the salary cap
             model, without preventing the unwanted side
             effect of high player turnover discussed in the
             Employment Framework section.

             This section paints a picture of a league
             reaching a crossroads where major reform
             is required to kickstart a virtuous cycle of
             growth.

14                                                                                               15
Competitive Balance
Points spread                                           Match                                                                    Matches decided by 1 goal             Matches decided by 3 goals

comparison                                              competitiveness                                     Draws               Matches decided by 2 goals            Matches decided by 4+ goals

               0     10   20   30   40   50   60   70       100%

                                                             90%
     2012/13
                                                             80%

     2013/14                                                 70%

                                                             60%

     2014/15                                                 50%

                                                             40%

     2015/16
                                                             30%

                                                             20%
     2016/17
                                                             10%

                                                               0%
     2017/18
                                                                    2012/13                 2013/14                  2014/15                    2015/16                  2016/17                    2017/18

Finals appearances                                      Any way you cut it, the A-League has become       Newcastle Jets’ Cinderella story this season        Fans do not watch games only because they are
2014-2018                                               less competitively balanced during the period
                                                        with the current ten clubs. Across seasons,
                                                                                                          was all the more compelling because it bucked
                                                                                                          this trend, but even so, their rise up the ladder
                                                                                                                                                              close, but also because they are high quality
                                                                                                                                                              (and for many other reasons).
                                                        within seasons and within matches, the same       was fuelled in part by significantly increased
                                                        teams are winning more consistently and by        investment in their playing squad from the          But because the size of the annual club grant
                                                        bigger margins.                                   previous season.                                    has not kept pace with the ambitions of the

            2m+
                                                                                                                                                              well-capitalised clubs, the smaller clubs have
                                                        Looking at the charts, we first see that the      To explain this trend, we note that all over the    been left well off the pace. Growing the club
                                                        points spread between the top and bottom of       football world, results correlate very strongly     grant depends on the league’s administrators

           market
                                                        the ladder has grown. Sydney FC earned 44         with wage spend. As the difference in spending      maximising the commercial potential of the
                                                        more points than the bottom-placed club in        between A-League clubs has grown, so too            league and investing a fair share of that revenue
                                                        each of the past two seasons.                     has the difference in on-field performance.         back into clubs. Arguably, neither of these has
                                                                                                          The roles of coaching and luck in determining       happened.
                                                        Within individual matches, the share of matches   ladder position have diminished. The divergence
                                                        decided by three or more goals, shown by the      in spending has been allowed, or even               What we have now is a league that is no more

           < 2m
                                                        top two colours on the match competitiveness      promoted, because the salary cap regulations        or less competitively balanced than the average
                                                        chart, has generally grown over these seasons.    have been softened to allow investment in           European league, but one in which players
                                                                                                          better and more marketable players by clubs         and clubs suffer the unwanted side effects of

           market
                                                        And fewer clubs are sharing in the success. The   that can afford to do so.                           a labour market model which has a primary
                                                        variety of teams finishing in the top positions                                                       purpose of promoting competitive balance. It is
                                                        has narrowed. The five teams from the biggest     That is because the league’s administrators         the worst of both worlds.
                                                        markets have reached the finals 17 out of a       have apparently recognised that competitive
                                                        possible 20 times in the past four seasons,       balance is not an end in itself which must be
                                                        while the other five clubs only made 7 out of a   maximised, but one of many factors which
                                                        possible 20 finals berths.                        might determine a league’s appeal and success.

16                                                                                                                                                                                                         17
Scheduling
Distance travelled
Period from A-League Round 1 to Grand Final.
Includes A-League, FFA Cup and AFC Champions League fixtures
Trips Average distance Total distance
(requiring air tavel) (kms) (kms)
14
Matches missed due to 97,626
6,973
13
international call-ups 12 17 5,129 87,200
14 5,298 74,046
Total:
47
13 5,512 71,658
6 17 2,935 49,896
4 4 4 14 2,809 39,328
2 2 13 2,585 33,606
0 0
11 2,824 31,062
8 2,724 21,792
8 2,586 20,684
Average days
between matches
AFC Champions
League clubs Opponent Opponent
Number of Average days
3 days 4 days 5 days
matches break 17
Days break Group game 1 4 4 15
30 6.76 0 4 6 before game
Group game 2 7 7 7 7
29 7.00 1 3 2
Group game 3 5 5 4 4
27 7.27 1 0 3 Group game 4 6 3 6 3
29 7.25 1 1 4 Group game 5 4 4 5 3
Group game 6 5 5 4 4
36 6.00 1 7 6
Average 5.17 6.83 5.00 6.00
29 7.50 1 0 4
27 7.23 0 3 4
36 5.80 1 9 5 The introduction of international breaks for Although our AFC Champions League suffered from an extremely unbalanced early
the 2018/19 season is a major and welcome participant clubs had at least one day less rest draw, with six away games in the first nine.
step in the gradual progress being made before their group stage matches than their This run correlated with a spate of injuries at
27 7.23 1 1 1 towards fairer and safer A-League scheduling. opponents on average, those averages were the club.
skewed by one outlier match. Our clubs had
28 7.00 2 1 3 The number of three-day breaks between at least four days rest before all their fixtures,
matches was nearly halved from 17 in 2016/17 whereas their opponents sometimes had only
to 9 in 2017/18. There were only two instances three.
Total 6.85 9 29 38 of clubs combining a three-day break with
18 travel. There are still gains to be made. Perth Glory
19Attendance 17,631
Data relates to regular season only
14,593
2017/18 average Top ten crowds
crowds by club 11,924
2017/18
10,887
36,433
9,830 9,868
Average
9,093 9,186 1 Western Sydney Wanderers v
Sydney FC
crowd ANZ Stadium
7,168 A-League Survey
35,792
5,694 Do you think the A-League should be run
2 Melbourne Victory v independently instead of by FFA?
Melbourne City
Etihad Stadium
Yes 77.4%
34,810
Number of
matches
13 14 13 14 14 14 13 14 13 13 3 Sydney FC v
Western Sydney Wanderers No 0.0%
Allianz Stadium
Not
Club 22.6%
25,211
Sure
4 Sydney FC v
Western Sydney Wanderers
Atmosphere Allianz Stadium
rating
24,804
What do you think should be done to improve
Atmosphere is
scored out of
5 Melbourne Victory v fan engagement and active support in the
A-League?
Sydney FC
five by selected 2.17 Etihad Stadium
players from the Selected comments:
away team after
3.13 3.05 3.00 3.00 3.06
each match
3.25
22,515
“Less rules and regulations on active
3.44 3.50 supporters. Tickets prices reduced and overall
3.79 6 Melbourne City v match day experience needs to improve.”
Melbourne Victory
AAMI Park
A-League average
“Pyro smoke, more banners and flags, under
12 free with paying adult across board.”
crowds by season
21,577
“More marketing from FFA. Get the game
7 Melbourne Victory v to the masses. Make the games more of an
experience for fans.”
Western Sydney Wanderers
15,000 Etihad Stadium
“More access, less regulation, more
engagement to make atmosphere unique.
14,000
21,037
Game day experience inside and outside
stadium must improve.”
13,000 8 Melbourne Victory v
Sydney FC “Let clubs create their own culture. Better
AAMI Park the relationships with the active supporter
12,000
groups.”
20,083
11,000 “Legalise safe smoke or flare usage for
10,000 9 Melbourne City v designated sections of active support areas.”
Melbourne Victory
AAMI Park
9,000
19,416
8,000
10 Adelaide United v
2005/06
2006/07
2007/08
2008/09
2009/10
2010/11
2011/12
2012/13
2013/14
2014/15
2015/16
2016/17
2017/18
Melbourne Victory
Adelaide Oval
20 21Viewership Pitch Ratings
A-League average Stadium
Playing surface
Rating Stadium
Playing surface
Rating
viewership by season
criteria criteria
Data for Fox Sports only.
4.1 3.5
2017/18 data current to Round 19 AAMI Park Pace McDonald Pace
3.8 3.8
Hardness Jones Stadium Hardness
90,000 Smoothness 3.9 Smoothness 3.8
Overall 4.0 Overall 3.8
80,000
70,000 3.0 4.1
Adelaide Oval Pace nib Stadium Pace
Hardness 2.0 Hardness 3.4
60,000 Smoothness 4.0 Smoothness 3.9
Overall 3.0 Overall 4.1
50,000
40,000 4.0 3.0
Allianz Pace QBE Stadium Pace
4.0 3.0
Stadium Hardness Hardness
30,000 Smoothness 3.8 Smoothness 4.0
Overall 3.9 Overall 4.0
20,000
10,000 4.0 3.0
ANZ Stadium Pace Simonds Pace
3.5 3.0
Hardness Stadium Hardness
0 Smoothness 4.0 Smoothness 4.0
Overall 4.0 Overall 3.0
2005/06
2006/07
2007/08
2008/09
2009/10
2010/11
2011/12
2012/13
2013/14
2014/15
2015/16
2016/17
2017/18
3.8 3.8
Central Coast Pace Spotless Pace
3.4 3.8
Stadium Hardness Stadium Hardness
Smoothness 3.4 Smoothness 4.3
Overall 3.5 Overall 4.0
The A-League-wide average crowd has high-scoring matches (see the Technical matches which came from outside Sydney
declined every season since 2013/14, but this Report) and World Cup Socceroos Josh and Melbourne was Adelaide United when it
season saw a much more dramatic decrease, Risdon, Daniel Arzani, Dimi Petratos, Andrew hosted Melbourne Victory at the Adelaide Oval 3.3 3.2
with the average attendance down 13.4% from Nabbout, Mark Milligan and Tim Cahill all in front of 19,416, the tenth biggest crowd of Coopers Pace Suncorp Pace
3.5 2.9
12,299 to 10,655. TV audiences also hit their started this season in the A-League. the regular season. Stadium Hardness Stadium Hardness
lowest levels by far in the period with the Smoothness 3.8 Smoothness 2.9
current mix of ten clubs. More likely the lack of effective promotion, Clubs with larger average crowds tended to Overall 3.4 Overall 3.1
the delay on expansion, the fractured have better atmosphere at their matches,
This is a concerning trend for players because relationships with active supporters, but this correlation was not universal.
healthy and successful careers are contingent the implementation of VAR, and the Having a similar crowd in a smaller venue
on a healthy and successful game. disenfranchisement caused by the ongoing seemed to create a better atmosphere. This
3.8 3.5
governance crisis may have played a role in result highlights the importance of having Etihad Pace Westpac Pace
There are numerous factors which could have the outcomes this season. appropriate stadia. 3.4 3.4
Stadium Hardness Stadium Hardness
contributed to the downturn, but it would be Smoothness 3.6 Smoothness 4.5
hard to argue that the quality of football has As usual, the biggest crowds came from clubs 3.6 4.2
Overall Overall
noticeably dropped compared to previous from the biggest cities playing each other. The
seasons. The A-League continues to produce only club featuring in the top ten attended
22 23Snapshot
3.02 3.1/5
Goals per game Average rating of
referees’ communication
with players
3.0% 53.2%
Technical Matches ending
goalless
Players opposed to use
of VAR in the A-League
Report 854.5
Passes per match
For the second year, we used Opta data to The A-League continues to track as a very It is probably fair to generalise that the
compare the A-League’s on-field profile with high-scoring league with relatively few nil-all A-League is a relatively high-scoring,
selected foreign leagues (J1 League 2017, draws. Goals are spread throughout matches action-packed league compared to global
German Bundesliga 2017/18, Major League in the A-League rather than clustered towards benchmarks but one with less focus on (or less
Soccer 2017). We have also included last the end of the 90 minutes in other leagues. ability to maintain) sustained possession.
season’s A-League data to identify emerging
trends within our league. In terms of general play, the A-League It is also evident that other leagues feature a
featured a lower number of passes per match larger diversity of game styles across teams,
We recognise that further tactical analysis and than the other leagues, and the lowest pass whereas the A-League’s teams are all more
advanced analytics may be required to make completion rate, but a higher rate of nearly balanced in terms of the share of possession
definitive statements about the standard and all other types of incidents, such as tackles, they keep in matches.
style of the A-League, but some superficial interceptions, fouls, crosses and through balls,
conclusions can be drawn. as well as cards and penalties.
24 25Goals
Percentage of shots converted Percentage of shots on target Total shots per game
11.8% 11.8%
11.1% 11.6% 34.6% 36.0% 35.7% 35.4%
10.5% 32.8%
25.5 25.6 25.3 25.7 24.8
Goals per game Percentage of goalless
draws
A-League
2017/18
A-League
2016/17
MLS
J1 League
A-League
2017/18
A-League
2016/17
MLS
J1 League
A-League
2017/18
A-League
2016/17
MLS
J1 League
Bundesliga
Bundesliga
Bundesliga
6.9%
3.02 3.03 6.1% 5.9%
2.79 2.97 2.59 5.2%
Percentage of shots from Percentage of goals from Crosses per match
3.0% outside the area set pieces
41.5%
39.5% 38.1% 40.1%
36.8%
31.4% 33.1% 32.2%
29.1% 28.6
26.4% 25.3 26.7
24.0
A-League
2017/18
A-League
2016/17
MLS
J1 League
A-League
2017/18
A-League
2016/17
MLS
J1 League
Bundesliga
Bundesliga
21.9
Scoring breakdown
A-League 2017/18 Bundesliga J1 League
A-League
2017/18
A-League
2016/17
MLS
J1 League
A-League
2017/18
A-League
2016/17
MLS
J1 League
A-League
2017/18
A-League
2016/17
MLS
J1 League
Bundesliga
Bundesliga
Bundesliga
Percentage A-League 2016/17 MLS
of goals
25%
Through balls per match Offsides per match Dribbles per match
Percentage of
20% dribbles successful
40.5
4.73
4.20 4.38 33.9 33.7
1.08 4.01
15% 3.84
0.91
0.83 23.8
0.75
10%
54.4%
37.6%
44.3%
5%
53.2%
Creation
A-League
2017/18
MLS
J1 League
A-League
2017/18
MLS
J1 League
A-League
2017/18
A-League
2016/17
MLS
J1 League
Bundesliga
Bundesliga
Bundesliga
0-15 16-30 31-HT HT-60 61-75 76-FT
Minute
The A-League does not feature more shots especially on the break) or an imbalance in It is worth considering, then, to what
than other leagues, but rather a higher shot the quality of attacking players compared extent the nature of the marquee system is
The A-League continues to be a high-scoring league by global standards, with over 3 goals conversion rate. This is partly (but not wholly) to the defenders and goalkeepers trying to contributing to restricted opportunities for
per game on average, and a lower ratio of goalless draws than other leagues. explained by a higher incidence of penalties in stop them, due to the abundance of foreign Australian attackers, especially in light of the
the A-League. marquees in the attacking positions. The fact Socceroos’ inability to score from open play in
The other leagues analysed all see a much higher ratio of goals scored towards the end of that the A-League had the highest percentage Russia.
matches, whereas this season the A-League saw a more even spread of scoring throughout It could also relate to tactics (more open of dribbles successful lends weight to the
26 the game, with 48.1% of goals scored in the first half (compared to 36.6% in the J1 League). teams allowing higher quality chances, second theory.
27Passing Possession
Passes per match Percentage of passes in Average possession for
attacking half top 2 possession teams A-League club
Bayern Munich 66.5%
890.9 897.2 910.4
854.5 856.0
Urawa Red Diamonds 61.7%
58.5%
56.7% 56.0% Borussia Dortmund 59.9%
53.0% 54.2%
80.0%
78.6%
79.4% Kawasaki Frontale 59.9%
75.8%
76.9%
Atlanta United 57.8%
Sporting Kansas City 57.6%
Western Sydney Wanderers 53.4%
Sydney FC 53.3%
A-League
2017/18
A-League
2016/17
MLS
J1 League
A-League
2017/18
A-League
2016/17
MLS
J1 League
Bundesliga
Bundesliga
Percentage of
Average possession for
passes successful top 2 placed teams A-League club
Percentage of passes forward Percentage of passes long Bayern Munich 66.5%
Kawasaki Frontale 59.9%
13.9%
38.4% 37.9% 37.6% 12.9% New York City FC 55.8%
37.7% 12.2% 12.0% 11.8%
32.8%
Kashima Antlers 55.0%
Sydney FC 53.3%
Toronto FC 51.8%
Newcastle Jets 48.0%
A-League
2017/18
A-League
2016/17
MLS
J1 League
A-League
2017/18
A-League
2016/17
MLS
J1 League
Bundesliga
Bundesliga
Schalke 46.2%
28 29Defending Yellow cards per match Fouls per yellow card Referee assessment:
For the first time, this season we added
a referee assessment to our post-match
4.39 10.51 survey of selected players, which also
3.90 rates the pitch and atmosphere.
3.30 3.47 8.43 After every match, players were asked
Interceptions per match Tackles per match 7.59 7.60
6.85 to rate three criteria out of five (with five
2.40 being the best) regarding the referee’s
performance. The average scores
39.3 across the season were as follows:
35.5 36.5 36.8 36.1
28.3
Getting the big
decisions right: 3.2
25.6 26.0 25.7
A-League
2017/18
A-League
2016/17
MLS
J1 League
A-League
2017/18
A-League
2016/17
MLS
J1 League
Bundesliga
Bundesliga
23.1
Communication
with players: 3.1
Red cards per match Penalties per match
Protecting
player safety: 3.5
Refereeing
0.24 0.23
0.21 0.40
0.38
A-League
2017/18
A-League
2016/17
MLS
J1 League
A-League
2017/18
A-League
2016/17
MLS
J1 League
Bundesliga
Bundesliga
Opta’s data shows that compared to
0.30 0.31 global leagues, the A-League has a high
0.14 incidence of fouls, yellow and red cards,
fewer fouls before a yellow is shown,
and more penalties. Of course, further
0.18 analysis would be required to discern
0.08 whether our referees are overzealous
Fouls per match or our players are committing more
offences.
Interestingly, the A-League saw a slight
decrease in the number of penalties
29.6 30.0 awarded from the previous season even
A-League
2017/18
A-League
2016/17
MLS
J1 League
A-League
2017/18
A-League
2016/17
MLS
J1 League
Bundesliga
Bundesliga
27.8 though the introduction of VAR has been
credited with the spike in penalties at
24.5 25.2 the 2018 World Cup.
53.2% The PFA conducted a number of player
surveys regarding the VAR throughout the
season. One third the way through the season,
there was near universal opposition to the
VAR from players.
29.0%
By the end of the season (shown here) there
was a softening of that position but still a
17.7% majority opposed to the use of VAR in the
A-League
2017/18
A-League
2016/17
MLS
J1 League
Bundesliga
A-League.
A-League Survey
Do you think the Video Assistant Referee
(VAR) should continue to be used in the
30 A-League Yes No Not Sure
31Snapshot
Injury
Report
Since 2005, the PFA’s A-League Injury Report The total number of injuries jumped from 130 the large share of injuries in two particular
has been a fundamental tool in the PFA’s efforts to 160 and the total number of matches missed clubs. One club, Perth Glory, had a particularly
to ensure the health and safety of our members. grew from 653 to 721. Our estimated cost of taxing schedule in the early part of the season,
The Report has underpinned the PFA’s advocacy injuries jumped from $3.9m to $5.3m. while the other club (which we won’t identify
for fairer scheduling, safer playing surfaces and here) favoured poorly in the players’ end-of-
improved conditions at clubs, headlined by the There is no one simple explanation for this season assessment of relevant operations and
introduction of the Minimum Medical Standards result. Luck may always play a role. There resources within that club.
in 2011. could also be a positive angle to an upswing in
reported injuries if it means clubs are being The PFA will use this and other data as we
This season’s Report has identified an uptick more cautious with players and more proactive continue to collaborate with clubs to improve
in injuries compared to the past few seasons, in managing injuries. outcomes for players.
going against a general trend towards fewer
injuries since the Minimum Medical Standards However a spike in hamstring, quad and groin
were introduced. injuries warrants further analysis, as does
32 33Methodology Concussion 1
2
Number
of injuries
(2016/17)
1
4
Matches
missed
(2016/17)
Knee injuries decreased by 50% from
2016/17, highlighting the scale of the
increase in other types of injuries in
Illness 9
6
Number
of injuries
(2016/17)
9
20
Matches
missed
(2016/17)
2017/18.
During the 2017/18 season, the PFA recorded
Collar-Bone 1 Number
of injuries 11 Matches
missed Shoulder 2 Number
of injuries 21 Matches
missed
the occurrence of injuries by collating data
from official, publicly available sources such N/A (2016/17) N/A (2016/17) 2 (2016/17) 25 (2016/17)
as the A-League and club websites and media
releases, and some direct player feedback.
For this Report, injury was defined in terms of
official A-League matches missed as a result of Back 5 Number
of injuries 8 Matches
missed Arm 0 Number
of injuries 0 Matches
missed
any physical complaint sustained during training
or a competitive game. 1 (2016/17) 12 (2016/17) 2 (2016/17) 6 (2016/17)
The cost of a match missed due to injury for
each club was calculated by dividing each club’s
total player payments (within the salary cap) by
432, which is the number of players the club is
required to list on its team sheets across the
Ribs 1 Number
of injuries 4 Matches
missed Hand 1 Number
of injuries 23 Matches
missed
season (16 players per match x 27 matches). N/A (2016/17) N/A (2016/17) N/A (2016/17) N/A (2016/17)
This formula is designed to estimate costs on a
conservative basis since it does not include the
cost of players outside the salary cap (including
marquees), matches missed in the A-League
Finals Series, AFC Champions League and
Abdominal 0 Number
of injuries 0 Matches
missed Unstated 4 Number
of injuries 5 Matches
missed
the FFA Cup, and the cost of medical care and N/A (2016/17) N/A (2016/17) 19 (2016/17) 29 (2016/17)
treatment to injured players.
The accuracy of the results is dependent on
2 2 11 72
the accuracy of the information sources from
Hip Quad
Number Matches Number Matches
which it is derived. Accordingly, the PFA does of injuries missed of injuries missed
not warrant that the results are an exact and
complete record of player injuries. They are, 5 (2016/17) 14 (2016/17) 9 (2016/17) 45 (2016/17)
however, an accurate summation of the publicly
available information provided by FFA and club
sources.
Groin 18 Number
of injuries 60 Matches
missed Hamstring 36 Number
of injuries 130 Matches
missed
7 (2016/17) 19 (2016/17) 18 (2016/17) 67 (2016/17)
Knee 20 Number
of injuries 167 Matches
missed Adductor 3 Number
of injuries 4 Matches
missed
30 (2016/17) 244 (2016/17) N/A (2016/17) N/A (2016/17)
Location Leg 4 Number
of injuries 14 Matches
missed Calf 18 Number
of injuries 44 Matches
missed
of Injuries
2 (2016/17) 3 (2016/17) 5 (2016/17) 16 (2016/17)
Ankle 15 Number
of injuries 103 Matches
missed Achilles 0 Number
of injuries 0 Matches
missed
14 (2016/17) 75 (2016/17) 4 (2016/17) 39 (2016/17)
TOTAL 160 Number
of injuries 721 Matches
missed Heel 0 Number
of injuries 0 Matches
missed Foot 9 Number
of injuries 43 Matches
missed
130 (2016/17) 653 (2016/17) N/A (2016/17) N/A (2016/17) 4 (2016/17) 35 (2016/17)Number of injuries by
season
200
190
180
170
160
150
140
130
120
110
100
2010/11
2011/12
2012/13
2013/14
2014/15
2015/16
2016/17
2017/18
Average number of
players unavailable
each game per club
3.5
3.25
3
Comparison
2.75
2.5
2.25
2
1.75
1.5
Injury
1.25
1
2010/11
2011/12
2012/13
2013/14
2014/15
2015/16
2016/17
2017/18
36PFA
Player
Development Better Careers
Program Better Lives
Better Futures
PFA Player
Development
Program
Established by the PFA in 2013,
the mission of the PFA Player
Development Program is to
develop, support and empower
our people. Taking a holistic
approach, the program is
committed to ensuring that PFA
members can achieve excellence
in all aspects of their lives and
have the necessary support to
assist them in times of need.
For more information please visit
pfa.net.au/player-development-
program
“The program is not about offering us a
viable Plan B, in case of the worst-case
scenario. It is about making Plan A –
having the best possible life – better”
Alex Wilkinson | PFA President
38 39Courage
World Class
Intelligence
Trust
Respect
Professional Footballers Australia p 1300 650 497
2/55 Walsh Street e info@pfa.net.au
West Melbourne VIC 3003 www.pfa.net.auYou can also read


