Applicability of Remote Sensing-Based Vegetation Water Content in Modeling Lightning-Caused Forest Fire Occurrences - MDPI
←
→
Page content transcription
If your browser does not render page correctly, please read the page content below
International Journal of
           Geo-Information

Article
Applicability of Remote Sensing-Based Vegetation
Water Content in Modeling Lightning-Caused Forest
Fire Occurrences
Masoud Abdollahi 1 , Ashraf Dewan 2 and Quazi K. Hassan 1, *
 1    Department of Geomatics Engineering, Schulich School of Engineering, University of Calgary, 2500
      University Dr. NW, Calgary, AB T2N 1N4, Canada; abdolahi@ucalgary.ca
 2    Spatial Sciences Discipline, School of Earth and Planetary Sciences, Curtin University, Kent St, Bentley,
      WA 6102, Australia; A.Dewan@curtin.edu.au
 *    Correspondence: qhassan@ucalgary.ca; Tel.: +1-403-220-9494

 Received: 21 February 2019; Accepted: 15 March 2019; Published: 18 March 2019

 Abstract: In this study, our aim was to model forest fire occurrences caused by lightning using the
 variable of vegetation water content over six fire-dominant forested natural subregions in Northern
 Alberta, Canada. We used eight-day composites of surface reflectance data at 500-m spatial resolution,
 along with historical lightning-caused fire occurrences during the 2005–2016 period, derived from
 a Moderate Resolution Imaging Spectroradiometer. First, we calculated the normalized difference
 water index (NDWI) as an indicator of vegetation/fuel water content over the six natural subregions
 of interest. Then, we generated the subregion-specific annual dynamic median NDWI during
 the 2005–2012 period, which was assembled into a distinct pattern every year. We plotted the
 historical lightning-caused fires onto the generated patterns, and used the concept of cumulative
 frequency to model lightning-caused fire occurrences. Then, we applied this concept to model the
 cumulative frequencies of lightning-caused fires using the median NDWI values in each natural
 subregion. By finding the best subregion-specific function (i.e., R2 values over 0.98 for each subregion),
 we evaluated their performance using an independent subregion-specific lightning-caused fire
 dataset acquired during the 2013–2016 period. Our analyses revealed strong relationships (i.e., R2
 values in the range of 0.92 to 0.98) between the observed and modeled cumulative frequencies of
 lightning-caused fires at the natural subregion level throughout the validation years. Finally, our
 results demonstrate the applicability of the proposed method in modeling lightning-caused fire
 occurrences over forested regions.

 Keywords: cumulative frequency; fuel/vegetation moisture content; natural subregions; normalized
 difference water index; Moderate Resolution Imaging Spectroradiometer (MODIS); surface reflectance

1. Introduction
       Human beings consider forest fires to be critical natural hazards, which damage the ecosystem
and impact the economy throughout the world, including in Canada. During the last 25 years, Canada
has experienced an average of 8300 fire occurrences that have burnt 2.3 million hectares of forested
land every year [1]. Furthermore, Canada spends between $500 million and $1 billion to suppress
forest fires every year [1]. In fact, the three most influential factors causing fires are (i) source of ignition
(i.e., either lightning strikes or human activities); (ii) fuel condition; and (iii) weather regime [2]. Of the
ignition sources, lightning-caused fires are relatively less frequent in Canada, but with higher impact
compared to human-caused occurrences. For example, lightning-caused fires constitute ~45% of total
fires on a national level, but account for ~80% of the total burnt area [3,4]. However, in Canada, the
boreal forest occupies a significant proportion of forested land, where lightning-caused fires play a

ISPRS Int. J. Geo-Inf. 2019, 8, 143; doi:10.3390/ijgi8030143                            www.mdpi.com/journal/ijgi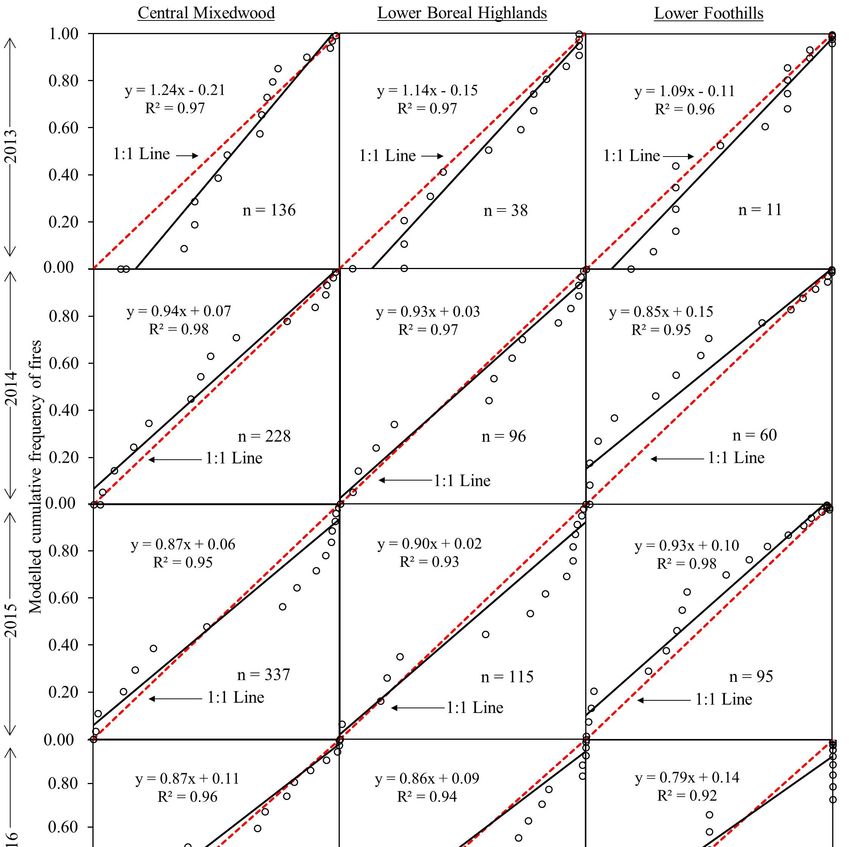
ISPRS Int. J. Geo-Inf. 2019, 8, 143                                                                    2 of 16

vital role in the natural succession of ecosystem functions [5]. Therefore, it is worthwhile to study
lightning-caused forest fire occurrences in Canada to formulate fire management strategies that are
better and more effective.
       In recent decades, researchers have put significant efforts into studying/modeling
lightning-caused fire events. For example, Wotton and Martell [6] modeled lightning-caused fires
in Ontario, Canada at 20-km spatial resolution over the 1992–2003 period. They used eight input
variables, such as: (i) weather, i.e., relative humidity and wind speed; (ii) fire weather indices, i.e., fine
fuel moisture code, duff moisture code, drought code, initial spread index, and head fire intensity; and
(iii) probability of sustained ignition, to derive the coefficients for a logistic regression model. However,
validation showed a relatively weak relationship (R2 = 0.44) between the modeled and observed values.
In another study conducted over the Daxinganling Mountains of Northeastern China, Chen et al. [7]
predicted lightning-caused fire occurrences at 1-km spatial resolution during the 2005–2010 period. In
this case, they used several datasets, including: (i) historical fire data, i.e., number of lightning strikes
and lightning current intensity; (ii) meteorological data, i.e., rainfall, temperature, relative humidity,
and wind speed; (iii) topographical elements, i.e., elevation, slope, and aspect; and (iv) fuel type,
i.e., larch forest, Scots pine forests, mixed forest with larch, birch and oak trees, mixed forest with
Scots pine, birch and oak trees, and grass. Combining the obtained information at the level of grid
cells and using 70% of the historical lightning-caused fires as model training, Chen et al. generated
a fire risk map comprised of five classes: very low to very high. They reported that the variables
of rainfall, number of lightning strikes, and lightning current intensity were the most significant
predictors. Furthermore, for the study conducted over a mountainous area in China, Liu et al. [8]
generated a lightning-caused fire risk map with five risk classes at 0.5◦ spatial resolution based on:
(i) three remote sensing-derived dynamic indices, i.e., temperature condition, vegetation condition,
and water condition; and (ii) two static indices, i.e., topography and lightning density during the
2000–2006 period. Overlaying the observed lightning-caused fires during the same time period on the
derived fire risk map revealed that ~69% of the fires fell under the top three classes, i.e., relatively high,
high, and extremely high. In addition, over Alberta, Canada, Cha et al. [9] analyzed the spatial and
temporal patterns of lightning strikes based on landscape properties, i.e., elevation, slope, soil type,
and land use to generate a lightning hazard map during the 2010–2014 period. Upon analyzing the
lightning strikes’ temporal distribution, i.e., occurring hours and months, they identified two thematic
maps. The first one consisted of 10 classes based on elevation, slope, and soil type map, whereas the
second consisted of 15 classes based on land-use map. To find their association with the lightning
strikes, they generated a lightning hazard map based on the similarities between those landscape
properties at the lightning strike points during the 2010–2014 period. However, at the validation phase,
this hazard map captured only 47% of the observed lightning strikes in high-risk areas during the
2015–2016 period. Furthermore, in case of the forested areas in Alberta, Canada, Abdollahi et al. [10]
attempted to model the potential spatial pattern of lightning-caused fires at 3-km spatial resolution
during the 1961–2000 period. Then, they overlaid the lightning-caused fire spots over the gridded
study area map, and generated a static fire danger (SFD) map by considering the lightning-caused fire
pixels as high danger locations. Despite taking such a big area around each observed fire spot (i.e.,
9 km2 ), their generated SFD map only captured ~38% of the fires when compared to an independent
validation dataset during the 2001–2014 period.
       In general, the literature suggests that three issues are associated with the study of
lightning-caused fires. (i) First, the developed models/maps showed reasonable results during
the calibration phase; however, they exhibited poor performance during the model validation phase.
This challenge might be related to lightning strike locations being random and highly dependent
on atmospheric conditions [11,12]. (ii) Second, these models require many input variables for
development. (iii) Finally, the use of a large cell size affected the retrieval of a distinct spatial
pattern for lightning-caused fires. In addition, the vegetation/fuel condition might be useful to
predict fire occurrences, as reported by Krawchuk et al. [13]. Therefore, previous studies have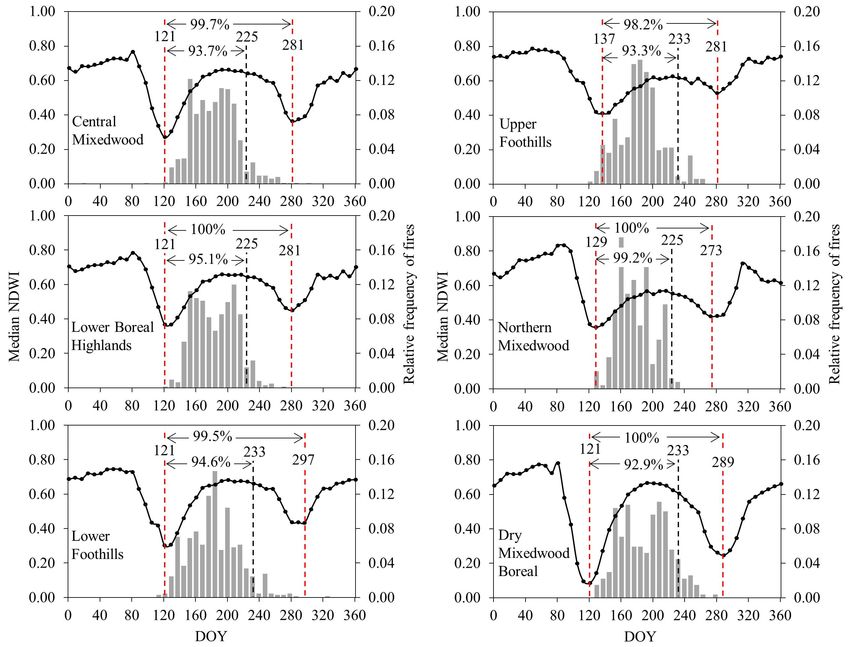
ISPRS Int. J. Geo-Inf. 2019, 8, 143 3 of 16
suggested that remote sensing indices could be used to delineate vegetation conditions, such as
the normalized difference water index (NDWI: a measure of vegetation wetness), and normalized
difference vegetation index (NDVI: a measure of vegetation greenness). Between these two indices, the
NDWI hasISPRS beenInt. J. Geo-Inf. 2019, 8, x FOR PEER REVIEW
widely used in fire-related studies, such as forest fire vulnerability mapping 3 of 16
[14], fire
danger condition [10], fire risk prediction [15,16], fire behavior prediction
vegetation index (NDVI: a measure of vegetation greenness). Between these two indices, the NDWI [17], post-fire evaluation and
vegetationhasresponse
been widely[18,19], used andin the beginning
fire-related of the
studies, suchfire
as season
forest fire [20,21]. In addition,
vulnerability mappingit [14],
has been
fire applied
to the studydanger condition [10],
of vegetation fire riskstages,
growth prediction [15,16],
such fire behavior needle
as coniferous prediction [17], post-fire
flushing [22],evaluation
understory grass
and vegetation response [18,19], and the beginning of the fire season [20,21]. In addition, it has been
green stage [23], and deciduous leaf out [24], which might be associated with fire occurrences. Other
applied to the study of vegetation growth stages, such as coniferous needle flushing [22], understory
studies have employed
grass green stageNDVI [23], and todeciduous
study/modelleaf outfire
[24],occurrences
which might be [25,26]. However,
associated compared to NDVI
with fire occurrences.
(calculatedOther
using
studiesred have
andemployed
near-infrared
NDVI towavelengths), NDWI (using
study/model fire occurrences [25,26].shortwave and near-infrared
However, compared to
NDVI (calculated using red and near-infrared wavelengths),
wavelengths) might depict the canopy moisture conditions much better [27]. Therefore, the use of NDWI (using shortwave and
near-infrared wavelengths) might depict the canopy moisture conditions much better [27].
NDWI for modeling lightning-caused forest fires deserves further investigation.
Therefore, the use of NDWI for modeling lightning-caused forest fires deserves further
Considering the above-mentioned issues, our overall aim was to model lightning-caused fire
investigation.
occurrences using remote
Considering thesensing-derived
above-mentioned issues, NDWI ourvalues in 21
overall aim wasnatural
to modelsubregions in the
lightning-caused fireCanadian
province ofoccurrences
Alberta (Figureusing remote1). We sensing-derived NDWIsteps
established three valueswhile
in 21 natural
executingsubregions in theFirst,
our goal. Canadian
we calculated
province of Alberta (Figure 1). We established three steps while executing our goal. First, we
the median NDWI value over each subregion at an eight-day time-scale for the 2005–2016 period.
calculated the median NDWI value over each subregion at an eight-day time-scale for the 2005–2016
Second, weperiod.
created a unique
Second, NDWI
we created profileNDWI
a unique for each subregion
profile using calculated
for each subregion value averages
using calculated value from
the first step of thefrom
averages calibration
the first dataset,
step of thei.e.,calibration
2005–2012. Finally,
dataset, i.e., we modeled
2005–2012. lightning-caused
Finally, we modeled fires by
plotting thelightning-caused
observed fires fires
ontoby plotting the observed
the outcomes fires ontosteps
of previous the outcomes of previous dataset,
in the calibration steps in the
followed by
calibration dataset, followed by validation using an independent dataset during the 2013–2016
validation using an independent dataset during the 2013–2016 period.
period.
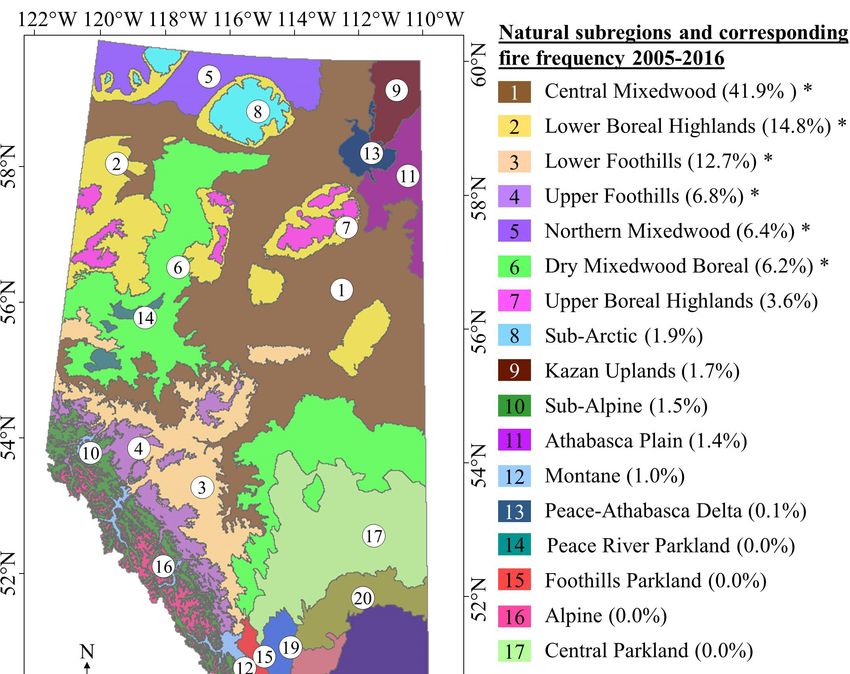
Figure 1. Geographic
Figure 1. Geographic extent extent of the
of the 2121natural
natural subregions
subregions of Alberta, which are
of Alberta, categorized
which based on
are categorized based
climate, geology, topography, and vegetation. The parentheses values in the legend represent the
on climate, geology, topography, and vegetation. The parentheses values in the legend represent
subregion-specific relative frequencies for all of the lightning-caused fire events during the 2005–
the subregion-specific
2016 period. relative frequencies for all of the lightning-caused fire events during the
2005–2016 period.
2. Study Area and Data Requirements
We considered the province of Alberta (between 49–60◦ N latitude and 110–120◦ W longitude)
in the central-west region of Canada. The province is categorized as subarctic, humid continental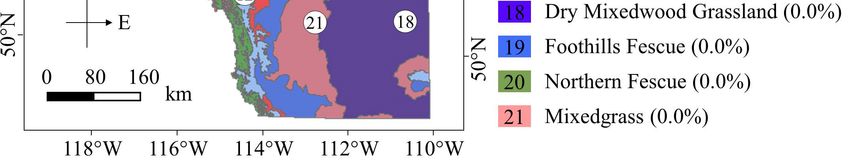
ISPRS Int. J. Geo-Inf. 2019, 8, 143                                                                                       4 of 16

climate, semi-arid, and tundra region based on Köppen climate classification [28], with an annual
mean temperature and precipitation variation from −7.1 to 6 ◦ C, and 260 to 1710 mm [29], respectively.
Topographically, the region is variable, i.e., ranging from 150 to 3650 m above mean sea level. In terms
of vegetation coverage, the province exhibits primarily boreal forest composed of deciduous and
coniferous tress, grasslands, parklands, etc. [29]. On the basis of climate, topography, geology, and
vegetation, the province was divided into 21 natural subregions (see Figure 1 for their geographical
extent). Among those, we selected six subregions, each of which not only experienced at least 5% the
total number of lightning-caused fire incidences during the 2005–2016 period, but also constituted ~89%
of the total lightning-caused fires across the province during the 2005–2016 period. These subregions
included: (i) Central Mixedwood; (ii) Lower Boreal Highlands; (iii) Lower Foothills; (iv) Upper
Foothills; (v) Northern Mixedwood; and (vi) Dry Mixedwood Boreal. Table 1 shows information on
the dominant vegetation type and the percentage of fire occurrences caused by lightning strikes in
each subregion of interest during the 2005–2016 period.

      Table 1. Description of the dominant vegetation type and the percentage of fire occurrences caused by
      lightning strikes in each subregion of interest.

                                                                                          % of Fires Caused by Lightning
           Natural Subregion                       Dominant Vegetation Type
                                                                                             Strikes during 2005–2016
          Central Mixedwood                                    Aspen                                     42
       Lower Boreal Highlands                      Lodgepole pine and jack pine                          15
                                                   A mixed of aspen–lodgepole
               Lower Foothills                                                                           13
                                                       pine–white spruce
               Upper Foothills                           Lodgepole pine                                   7
                                               A mixed of aspen, white spruce,
         Northern Mixedwood                                                                               6
                                                     and black spruce
                                              A combination of cultivated areas
        Dry Mixedwood Boreal                                                                              6
                                                     and aspen forests

     In this study, we used three different types of datasets: (i) Terra Moderate Resolution Imaging
Spectroradiometer (MODIS)-derived eight-day composites of surface reflectance; (ii) ground-based
historical lightning-caused fire occurrences, which had the approximate latitude and longitude
information for every fire point of initiation; and (iii) geographic information system (GIS)-based
layers. Table 2 provides a brief description of these datasets.

                                      Table 2. Description of the data used in this study.

  Data Type              Source                       Period       Specification                  Utilization
  Remote sensing         NASA                         2005–2016    Eight-day composite of         Employed to generate
                                                                   surface reflectance (i.e.,     subregion-specific NDWI
                                                                   MOD09A1) at 500-m              over our study area
                                                                   spatial resolution             of interest
                         Alberta Forest Service,      2005–2012    Historical lightning-caused    Used as calibration dataset
  Ground
                         Govt. of Alberta                          fire dataset consisting of     for model development
                                                                   3905 fires
                                                      2013–2016    Historical lightning-caused    Employed as validation
                                                                   fire dataset consisting of     dataset for model validation
                                                                   1826 fires
                         Alberta Forest Service,                   Geographical boundary          Used to clip the
  GIS layers                                          2006
                         Govt. of Alberta                          of Alberta                     calculated NDWI
                                                                   Natural subregions of          Used to subdivide
                                                                   Alberta at 250-m               lightning-caused fire
                                                                   spatial resolution             occurrences at the
                                                                                                  subregion level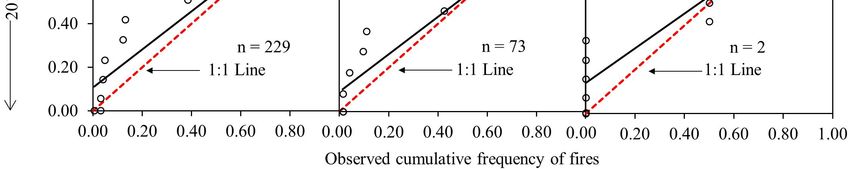
ISPRS Int. J. Geo-Inf. 2019, 8, 143 5 of 16
ISPRS Int. J. Geo-Inf. 2019, 8, x FOR PEER REVIEW 5 of 16
3.3.Methods
Methods
Figure
Figure22shows
showsaaschematic
schematicdiagram
diagramof ofthe
themethod
methodapplied
appliedin inthis
thisstudy,
study, which
which consisted
consistedofof
three
threecomponents:
components:(i)(i)the
thepreprocessing
preprocessingofof
lightning-caused
lightning-causedfirefire
occurrences;
occurrences;(ii)(ii)
thethe
preprocessing of
preprocessing
the satellite
of the data;
satellite andand
data; (iii)(iii)
model development
model development and validation.
and validation.EachEachofofthese
thesecomponents
componentsisisbriefly
briefly
described
describedin inthe
thefollowing
followingsubsections.
subsections.
Schematicdiagram
Figure2.2.Schematic
Figure diagramillustrating
illustratingthe
theproposed
proposedmethod
methodininthis
thisstudy
study(a);
(a);and
andthe
thepattern
patternfor
for
annual NDWI profile modified according to Sekhon et al. [20]
annual NDWI profile modified according to Sekhon et al. [20] (b). (b).
3.1. Preprocessing of Lightning-Caused Fire Occurrences
3.1. Preprocessing of Lightning-Caused Fire Occurrences
In this phase, we first converted the dates of fire occurrences into the day of year (i.e., DOY:
In this phase, we first converted the dates of fire occurrences into the day of year (i.e., DOY:
ranging from 1 to 365/366 based on normal/leap year). We then transformed the calculated DOY
ranging from 1 to 365/366 based on normal/leap year). We then transformed the calculated DOY
values into a set number of eight-day periods using Equation (1) [20], where such conversion would
values into a set number of eight-day periods using Equation 1 [20], where such conversion would
align the timing of the lightning-caused fire occurrence with the employed remote sensing-derived
align the timing of the lightning-caused fire occurrence with the employed remote sensing-derived
index (i.e., NDWI).
index (i.e., NDWI).
DOY − 1
P= +1 (1)
DOY − 1 8
P= +1 (1)
8
where P is the period in which each fire occurrence is recorded. In this study, the P varied from one
where P iseach
to 46 for the period in which
year when eachtofire
rounded occurrence
integer values.is Upon
recorded. In this study,
transforming the
these P variedwe
datasets, from one
clipped
to 46 for
both the each year when
calibration rounded tofire
and validation integer values.
datasets Upon
by the transforming
Alberta these datasets,
natural subregion wetoclipped
GIS layer get the
both the calibrationfire
subregion-specific andoccurrences.
validation fire datasets
Finally, by the Alberta
we calculated naturalfrequency
the relative subregionofGIS
firelayer to get the
occurrences for
subregion-specific fire occurrences.
each year during the 2005–2016 period. Finally, we calculated the relative frequency of fire occurrences
for each year during the 2005–2016 period.
3.2. Preprocessing Satellite Data
3.2. Preprocessing Satellite Data
Upon downloading the eight-day composites of surface reflectance images, we extracted the bands
centered
Uponatdownloading
0.860 µm, i.e., the
the near-infrared (NIR) wavelength,
eight-day composites of surfaceand 2.130 µm, images,
reflectance i.e., the shortwave-infrared
we extracted the
(SWIR)centered
bands wavelength, which
at 0.860 were
μm, later
i.e., theused to calculate(NIR)
near-infrared the annul time series
wavelength, of NDWI
and images
2.130 μm, i.e.,using
the
Equation (2). Although
shortwave-infrared it would
(SWIR) be possible
wavelength, to use
which other
were shortwave
later infrared spectral
used to calculate the annulbands,
time we opted
series of
NDWI images using Equation 2. Although it would be possible to use other shortwave infrared
spectral bands, we opted to use the 2.130-μm wavelength in this study. This was because it agreedISPRS Int. J. Geo-Inf. 2019, 8, 143 6 of 16
to use the 2.130-µm wavelength in this study. This was because it agreed with the ‘snow disappearance’
timing at the beginning of the fire/growing season over the same study area [20].
ρNIR − ρSWIR
NDWI = (2)
ρNIR + ρSWIR
where ρ is surface reflectance value for NIR and SWIR spectral bands. Upon generating the NDWI
images for the study area, we split the annul time series of NDWI images using the Alberta natural
subregion GIS layer that facilitated the study of NDWI at a subregion level. Finally, we divided these
datasets into two groups: (i) a 2005–2012 dataset for model development; and (ii) a 2013–2016 dataset
for model validation.
3.3. Model Development and Validation
In this phase, we assumed that the annual NDWI time series over each subregion depicts a distinct
pattern similar to other literature reports [20]. According to this assumption, the NDWI value remains
almost constant at its maximum values during the winter time, and then starts to drastically decrease
at the onset of the spring until it reaches a minimum annual value known as the snow disappearance
time period (see panel b in Figure 2). Then, the NDWI value begins to increase gradually due to
progress in the growing season until it reaches its maximum value at the peak of the growing season.
Then, the NDWI experiences a moderate decrease until snowfall commences, after which the NDWI
increases and continues until the end of the year.
In order to evaluate the above-mentioned assumption, we calculated the subregion-specific
median NDWI values at eight-day intervals for each year during the 2005–2012 period over the selected
six natural subregions of interest. We used median NDWI values that would be unaffected either
because of their very small or extremely large values [30]. Then, we calculated the subregion-specific
patterns by averaging the NDWI values at each eight-day time-period, and plotted them—along with
the relative frequencies of the lightning-caused fires that occurred during the same time period—over
the six natural subregions of interest individually. Based on these patterns, we determined the
subregion-specific start date for lightning-caused fire seasons using median NDWI values. We observed
a temporal pattern in lightning-caused fire occurrences within the eight-day time period during the
growing season in the six natural subregions individually. However, these patterns were highly
variable from one year to another. Therefore, we used the concept of cumulative frequency values for
the variables of interest, which has been widely applied in the remote sensing literature [31–35]. In this
case, we calculated the cumulative frequency (i.e., by summing up the extracted/calculated values at
eight-day intervals) for both the lightning-caused fires and NDWI values. The results showed that
in all six natural subregions, >98% of lightning-caused fires commenced with the snow disappearing
date (i.e., start of the fire season) until the next snowfall. Furthermore, ~90% of lightning-caused
fires occurred during the period from the snow disappearing date until the growing season’s peak.
Consequently, we established the relationship between these two cumulative frequencies for the six
natural subregions individually during the entire growing season.
Upon obtaining the subregion-specific relationships, we evaluated their performances using an
independent validation dataset (see Table 2 for details). We modeled the cumulative frequency of
lightning-caused fire occurrences using cumulative median NDWI values in every year during the
validation phase, i.e., 2013–2016, by employing the obtained subregion-specific function as illustrated
in the last paragraph. In order to assess the model’s accuracy, we used linear regression analysis and
root mean square error.ISPRS Int. J. Geo-Inf. 2019, 8, 143 7 of 16
4. Results
4.1. Annual Dynamic of NDWI Values
ISPRS Int. J. Geo-Inf. 2019, 8, x FOR PEER REVIEW 7 of 16
Figure 3 shows the subregion-specific eight-day median values of NDWI dynamics for every year
during the 2005–2012 period. We found that the annual patterns were similar for all the subregions
subregions compared throughout the years. Due to these similarities, we calculated an average
compared throughout the years. Due to these similarities, we calculated an average annual pattern
annual pattern of the eight-day NDWI values for the six natural subregions of interest individually.
of the eight-day NDWI values for the six natural subregions of interest individually. Based on these
Based on these patterns, we identified the critical stages: (i) winter time, when the mean NDWI
patterns, we identified the critical stages: (i) winter time, when the mean NDWI values were the
values were the highest in that given year; (ii) the onset of spring, when the mean NDWI values
highest in that given year; (ii) the onset of spring, when the mean NDWI values began to fall; (iii) the
began to fall; (iii) the snow disappearance date, when the median’s annual minimum for NDWI
snow disappearance date, when the median’s annual minimum for NDWI values occurred; (iv) the
values occurred; (iv) the growing season, when the median NDWI values had a symmetrical hump
growing season, when the median NDWI values had a symmetrical hump and there were clearly
and there were clearly less values than in the winter time; (v) the peak of the growing season, where
less values than in the winter time; (v) the peak of the growing season, where median NDWI values
median NDWI values reached their maximum during the fire season; (vi) the commencement of
reached their maximum during the fire season; (vi) the commencement of snowfall, when the median
snowfall, when the median NDWI values had another minimum after the growing season, but not as
NDWI values had another minimum after the growing season, but not as low as its annual minimum
low as its annual minimum at the onset of spring; and (vii) the fall season, when NDWI values
at the onset of spring; and (vii) the fall season, when NDWI values increased again.
increased again.
Figure 3. Median NDWI patterns for the six natural subregions individually for every year during the
Figure 3. Median NDWI patterns for the six natural subregions individually for every year during
calibration time-period (i.e., 2005–2012).
the calibration time-period (i.e., 2005–2012).
4.2. Subregion-Specific Lightning-Caused Fire Season Dynamic
4.2. Subregion-Specific Lightning-Caused Fire Season Dynamic
Figure 4 shows the subregion-specific lightning-caused fires’ relative frequency distribution
Figure 4 shows
(i.e., at eight-day the subregion-specific
time-period lightning-caused
during the 2005–2012 fires’
period), and relativeprofile
the annual frequency distribution
of median NDWI,
(i.e., at eight-day time-period during the 2005–2012 period), and the annual profile of median NDWI,
as described in the previous subsection. We noticed that very little fire (i.e., less than 2%) occurred
as described
before in the
the snow previous subsection.
disappearance stage. We noticed that very little fire (i.e., less than 2%) occurred
before the snow disappearance stage.ISPRS Int. J. Geo-Inf. 2019, 8, 143 8 of 16
ISPRS Int. J. Geo-Inf. 2019, 8, x FOR PEER REVIEW 8 of 16
Figure4.4.Lightning-caused
Figure Lightning-causedfires’
fires’relative
relative frequency
frequency distribution (i.e., at eight-day
eight-day time-period
time-periodduring
during
the2005–2012
the 2005–2012 period)
period) over
over the
theannual
annualprofile
profileof of
median
median NDWI
NDWI values in six
values innatural subregions.
six natural The
subregions.
The three vertical dotted lines show the stages of snow disappearance (left red-dashed line), aroundthe
three vertical dotted lines show the stages of snow disappearance (left red-dashed line), around the
peakofofgrowing
peak growingseason
season(middle
(middleblack-dashed
black-dashed line),line), and
and snowfall
snowfall (right
(right red-dashed
red-dashedline).
line).InInaddition,
addition,
thepercent
the percentvalues
valuesshow
showthetheamount
amount of of lightning-caused
lightning-caused firefire occurrences
occurrences that
that happened
happenedbetweenbetweenthe the
snowdisappearance,
snow disappearance,asaswell
wellasas(i)
(i)around
aroundthe thepeak
peak ofof the
the growing
growing season
season and
and (ii)
(ii) snowfall
snowfall stages.
stages.
4.3.
4.3.Model
ModelDevelopment
Developmentand
andValidation
Validation
During
Duringthethemodel
modeldevelopment
development phase,
phase, we
we plotted the cumulative values of
cumulative values of median
medianNDWI
NDWIand and
lightning-caused
lightning-caused fire fire frequency
frequency against
against DOY,
DOY, over
over the six natural subregions
subregions individually,
individually, during
during
the
theentire
entiregrowing
growingseason
seasonspanning
spanning between
between snow disappearing
disappearing inin the
the spring
spring and
and snowfall
snowfallin inthethe
autumn,
autumn,as as shown Figure 5.5.ItItrevealed
shown in Figure revealed that
that both
both of the
of the cumulative
cumulative values
values of median
of median NDWI NDWI
and
lightning-caused
and lightning-caused fire fire
frequencies
frequenciesbehaved
behavedsimilarly withwith
similarly some variations
some from
variations oneone
from subregion
subregion to
toanother.
another.Due Dueto to
having
having such
suchdistinct
distinctpatterns,
patterns,wewethen applied
then polynomial
applied polynomial regression analysis
regression analysisto
todefine
definethetherelationships
relationships amongst
amongstthem (Figure
them 6). Our
(Figure analysis
6). Our showed
analysis that strong
showed relationships
that strong (i.e.,
relationships
(i.e., R2 values
R2 values in the
in range
the range0.98 0.98
to 0.99 overover
to 0.99 the subregions) existed
the subregions) between
existed the variables
between of interest.
the variables of interest.ISPRS Int. J. Geo-Inf. 2019, 8, 143 9 of 16
ISPRS Int. J. Geo-Inf. 2019, 8, x FOR PEER REVIEW 9 of 16
ISPRS Int. J. Geo-Inf. 2019, 8, x FOR PEER REVIEW 9 of 16
Figure 5.5. Dynamics
Figure Dynamics of of cumulative
cumulative values
values of
of median
median NDWI
NDWI and
and lightning-caused
lightning-causedfire
firefrequencies
frequencies
Figure 5.
against Dynamics
day of yearof cumulative
(DOY) for all values
six of
naturalmedian NDWI
subregions and
during lightning-caused
the entire growing
against day of year (DOY) for all six natural subregions during the entire growing season fire
seasonfrequencies
spanning
spanning
between
against day snow
of disappearing
year (DOY) for in
allspring
six and
naturalsnowfall in
subregions
between snow disappearing in spring and snowfall in autumn. autumn.
during the entire growing season spanning
between snow disappearing in spring and snowfall in autumn.
Figure 6. Relationships between subregion-specific cumulative values of median NDWI and
Figure 6. Relationships between subregion-specific cumulative values of median NDWI and
lightning-caused fire frequencies in all six natural subregions during the 2005–2012 period.
lightning-caused fire frequencies
Figure 6. Relationships between in all six natural subregions
subregion-specific during
cumulative the 2005–2012
values period.
of median NDWI and
During the model
lightning-caused validation
fire frequencies phase,
in all we subregions
six natural employed during
the relations shown
the 2005–2012 in Figure 6 in an
period.
During the model validation phase, we employed the relations shown in Figure 6 in an
independent validation dataset that was available and collected during the 2013–2016 period, as shown
independent
During7. thevalidationvalidation
dataset that was we
available and collected during the 2013–2016 period, as
in Figure Themodel phase,
analysis demonstrated employed
the relations the the
between relations shown
observed in Figurecumulative
and modeled 6 in an
shown in
independent Figure 7.
validationThe analysis
dataset thatdemonstrated
was the the
available relations
and collectedbetween
during the observed
the 2013–2016and modeled
period, as
frequencies of lightning-caused fires over three natural subregions of ‘Central Mixedwood’, ‘Lower
cumulative frequencies of lightning-caused fires over the three natural subregions of ‘Central
shown in Figure 7. The analysis demonstrated the relations between the observed and modeled
cumulative frequencies of lightning-caused fires over the three natural subregions of ‘CentralISPRS Int. J. Geo-Inf. 2019, 8, 143 10 of 16
ISPRS Int. J. Geo-Inf. 2019, 8, x FOR PEER REVIEW 10 of 16
Boreal Highlands’, and ‘Lower Foothills’. The remaining three subregions did not experience significant
amountsMixedwood’, ‘Lower Boreal
of lightning-caused Highlands’,
fires, and thusandwe‘Lower Foothills’.
were unable to The remaining
use them three subregions
for validation did We
purposes.
not experience significant amounts of lightning-caused fires, and thus we were unable
found that strong relationships existed over all the three subregions of interest. For example: the to use them
for validation purposes. We found that strong relationships existed over all the three subregions of
R2 , slope, and intercept values were in the ranges of: (i) 0.95 to 0.98, 0.87 to 1.24, and −0.21 to 0.11,
interest. For example: the R2, slope, and intercept values were in the ranges of: (i) 0.95 to 0.98, 0.87 to
respectively, for Central Mixedwood; (ii) 0.93 to 0.97, 0.86 to 1.14, and −0.15 to 0.09, respectively,
1.24, and –0.21 to 0.11, respectively, for Central Mixedwood; (ii) 0.93 to 0.97, 0.86 to 1.14, and –0.15 to
for Lower Boreal Highlands; and (iii) 0.92 to 0.98, 0.79 to 1.09, and −0.11 to 0.15, respectively, for
0.09, respectively, for Lower Boreal Highlands; and (iii) 0.92 to 0.98, 0.79 to 1.09, and –0.11 to 0.15,
Lower Foothills.
respectively, for Lower Foothills.
Figure 7. Comparison between the observed and modeled cumulative frequency of lightning-caused
Figure 7. Comparison between the observed and modeled cumulative frequency of lightning-caused
fire occurrences during the years 2013–2016 in the selected natural subregions. The solid and dash
fire occurrences during the years 2013–2016 in the selected natural subregions. The solid and dash
lines represent regression and a 1:1 line, respectively. n indicates the total observed
lines represent regression and a 1:1 line, respectively. n indicates the total observed subregion-specific
subregion-specific lightning-caused fire occurrences in that particular year.
lightning-caused fire occurrences in that particular year.ISPRS Int. J. Geo-Inf. 2019, 8, 143 11 of 16
5. Discussion
Figure 3 shows that the annual NDWI profiles for each subregion depicted a specific pattern
in the context of several key stages, e.g., snow disappearance date, peak of growing season, and
commencement of snowfall. In fact, our observed patterns were similar to those reported by
other studies. For example, (i) Sekhon et al. [20] studied the NDWI profile to determine the snow
disappearance stage over the Central Mixedwood subregion in Alberta, Canada during the 2006–2008
period; (ii) Delbart et al. [21] employed NDWI changes for detecting vegetation phenology over the
broadleaf forest area in Central Siberia during the 1999–2000 period; (iii) Sekhon et al. [22] analyzed
the NDWI profile to define the date of coniferous needle flushing (CNF) occurrence in boreal forested
areas in Alberta, Canada during the 2006–2008 period; and (iv) Qi et al. [36] considered NDWI changes
when monitoring the live fuel moisture in northern Utah, USA during the 2010–2011 period. Although
each subregion showed a unique pattern in this study, the timing of each critical stage differed slightly
from one subregion to another one. Furthermore, differences in the magnitude of NDWI values were
observed among subregions. Such differences might be related to the growth stages and conditions of
forest that would highly depend on the abiotic (e.g., temperature, soil water content, and nutrients
in the soil in particular) and biotic (e.g., interspecies and intraspecies competitions, and demand for
species-specific optimal growth, etc.) conditions [36–38], which would potentially differ from one
subregion to another.
As shown in Figure 4, most of the lightning-caused fires (i.e., >98%) in all of the natural subregions
happened during the growing season (i.e., from snow disappearance date in spring to the start of
snowfall in autumn). The reason for such a trend might be related to the extensive availability of fuels,
and the occurrence of the lightning storms as a fire ignition source in the region [7,39,40]. Even though
we observed that a significant proportion of the fires took place during the growing season, we also
observed a small amount of fires (i.e., 90% of
the total burn area in Alberta during the months of June through August, over the 1961–2002 period.
Once snow melts, plants start to grow in the spring, and require a significant amount of water from soil.
However, their roots are not yet active and warm enough to absorb enough water from soil, causing
water stress for plants, and rendering plants/forests more flammable [36,45]. As the growing season
progresses, the air temperature/evapotranspiration increases. However, the water deficit (if it takes
place) may not support such evapotranspiration demands, which enhance fuel’s flammability [46,47].
At the end of the peak of the growing season, all six natural subregions experienced much less
lightning-caused fires, which could be related to both the understory and overstory being fully
developed by the peak of the growing season, thereby reducing fuel flammability [44]. In addition, the
weather—in particular temperature regimes—plays an important role in influencing the vegetation
phenology [22–24]. For example, we observed that temperatures start to increase in the spring, and this
trend continues until it reaches a peak during the growing season (see Figure 6 as an example). Then,
temperatures commence a downward trend that continues until autumn. Of note, both the vegetation
index (e.g., enhanced vegetation index: EVI calculated using blue, red, and near-infrared wavelengths)
and NDWI values exhibit decreasing trends due to the temperature drop after the peak is achieved
during the growing season (Figure 8). This is the case as plants sense autumn approaching. During this
temperature decline phase, before approaching autumn, plants have enough moisture/water content,
which was initially transferred from the soil to the plants during the first part of the growing season.ISPRS Int. J. Geo-Inf. 2019, 8, 143 12 of 16
ISPRS Int. J. Geo-Inf. 2019, 8, x FOR PEER REVIEW 12 of 16
Such moisture/water content in plants might explain why the number of lightning-caused fires were
lightning-caused fires were less compared to the period from the snow disappearance date to the
less compared to the period from the snow disappearance date to the peak of the growing season [44].
peak of the growing season [44].
(a) Central Mixwood
1.0 35.0
Growing season
25.0
0.8
15.0
0.6 5.0
0.4 -5.0
NDWI -15.0
Median surface temperature ( oC)
0.2 EVI
-25.0
Surface
Median NDWI / EVI
temperature
0.0 -35.0
1 41 81 121 161 201 241 281 321 361
(b) Lower Boreal Highlands
1.0 35.0
Growing season
25.0
0.8
15.0
0.6 5.0
0.4 -5.0
-15.0
0.2
-25.0
0.0 -35.0
1 41 81 121 161 201 241 281 321 361
DOY
Figure 8. Annual NDWI and EVI profiles along with surface temperature at the eight-day
Figure 8. Annual NDWI and EVI profiles along with surface temperature at the eight-day temporal
temporal resolution over two natural subregions (i.e., Central Mixedwood and Lower Boreal
resolution over two natural subregions (i.e., Central Mixedwood and Lower Boreal Highlands) in our
Highlands)
study area in our study
during 2008. area during 2008.
OurOur findings
findings regarding
regarding thethe
relationship
relationship between
between observed
observed andandmodeled
modeled lightning-caused
lightning-caused fires
fires
areare
promising.
promising.However,
However, to the best
to the bestofofour our knowledge,
knowledge, ourour
studystudy
is theis first
the offirst of itsand
its kind, kind, and
therefore,
therefore,
comparativecomparative
analysisanalysis
of our data of our
withdata with previously
previously publishedpublished
findings was findings was not The
not possible. possible.
results
The resultsthat
showed showed that theofconcept
the concept of using cumulative
using cumulative frequencyfrequency to model lightning-caused
to model lightning-caused fire
fire occurrences
occurrences was a good approach, which was described in the literature.
was a good approach, which was described in the literature. For example, Bhuyan et al. [31] found For example, Bhuyan et al. a
[31] found a strong and positive interannual association between annual
strong and positive interannual association between annual tree-ring growth and cumulative NDVI, at tree-ring growth and
cumulative
69 study sitesNDVI, at 69the
across study sitesduring
world, across the
the 2001–2010
world, during the 2001–2010
period. Swain et al.period.
[32] foundSwain theetRal. [32]
2 values
found the R 2 values were in the range of 0.60 to 0.98 between cumulative NDVI and cumulative
were in the range of 0.60 to 0.98 between cumulative NDVI and cumulative surface temperature in
surface temperature
different farms during in different farmsseasons
the growing during of the growing
2002 seasons
and 2007 of 2002 and
in Nebraska. Cihlar 2007et in
al. Nebraska.
[35] found a
Cihlar
high et al. [35] found
correlation a 2high
(i.e., R correlation
= 0.92) between(i.e., R2 = 0.92)
cumulative between
NDVI cumulativeactual
and cumulative NDVIevapotranspiration
and cumulative
actual evapotranspiration
at a 15-day time scale over at aCanada
15-dayduringtime scale overgrowing
the 1986 Canada season.
during the 1986model
During growing season.
development
During model development
and validation, we observedand some validation,
variabilitywe observedwith
associated somethevariability
observed Rassociated
2 , slope, and with the
intercept
observed R 2, slope, and intercept values among the subregions. These variations might be related to
values among the subregions. These variations might be related to one or more of the following
one or more
reasons. (i)ofThe
theexisting
following reasons. in
differences (i)subregion-specific
The existing differences
landscape in subregion-specific
properties, in particular landscape those
properties,
related toinclimate,
particular thosetopography,
geology, related to climate, geology, [29],
and vegetation topography,
could affectand thevegetation
spatial and[29],temporal
could
affect the spatial
patterns and temporal
of lightning strikes [9]. patterns
(ii) It isof lightning
known strikes
that the [9]. (ii) It of
randomness is lightning
known that thelocations
strike randomness highly
of depends
lightningon strike locations conditions
atmospheric highly depends on(iii)
[11,12]. atmospheric
The local conditions [11,12]. (iii)
weather condition right The local
after theweather
lightning
condition right after the lightning strikes in each natural subregion would influence the
lightning-caused fire ignition and its distribution on a subregion level [6]. Nonetheless, our resultsISPRS Int. J. Geo-Inf. 2019, 8, 143 13 of 16
strikes in each natural subregion would influence the lightning-caused fire ignition and its distribution
on a subregion level [6]. Nonetheless, our results agree with the notion that lightning-caused fire
occurrences depend of the fuel/vegetation moisture content to a great extent [13,48].
Despite our findings demonstrating strong relations between observed and modeled
lightning-caused fires, other factors are worth investigating for potential further advancements.
These include: (i) the incorporation of topographical elements (i.e., elevation, slope, and aspect);
(ii) the integration of other sources of ignition, i.e., human-caused fires; (iii) the incorporation of
weather variables (i.e., relative humidity and precipitation, among others); and (iv) the assimilation
of other remote sensing-based forest fire forecasting systems that have been previously developed
(e.g., [10,49–51]), where enhancing the spatial resolution (i.e., from 500 m to 250 m) would be critical.
6. Conclusions
In the scope of this paper, we proposed a simple yet effective protocol for modeling
lightning-caused fire occurrences using MODIS-derived eight-day composites of NDWI, which is an
indicator of vegetation/fuel moisture conditions. We implemented the developed protocol over the
forested regions at the natural subregion-level in the Canadian province of Alberta. While developing
the model, we plotted the cumulative frequencies of median NDWI values (i.e., approximately between
0–12) and lightning-caused fires (i.e., between 0–1) from the snow disappearance stage to the start of
snowfall in autumn, i.e., the entire growing season, at the natural subregion level during the 2005–2012
period. In this case, we found strong relationships (i.e., 0.98 ≤ R2 ≤ 0.99) between the variables
of interest in all the six natural subregions. Upon obtaining the above relationships, we applied
them in modeling the lightning-caused fire cumulative frequencies, which were evaluated against
ground-based information at the natural subregion level during the 2013–2016 period. In this case,
our analysis demonstrated strong relationships (i.e., 0.92 ≤ R2 ≤ 0.98) between the observed and
modeled cumulative frequencies of lightning-caused fires. Overall, our proposed method was able to
model lightning-caused fire occurrences using a single remote sensing-based vegetation/fuel-related
variable, and demonstrated a good performance in both the calibration and validation phases. Finally,
our developed method can effectively enhance forest fire management activities, because having
knowledge about the critical time period of lightning-caused fires and the corresponding vegetation
stages would give fire managers a better opportunity to mobilize forest fire suppression resources to
reduce damages. Despite our method exhibiting excellent performance, we strongly recommend that
it be evaluated before being applied to other ecoregions in Canada or elsewhere in the world.
Author Contributions: Masoud Abdollahi and Quazi K. Hassan conceived and designed the study; Masoud
Abdollahi, Quazi K. Hassan, and Ashraf Dewan developed the method; Masoud Abdollahi and Quazi K. Hassan
were responsible for data downloading and preprocessing; Masoud Abdollahi, Quazi K. Hassan, and Ashraf
Dewan were involved in manuscript writing; and Quazi K. Hassan supervised the whole study.
Acknowledgments: We would like to thank the following organizations: (i) NASA for making the MODIS
data available to the public; and (ii) Alberta Forest Service, Government of Alberta for providing ground-based
historical fire spots data and GIS layers.
Conflicts of Interest: The authors declare no conflict of interest.
References
1. Natural Resources Canada Facts about Wildland Fires in Canada. Available online: http://www.nrcan.gc.
ca/forests/fire-insects-disturbances/fire/13143 (accessed on 10 December 2015).
2. Fang, L.; Yang, J.; Zu, J.; Li, G.; Zhang, J. Quantifying influences and relative importance of fire weather,
topography, and vegetation on fire size and fire severity in a Chinese boreal forest landscape. For. Ecol.
Manag. 2015, 356, 2–12. [CrossRef]
3. Wang, Y.; Anderson, K.R. An evaluation of spatial and temporal patterns of lightning- and human-caused
forest fires in Alberta, Canada, 1980–2007. Int. J. Wildland Fire 2010, 19, 1059–1072. [CrossRef]ISPRS Int. J. Geo-Inf. 2019, 8, 143 14 of 16
4. Li, C.; Liu, J.; Lafortezza, R.; Chen, J. Managing Forest Landscapes under Global Change Scenarios. In
Landscape Ecology in Forest Management and Conservation: Challenges and Solutions for Global Change; Springer:
Berlin, Germany, 2011; pp. 3–21.
5. Kasischke, E.S.; Turetsky, M.R. Recent changes in the fire regime across the North American boreal
region—Spatial and temporal patterns of burning across Canada and Alaska. Geophys. Res. Lett. 2006, 33.
[CrossRef]
6. Wotton, B.M.; Martell, D.L. A lightning fire occurrence model for Ontario. Can. J. For. Res. 2005, 35, 1389–1401.
[CrossRef]
7. Chen, F.; Du, Y.; Niu, S.; Zhao, J. Modeling forest lightning fire occurrence in the Daxinganling Mountains of
Northeastern China with MAXENT. Forests 2015, 6, 1422–1438. [CrossRef]
8. Liu, W.; Wang, S.; Zhou, Y.; Wang, L.; Zhu, J.; Wang, F. Lightning-caused forest fire risk rating assessment
based on case-based reasoning: A case study in DaXingAn Mountains of China. Nat. Hazards. 2016, 81,
347–363. [CrossRef]
9. Cha, D.H.; Wang, X.; Kim, J.W. Assessing lightning and wildfire hazard by land properties and cloud to
ground lightning data with association rule mining in Alberta, Canada. Sensors 2017, 17, 2413. [CrossRef]
[PubMed]
10. Abdollahi, M.; Islam, T.; Gupta, A.; Hassan, Q. An advanced forest fire danger forecasting system: Integration
of remote sensing and historical sources of ignition data. Remote Sens. 2018, 10, 923. [CrossRef]
11. Abatzoglou, J.T.; Kolden, C.A.; Balch, J.K.; Bradley, B.A. Controls on interannual variability in
lightning-caused fire activity in the western US. Environ. Res. Lett. 2016, 11, 045005. [CrossRef]
12. Podur, J.; Martell, D.L.; Csillag, F. Spatial patterns of lightning-caused forest fires in Ontario, 1976–1998. Ecol.
Modell. 2003, 164, 1–20. [CrossRef]
13. Krawchuk, M.A.; Cumming, S.G.; Flannigan, M.D.; Wein, R.W. Biotic and abiotic regulation of lightning fire
inititation in the mixedwood boreal forest. Ecology 2006, 87, 458–468. [CrossRef] [PubMed]
14. Nurdiana, A.; Risdiyanto, I. Indicator determination of forest and land fires vulnerability using Landsat-5
TM data (Case Study: Jambi Province). Procedia Environ. Sci. 2015, 24, 141–151. [CrossRef]
15. Zhang, J.H.; Yao, F.M.; Liu, C.; Yang, L.M.; Boken, V.K. Detection, emission estimation and risk prediction of
forest fires in China using satellite sensors and simulation models in the past three decades-An overview.
Int. J. Environ. Res. Public Health 2011, 8, 3156–3178. [CrossRef]
16. Verbesselt, J.; Somers, B.; Lhermitte, S.; Jonckheere, I.; van Aardt, J.; Coppin, P. Monitoring herbaceous fuel
moisture content with SPOT VEGETATION time-series for fire risk prediction in savanna ecosystems. Remote
Sens. Environ. 2007, 108, 357–368. [CrossRef]
17. Dasgupta, S.; Qu, J.J.; Hao, X. Moisture estimations for fire behavior predictions. Remote Sens. Environ. 2007,
108, 138–150. [CrossRef]
18. Hoscilo, A.; Tansey, K.J.; Page, S.E. Post-fire vegetation response as a proxy to quantify the magnitude of
burn severity in tropical peatland. Int. J. Remote Sens. 2013, 34, 412–433. [CrossRef]
19. Jaya, I.N.S.; Purnama, E.S.; Arianti, I.; Boonyanuphap, J. Forest fire risk assessment model and post-fire
evaluation using remote sensing and GIS: A case study in Riau, west Kalimantan and east Kalimantan
provinces, Indonesia. In Proceedings of the The Forest Restoration and Rehabilitation Training Course and
Workshop in the Viiki Tropical Resources Institute (VITRI) of the University of Helsinki, Helsinki, Finland,
13–19 May 2007; pp. 1–24.
20. Sekhon, N.S.; Hassan, Q.K.; Sleep, R.W. Evaluating potential of MODIS-based indices in determining “snow
gone” stage over forest-dominant regions. Remote Sens. 2010, 2, 1348–1363. [CrossRef]
21. Delbart, N.; Kergoat, L.; Le Toan, T.; Lhermitte, J.; Picard, G. Determination of phenological dates in boreal
regions using normalized difference water index. Remote Sens. Environ. 2005, 97, 26–38. [CrossRef]
22. Sekhon, N.S.; Hassan, Q.K.; Kamal, M.M. Remote sensing-based determination of conifer needle flushing
phenology over boreal-dominant regions. In Remote Sensing Applications in Environmental Research;
Srivastava, P.K., Mukherjee, S., Gupta, M., Islam, T., Eds.; Society of Earth Scientists Series; Springer
International Publishing: Cham, Switzerland, 2014.
23. Hassan, Q.K.; Rahman, K.M. Remote sensing-based determination of understory grass greening stage over
boreal forest. J. Appl. Remote Sens. 2013, 7, 073578. [CrossRef]
24. Hassan, Q.K.; Rahman, K.M. Applicability of remote sensing-based surface temperature regimes in
determining deciduous phenology over boreal forest. J. Plant. Ecol. 2013, 6, 84–91. [CrossRef]ISPRS Int. J. Geo-Inf. 2019, 8, 143 15 of 16
25. Bajocco, S.; Koutsias, N.; Ricotta, C. Linking fire ignitions hotspots and fuel phenology: The importance of
being seasonal. Ecol. Indic. 2017, 82, 433–440. [CrossRef]
26. Bajocco, S.; Guglietta, D.; Ricotta, C. Modelling fire occurrence at regional scale: Does vegetation phenology
matter? Eur. J. Remote Sens. 2015, 48, 763–775. [CrossRef]
27. Bowyer, P.; Danson, F.M. Sensitivity of spectral reflectance to variation in live fuel moisture content at leaf
and canopy level. Remote Sens. Environ. 2004, 92, 297–308. [CrossRef]
28. Belda, M.; Holtanová, E.; Halenka, T.; Kalvová, J. Climate classification revisited: From Köppen to Trewartha.
Clim. Res. 2014, 59, 1–13. [CrossRef]
29. Downing, D.J.; Pettapiece, W.W. Natural Regions and Subregions of Alberta; Government of Alberta: Edmonton,
AB, Canada, 2006.
30. Manikandan, S. Measures of central tendency: Median and mode. J. Pharmacol. Pharmacother. 2011, 2, 214.
[CrossRef] [PubMed]
31. Bhuyan, U.; Zang, C.; Vicente-Serrano, S.M.; Menzel, A. Exploring relationships among tree-ring growth,
climate variability, and seasonal leaf activity on varying timescales and spatial resolutions. Remote Sens.
2017, 9, 526. [CrossRef]
32. Swain, S.; Wardlow, B.D.; Narumalani, S.; Tadesse, T.; Callahan, K. Assessment of vegetation response to
drought in Nebraska using Terra-MODIS land surface temperature and normalized difference vegetation
index. GISci. Remote Sens. 2013, 48, 432–455. [CrossRef]
33. McLaurin, M.K.; Turvey, C.G. Applicability of the normalized difference vegetation index in index-based
crop insurance design. Weather Clim. Soc. 2011, 4, 271–284. [CrossRef]
34. Wall, L.; Larocque, D.; Léger, P.M. The early explanatory power of NDVI in crop yield modelling. Int. J.
Remote Sens. 2008, 29, 2211–2225. [CrossRef]
35. Cihlar, J.; Laurent, L.S.; Dyer, J.A. Relation between the normalized difference vegetation index and ecological
variables. Remote Sens. Environ. 1991, 35, 279–298. [CrossRef]
36. Qi, Y.; Dennison, P.E.; Spencer, J.; Riano, D. Monitoring live fuel moisture using soil moisture and remote
sensing proxies. Fire Ecol. 2012, 8, 71–87. [CrossRef]
37. Vandegehuchte, M.L.; de la Peña, E.; Bonte, D. Relative importance of biotic and abiotic soil components to
plant growth and insect herbivore population dynamics. PLoS ONE 2010, 5, e12937. [CrossRef] [PubMed]
38. Hassan, Q.K.; Bourque, C.P.A. Potential species distribution of balsam fir based on the integration of
biophysical variables derived with remote sensing and process-based methods. Remote Sens. 2009, 1, 393–407.
[CrossRef]
39. Hassan, Q.K.; Bourque, C.P.A.; Meng, F.R. Estimation of daytime net ecosystem CO2 exchange over balsam
fir forests in eastern Canada: Combining averaged tower-based flux measurements with remotely sensed
MODIS data. Can. J. Remote Sens. 2006, 32, 405–416. [CrossRef]
40. Dupilka, M.L.; Reuter, G.W. Composite soundings associated with severe and tornadic thunderstorms in
Central Alberta. Atmos. Ocean. 2011, 49, 269–278. [CrossRef]
41. Brimelow, J.C.; Reuter, G.W.; Poolman, E.R. Modeling maximum hail size in Alberta thunderstorms. Weather
Forecast 2002, 17, 1048–1062. [CrossRef]
42. Negi, M.S.; Kumar, A. Assessment of increasing threat of forest fires in Uttarakhand, Using Remote Sensing
and Gis Techniques. Glob. J. Adv. Res. 2016, 3, 457–468.
43. Bond, W.J.; Keeley, J.E. Fire as a global ‘herbivore’: The ecology and evolution of flammable ecosystems.
Trends Ecol. Evol. 2005, 20, 387–394. [CrossRef] [PubMed]
44. Tymstra, C.; Wang, D.; Rogeau, M.P. Alberta Wildfire Regime Analysis; Alberta Department of Sustainable
Resource Development, Forest Protection Division, Wildfire Policy and Business Planning Branch: Edmonton,
AB, Canada, 2005.
45. Government of Alberta. Flat Top Complex Wildfire Review Committee Flat Top Complex: Final Report from the Flat
Top Complex Wildfire Review Committee; Government of Alberta: Edmonton, AB, Canada, 2012.
46. Westerling, A.L.; Hidalgo, H.G.; Cayan, D.R.; Swetnam, T.W. Warming and earlier spring increase Western
U.S. forest wildfire activity. Science 2006, 313, 940–943. [CrossRef]
47. Martell, D.L.; Otukol, S.; Stocks, B.J. A logistic model for predicting daily people-caused forest fire occurrence
in Ontario. Can. J. For. Res. 1987, 17, 394–401. [CrossRef]
48. Kilinc, M.; Beringer, J. The spatial and temporal distribution of lightning strikes and their relationship with
vegetation type, elevation, and fire scars in the northern Territory. J. Clim. 2007, 20, 1161–1173. [CrossRef]You can also read