Bark Thickness in Coast Redwood (Sequoia sempervirens (D.Don) Endl.) Varies According to Tree- and Crown Size, Stand Structure, Latitude and ...
←
→
Page content transcription
If your browser does not render page correctly, please read the page content below
Article
Bark Thickness in Coast Redwood
(Sequoia sempervirens (D.Don) Endl.) Varies
According to Tree- and Crown Size, Stand Structure,
Latitude and Genotype
John-Pascal Berrill 1, *, Kevin L. O’Hara 2     and Nickolas E. Kichas 3
 1    School of Forest Resources, 201 Nutting Hall, University of Maine, Orono, ME 04469, USA
 2    College of Natural Resources, University of California, Berkeley, CA 94720, USA; kohara@berkeley.edu
 3    Department of Earth Sciences, 226 Traphagen Hall, Montana State University, Bozeman, MT 59715, USA;
      nickola.zeibigkichas@montana.edu
 *    Correspondence: pascal.berrill@maine.edu

 Received: 7 May 2020; Accepted: 1 June 2020; Published: 4 June 2020

 Abstract: Research Highlights: Bark thickness (BT) in coastal redwood (Sequoia sempervirens (D.Don)
 Endl.) varies in accordance with tree size, crown ratio, position within the canopy, height along the
 tree stem, genetic identity and latitude. However, current BT predictive equations do not account
 for such variability, leading to inaccurate BT estimations. We present improved BT models to
 increase the accuracy of BT estimates for coastal redwood in northern California. Background and
 Objectives: BT is an important metric that has many practical applications in forest management.
 However, BT varies substantially across species and environments, as well as across individuals and
 populations. Our objectives were to investigate BT along various gradients of change, with factors
 accounting for genetics, tapering of BT along the tree bole, differences in BT according to tree crown
 position within the stand, and the latitude. Materials and Methods: We collected BT data throughout
 most of redwood’s natural range along a north–south latitudinal gradient. Subsets of these data
 were used to examine the influence of particular variables on BT while holding the other variables
 constant. Results: Regionally, the bark was thicker among more xeric southern redwoods and thinner
 among more mesic northern redwoods. We found that the BT of codominant, intermediate and
 suppressed trees was around 8%, 14%, and 18% thicker, respectively, than bark of the same size
 dominant tree. Redwood trees growing in the partial shade of an overstory had thicker bark than
 trees growing in even-aged stands and incorporating genetic identity yielded major improvements
 in the BT model estimates, suggesting that BT is under genetic control. Bark thickness decreased
 with increasing height along the tree stem, with notable differences in the BT above and below breast
 height. Conclusions: We recommend utilizing the best available BT equations (over standard ‘bark
 factors’) in forest science, modeling and management applications. We also recommend the adoption
 of our drilling method for BT measurement on larger trees due to the potential for error associated
 with traditional bark gauge measurements.

 Keywords: bark factor; bark ratio; bark model; tree allometry; uneven-aged silviculture

1. Introduction
     Understanding how the thickness of tree bark varies within and among trees has practical
application in forest science and management. Bark thickness (BT) informs fire science research topics
such as modeling post-fire tree mortality because trees with thicker bark are generally more resistant [1].
Dendrochronology researchers studying tree rings can use BT equations to reconstruct historical BT

Forests 2020, 11, 637; doi:10.3390/f11060637                                     www.mdpi.com/journal/forests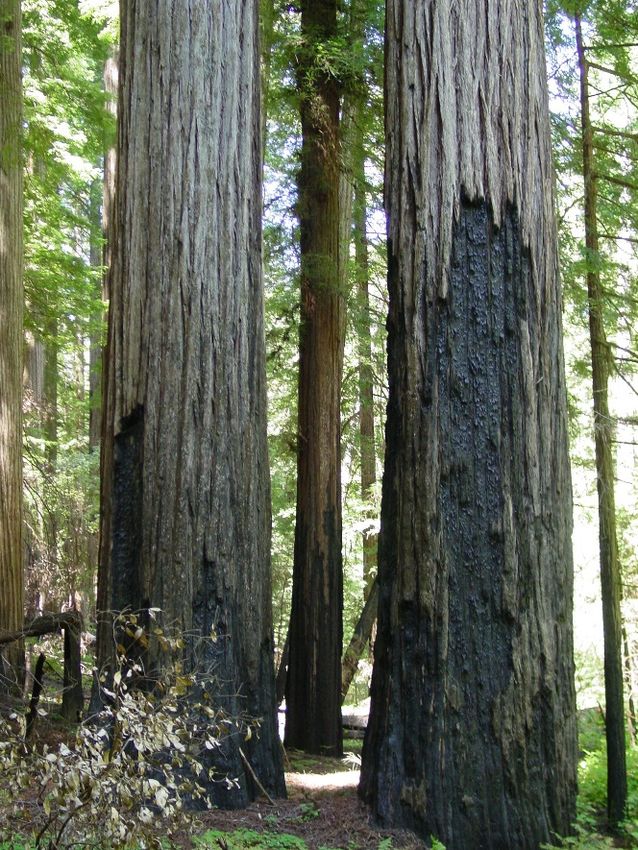
Forests 2020, 11, 637 2 of 16
for every year the tree was alive [2]. Forest scientists and managers are interested in quantifying
tree stem wood volume inside bark from measurements taken outside the bark, without destructive
sampling [3–5]. Forest managers contemplating commercial thinning in young stands need estimates
of the inside-bark diameter of logs to ensure that cut trees will yield logs meeting merchantability
specifications for minimum small-end diameter [6]. In these instances, to derive inside-bark dimensions
of wood in trees, we can subtract predictions from BT equations from outside-bark data or model
estimates [7,8].
There is also interest in identifying factors influencing BT and how these might be altered by
forest management activities. It could be advantageous to enhance BT in fire-prone areas, or reduce
BT if this resulted in a concomitant increase in wood production. Tree bark is considered a ‘defense
feature’ that encases living tissues and shields them from external biotic and abiotic forces [9]. A tree’s
allocation of resources to growth versus defense features such as bark will vary among species [10,11].
The strong correlation between tree size and BT signals potential to increase BT by thinning to enhance
the tree diameter growth. However, there is some evidence that slower growing trees have a thicker
bark relative to their diameter, suggesting that BT is also dependent on tree age [12]. Site quality and
soil fertility may influence BT directly, or indirectly by affecting the tree growth rates [13]. Similarly,
BT may be controlled indirectly by stand density which influences the tree growth and form and
can be altered by forest management [14]. Substantial within-stand variability in tree BT-diameter
relationships [9] suggests that additional factors such as genetics are affecting or controlling BT. If BT
is under genetic control, there is potential for selection and tree breeding to enhance or reduce BT. If
trees from certain regions have thicker or thinner bark gradients [5], we might make selections from
these populations in an attempt to produce planting stock with desirable BT. Trees in other parts of
California have shown a latitude gradient in BT [9], but this has not been studied in the coast redwood
(Sequoia sempervirens (D.Don) Endl.) forests of north coastal California.
Redwood is a shade-tolerant species with morphological plasticity that enables it to respond
to disturbances and quickly reoccupy growing space [15,16]. Shade tolerance enables suppressed
redwood trees to persist in low light, but grow slowly [17]. It is not known whether these suppressed
trees have increasing BT with advancing age despite slow diameter growth [18]. Conversely, dominant
redwood trees have large crowns intercepting much direct sunlight and exhibit high volume growth
efficiency [19], but may have low BT relative to their diameter. Moreover, it is also unknown how
redwood BT changes along the length of a tree bole. This information would enable individual logs or
standing trees to be more accurately scaled and valued, increasing economic efficiency [20]. While there
are published studies correlating BT to tree diameter [21–24], there is comparatively little research
which also includes assessments of other candidate factors such as genetics, the tapering of BT along
the tree bole, different BT according to tree crown position within the stand and trends in BT according
to latitude along the long, narrow north–south range of redwood in northern California.
The objective of our study was to quantify BT along various gradients of change. We hypothesized
that redwood BT varied principally according to tree size and height above ground, but also varied
according to genetics, crown size, crown position, stand structure and latitude. Specifically, we expected
BT to be: (i) less variable within than among distinct genotypes represented by multiple sprouts
sharing a root system; (ii) greater at southern latitudes, either due to slower growth on these more
xeric sites or as an adaptation to more frequent fire; (iii) greater among older trees in multiaged stands
(two or more age classes), where trees underwent some degree of height suppression during their time
in the understory, relative to even-aged stands where young trees grow rapidly in full sun with less
time to develop thick bark; (iv) greater for older trees of any given size in multiaged stands; and (v)
declining exponentially with increasing height above ground.
2. Materials and Methods
We collected BT data throughout most of redwood’s natural range, from Humboldt County in
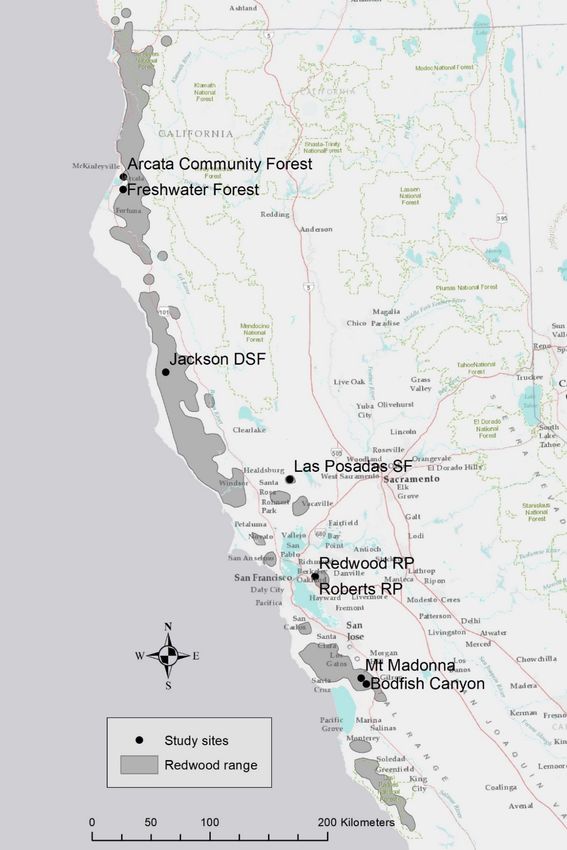
the north, Mendocino County in the center of redwood’s range, down to multiple counties at theForests 2020, 11, 637 3 of 16
southern end of the range (Figure 1, Table 1). Subsets of these data were used to examine the influence
of particular variables on BT while other influential variables were held constant. We held age constant
to test for genetic effects in terms of differences in the BT among sprout clumps in the same stand.
Crown class was also held constant to test for regional differences among stands in the north, central,
and southern parts of redwood’s natural range. We studied stand structure and age effects in data
from one region, and the tapering of bark along the stem in a single forest. For the purposes of this
study, we use the term tree bark in reference to various tissues including the inner living phloem and
dead outer tissue [25]. We use the term BT to refer to the radial linear thickness measurement of all
materials outside the xylem, i.e., the combination of cellular structures from inside the cambium layer
to the Forests
outside 2020,of
11,the exterior
x FOR bark.
PEER REVIEW 4 of 17
FigureFigure 1. Study
1. Study sitessites
andand approximaterange
approximate rangeof
of redwood
redwood ininnorthern
northernCalifornia and and
California southern Oregon.
southern Oregon.
Table 1. Redwood bark thickness study site location information.
Site County Latitude Longitude Elevation (m)
Arcata Community Forest Humboldt 40.872169 −124.070013 100
Freshwater Forest Humboldt 40.776107 −124.072185 27
Jackson Demonstration State F. Mendocino 39.380276 −123.631004 229
Las Posadas State Forest Napa 38.559367 −122.410412 404Forests 2020, 11, 637 4 of 16
Table 1. Redwood bark thickness study site location information.
Site County Latitude Longitude Elevation (m)
Arcata Community Forest Humboldt 40.872169 −124.070013 100
Freshwater Forest Humboldt 40.776107 −124.072185 27
Jackson Demonstration State F. Mendocino 39.380276 −123.631004 229
Las Posadas State Forest Napa 38.559367 −122.410412 404
Roberts Regional Park Alameda 37.813329 −122.175263 444
Redwood Regional Park Alameda 37.814919 −122.171610 447
Mt. Madonna Santa Clara 37.030449 −121.740942 618
Bodfish Canyon Santa Clara 36.984844 −121.692426 399
2.1. Data for Analysis of Clonal Effects
Jackson Demonstration State Forest (JDSF) is a 20,000 ha redwood-dominated forest managed
for research and demonstration objectives using a variety of silvicultural prescriptions. A history of
forest management activity has created an assortment of stand structures and age classes available for
observational studies. Centrally located in Mendocino County, JDSF has a climate that is intermediate
between more mesic northern redwood forests to the north, and more xeric conditions further south
and inland. The Mediterranean climate is characterized by warm dry summers, and wet cool winters.
Coastal fog regularly extends inland from the Pacific Coast and has a cooling effect throughout the
growing season.
In three stands on JDSF, a well stocked area dominated by redwood was selected for measurement.
A large rectangular 0.2 ha sample block was established. All trees greater than 10 cm in diameter at 1.37
m breast height (DBH) were mapped and measured for DBH, total height and height to the live crown
base—defined as stem height above which the tree crown was generally continuous on one or more
sides. We assigned each tree a crown class: dominant, codominant, intermediate, and suppressed.
Pith-to-bark cores collected from dominant trees gave approximate breast height age of the sample
stands. BT was measured twice on each tree; for individual stems, uphill and sidehill BT were measured
90 degrees apart, and for redwood stems in clumps—due to the elliptical cross-section with greater
growth away from clump center—BT was measured 90 degrees apart on one side, tending towards the
center and then again towards the outside of the clump. We used a standard 50 mm bark gauge on the
smaller trees. On the larger trees we used a portable drill and hole saw to remove a cylindrical piece
of the bark and expose the cambium. Then, we measured BT between the cambium and the metal
tape used to measure the DBH encircling the stem at breast height. This gave the thickness of bark
consistent with the method of DBH measurement.
2.2. Data for Analysis of Regional Differences
BT data from the southern portion of redwood’s range were collected at five sites between Santa
Clara County and Napa County [26]. These were relatively hot and dry redwood sites, being located
near the inland limits of redwood’s range. Two study sites were chosen for sampling in the northern
region: Arcata Community Forest and Freshwater Forest, near Humboldt Bay in Humboldt County. The
northern sites are shrouded in fog for much of the growing season and have an average mid-summer
daytime high temperature of only 18 ◦ C. Summer fog generally dissipates during the daytime at
the central sites in Mendocino County and the average summer high temperatures exceed the value
of 19 ◦ C reported for the weather station at the coast. At all the study sites, most rainfall occurs
between November and March. The mean annual precipitation is approximately 1000 mm at the
northern and central sites and at the inland Napa County site (Las Posadas State Forest). However,
we categorized the Napa site as ‘southern’ because it receives less fog and its summer temperatures
are much higher (30 ◦ C in July), much like the other southern sites (24–31 ◦ C). Annual precipitation
averaged approximately 530 mm at Gilroy, near the sampling sites at Bodfish Canyon and Mt MadonnaForests 2020, 11, 637 5 of 16
in Santa Clara County and 660 mm at Roberts and Redwood Regional Parks in Alameda and Contra
Costa Counties, respectively (http://www.weather.com).
Dominant and co-dominant redwood trees approximately 80 to 130 years old and about 110 ft
tall were selected for BT measurement in the northern and southern regions: 40 trees from the two
northern sites and 25 trees from the five southern sites. BT data for 195 dominant and codominant
redwood trees representing the central region were extracted from the following dataset for JDSF.
2.3. Data for Analysis of Stand Structure and Age Effects
Throughout the Jackson Demonstration State Forest we established 52 fixed radius plots of various
sizes from 0.01 to 0.5 ha: most were 0.02 ha or 0.04 ha. Each plot sampled a forested area absent of
recent disturbance or edge effects, but differing in size, structure, and composition. In 23 of these plots,
every tree >5 cm diameter at breast height (DBH) was measured for DBH, height, and live crown base
height. In the remaining plots, every tree >10 cm DBH was measured. Trees were assigned a canopy
layer (stratum) designation of (A) the crown emergent above main canopy, (B) the crown within the
main canopy, and the crown within one or more understory layers (C, D), and assigned one of four
crown classes within each stratum. BT was measured once on the smaller trees and measured twice
and then averaged for each tree >20 cm DBH. A subset of trees (660 out of the 969 measured trees) were
cored for breast-height age. Plots with one age class (cohort) of trees were designated as even-aged.
Plots with two or more cohorts were designated as multiaged.
2.4. Data for Analysis of Bark Taper along Stem
Within the Arcata Community Forest (ACF) in Humboldt County, 31 redwood focal trees were
selected at distances >100 m apart along a “wandering” transect designed to capture a range of the
tree sizes and stand densities. BT and diameter measurements were taken at intervals from the base
of the stem to the base of the live canopy. Trees were climbed using the flip-line and spur method
and the diameter was repeatedly measured along the stem. At the same height of each diameter
measurement, the BT was measured twice 90 degrees apart using a standard 50 mm bark gauge.
The BT was measured from the wood surface to the contour of the diameter tape wrapped around the
tree [27]. Measurements were separated vertically by roughly 0.30 m at heights below 2 m and roughly
3 m above 2 m in height with the final measurement taken upon reaching the live crown base. More
frequent diameter and BT measurements were taken below 2 m to account for the greater tapering of
BT near the tree base.
To evaluate the influence of stand density on BT, each focal tree that we climbed was designated
as the center of a variable-radius plot. DBH was measured for each plot tree, and used to calculate
stand density index (SDI) [28] using the angle-summation method [29]. The basal area factor (BAF)
was selected based on a desire to have five to nine trees within the plot. Plots with relatively low
density were established using a 4.59 m2 ha−1 BAF prism, moderate density plots with a 9.18 m2 ha−1
BAF prism, and high density plots were established with a 13.77 m2 ha−1 BAF prism.
2.5. Analysis
We analyzed the nested data for genetic effect on the BT using the generalized linear mixed-effects
regression with PROC GLIMMIX in SAS [27]. The fixed effects were tree DBH, crown ratio (CR), and the
categorical variable: crown class. We incorporated a random effect for the class variable: CloneID,
a unique identifier for each clump of redwood sprout-origin stems. For the analysis of north–south
latitudinal gradient in BT, we used generalized linear regression (PROC GLM) analysis with categorical
variables for the region (north, central, south) and the continuous variables DBH and CR. Similarly,
for the analysis of the stand structure effects, we used GLM with a categorical binary variable for
even-aged or multiaged stand structure, and continuous variables for DBH and CR. The analysis of
tree age and canopy position was also done using GLM with the categorical variable canopy strata
(emergent, main canopy, understory) and continuous variables: DBH, CR, and breast-height age. ForForests 2020, 11, 637 6 of 16
each of these analyses, the response variable was transformed to reduce skewness in the distribution of
the BT data. We used Akaike’s Information Criterion AIC for model selection, where decreases greater
than 2 points were considered significant improvements [30].
Lastly, we developed a BT taper equation predicting the BT for any height along the tree bole. For
analysis, the measurement height data were converted to a proportion of the total tree height (HT)
above breast height (BH), such that:
Measurement HT − 1.37
Measurement HT relative to BH = (1)
Tree HT − 1.37
BT was also converted to a proportion of breast height BT. Our BT data exhibited negative
exponential tapering with increasing height above ground, so we subtracted our measurement height
relative to the breast height from one to invert the data in order to fit a nonlinear power model.
After preliminary analysis it was decided that two separate nonlinear equations (one for above BH and
one for below BH) would better represent redwood BT tapering which appeared to taper more rapidly
below breast height; Maguire and Hann [8] also used separate equations to model the tapering of BT
above and below breast height. We excluded the data for one outlier tree with unusual bark taper
characteristics. Data were analyzed using PROC NLIN in SAS [31].
3. Results
3.1. Bark Thickness in Even-Aged Stands—Effects of Tree Size, Taper, Crown Ratio, and Genetics
Holding the stand age constant at 85 years in two stands and 100 years in the third even-aged
stand allowed us to isolate the effects of tree variables and quantify variation in the breast-height BT
among the genotypes (i.e., n = 74 individual sprout clumps comprising 2–12 trees). Each sample stand
had a different mean and maximum tree size, but a similar basal area comprised of more or less trees
(Table 2). Size-differentiation was pronounced, with many trees in the suppressed crown class (Table 3).
Table 2. Summary data for 0.2 ha plot in three even-aged stands at age 85–100 years in the Jackson
Demonstration State Forest.
Stand 1 Stand 2 Stand 3
Position on slope Ridge Gully Upslope
Age 85 100 85
Area (ha) 0.2 0.2 0.2
Number of trees sampled 263 78 230
Density (stems/ha) 1315 390 1150
Average DBH (mm) 332 610 398
Maximum DBH (mm) 926 1394 1127
Maximum height (m) 44.6 63.8 50.1
Basal area (m2 ha−1 ) 144.7 142.0 179.0
Stemwood volume (m3 ha−1 ) 1286 2126 1961
Several models of the BT in even-aged stands had equivalent AIC. The most parsimonious model
included DBH and crown class. Testing CloneID as a fixed effect gave a major improvement in AIC,
indicating that the BT differed among the sprout clumps and was under genetic control (Table 4). In
this model, solutions for fixed effects indicated that the BT varied within a 6.4 mm range (−1.0–5.4 mm)
among sprout clumps.Forests 2020, 11, 637 7 of 16
When CloneID was treated as a random effect, an important amount of variation in BT was
detected among sprout clumps (Table 5). There was relatively more random (residual) variation in
the BT than among the genotypes, and more variation among sprout-clump genotypes (CloneID)
than among the three sample stands (Plot) (Table 5). The best BT model indicated that the bark was
thickest among the suppressed trees and thinnest among the dominant trees, after controlling for the
tree size and age effects in the GLM analysis. Comparing the modeled BT among redwood trees with
450–650 mm DBH (i.e., where the data for all the crown classes were available), the bark of codominant,
intermediate, and suppressed trees was around 8%, 14%, and 18% thicker, respectively, than the bark
of the same size dominant tree (Figure 2).
Table 3. Summary data for redwood trees in each crown class in three even-aged stands at age 85–100
years in Jackson Demonstration State Forest.
Variable Crown Class n Mean s.d. Min. Max.
All trees 571 35.59 22.06 1.00 119.50
Dominant 67 60.05 18.87 34.50 111.50
Bark thickness (mm) Codominant 100 54.34 17.90 24.50 119.50
Intermediate 78 46.40 12.32 24.50 75.50
Suppressed 326 22.23 14.47 1.00 72.00
All trees 571 396.69 224.55 100.00 1394.00
Dominant 67 700.90 196.33 453.00 1394.00
DBH (mm) Codominant 100 609.56 185.89 305.00 1165.00
Intermediate 78 461.92 99.55 310.00 784.00
Suppressed 326 253.26 114.26 100.00 660.00
All trees 571 0.31 0.10 0.01 0.69
Dominant 67 0.38 0.08 0.19 0.60
Crown ratio Codominant 100 0.37 0.08 0.20 0.64
Intermediate 78 0.31 0.08 0.15 0.53
Suppressed 326 0.28 0.10 0.01 0.69
All trees 571 0.83 0.19 0.32 1.45
Dominant 67 0.66 0.11 0.35 0.87
Height:diameter ratio Codominant 100 0.70 0.11 0.49 1.05
Intermediate 78 0.79 0.11 0.44 1.05
Suppressed 326 0.91 0.19 0.32 1.45
Table 4. Comparing candidate even-aged redwood bark thickness (BT) models. Generalized linear
mixed-effects models for square-root transformed BT (mm) as a function of candidate fixed effects:
DBH, height:diameter ratio (HD), crown ratio (CR), crown class (CC), and a unique sprout clump
identifier (CloneID) included in every model as either a fixed or a random effect. Models fitted to
redwood tree data (n = 571) for three even-aged stands at age 85 years in Jackson Demonstration
State Forest.
Candidate Models AIC ∆AIC
BT0.5 = β0 + β1 LnDBH + β2 CClass + β3 CloneID 980.04 -
BT0.5 = β0 + β1 LnDBH + β2 CR + β3 LnDBH × CR+ β4 CC 1121.42 141.38
BT0.5 = β0 + β1 LnDBH + β2 CClass 1121.69 141.65
BT0.5 = β0 + β1 LnDBH + β2 CR + β3 CClass 1121.73 141.69
BT0.5 = β0 + β1 LnDBH + β2 HD + β3 CClass 1121.97 141.93
BT0.5 = β0 + β1 LnDBH + β2 HD + β3 LnDBH × HD + β4 CC 1123.00 142.96
BT0.5 = β0 + β1 LnDBH + β2 CR + β3 LnDBH × CR 1146.24 166.20
BT0.5 = β0 + β1 LnDBH + β2 HD + β3 LnDBH × HD 1146.44 166.40
BT0.5 = β0 + β1 LnDBH 1149.83 169.79Forests 2020, 11, 637 8 of 16
Table 5. Even-aged redwood bark thickness (BT) model. Linear mixed-effects model for square-root
transformed BT (mm) in each crown class as a function of DBH (mm) at age 85 years in three even-aged
stands in Jackson Demonstration State Forest.
Effect Variable Estimate s.e. DF t Value Pr > |t|
Intercept −15.6668 0.5105 2 −30.69 0.0011
LnDBH 3.6526 0.0806 490 45.30Forests 2020, 11, 637 9 of 16
in the model fit (Table 9). The best model indicated that redwood trees growing in the partial shade of
an overstory had thicker bark than trees growing in even-aged stands, after accounting for the effects
of tree size (positive) and crown ratio (negative) on BT (Table 10).
Table 6. Summary data for redwood trees in the northern, central, and southern parts of redwood’s
natural range.
Variable Region n Mean s.d. Min. Max.
North 40 791.65 211.43 487.70 1342.00
DBH (mm) Central 195 684.03 187.81 471.00 1562.10
South 25 745.24 167.58 471.00 1103.00
North 40 0.66 0.11 0.46 0.91
Crown ratio Central 195 0.52 0.16 0.15 1.00
South 25 0.58 0.14 0.36 0.89
North 40 57.36 20.13 31.80 117.50
Bark thickness (mm) Central 195 57.39 17.31 22.00 117.00
South 25 80.58 28.79 31.50 164.00
Table 7. Bark thickness (BT) model for dominant and codominant redwoods in the northern, central, and
southern parts of redwood’s natural range (regional model) and for all the data combined (range-wide
model). Generalized linear model for the natural log (Ln)-transformed BT (mm) as a function of
DBH (mm).
Model Variable Estimate s.e. DF t Value Pr > |t| AIC
Intercept −0.1846 0.418 0 −0.44Forests 2020, 11, 637 10 of 16
Table 10. Bark thickness (BT) model for redwood trees in even-aged stands and understory trees in
multiaged stands. Generalized linear model for natural log (Ln)-transformed BT (mm) as a function of
DBH (mm) and crown ratio.
Variable Estimate s.e. DF t Value Pr > |t|
Intercept −4.9977 0.2988 0 −16.73Forests 2020, 11, 637 11 of 16
Table 13. Bark thickness (BT) models for redwood trees in multiaged stands. Generalized linear model
for the square root-transformed BT (mm) as a function of DBH (mm) and crown ratio, with and without
breast-height age (years).
Model Variable Estimate s.e. DF t Value Pr > |t| AIC
Intercept −8.6640 0.3059 0 −28.32Forests 2020, 11, 637 12 of 16
Forests 2020, 11, x FOR PEER REVIEW 13 of 17
Figure 3.
Figure Modeled bark
3. Modeled bark thickness
thickness (BT)
(BT) tapering
tapering above
above and
and below
below the
the breast
breast height
height (1.37
(1.37 m)
m) for
for three
three
redwood trees of different heights: 50 m, 35 m, and 20 m total height.
redwood trees of different heights: 50 m, 35 m, and 20 m total height.
4. Discussion
4. Discussion
Redwood BT was most strongly associated with DBH, but was also found to be negatively
Redwood BT was most strongly associated with DBH, but was also found to be negatively
correlated with the CR. Like CR, crown class was negatively correlated with BT, meaning that among
correlated with the CR. Like CR, crown class was negatively correlated with BT, meaning that among
trees of a given DBH, dominant trees had the least BT and suppressed trees had the most BT. After
trees of a given DBH, dominant trees had the least BT and suppressed trees had the most BT. After
including these influential tree variables in the BT regressions, other factors explaining additional
including these influential tree variables in the BT regressions, other factors explaining additional
variation in BT included genotype, stand structure (BT ranked even-aged < multiaged), and geographic
variation in BT included genotype, stand structure (BT ranked even-aged < multiaged), and
region (BT ranked north < central < southern regions). The regional variation in BT has also been
geographic region (BT ranked north < central < southern regions). The regional variation in BT has
detected among Sierra Nevada conifers throughout California [12] but not white spruce (Picea glauca)
also been detected among Sierra Nevada conifers throughout California [12] but not white spruce
across Alaska [32].
(Picea glauca) across Alaska [32].
The influence of stand structure on the BT manifested itself as greater BT for redwoods grown in
The influence of stand structure on the BT manifested itself as greater BT for redwoods grown
multiaged versus even-aged stands. This difference was detected even after accounting for the influence
in multiaged versus even-aged stands. This difference was detected even after accounting for the
of DBH and CR. We expected trees in multiaged stands to be older than trees of the same size in
influence of DBH and CR. We expected trees in multiaged stands to be older than trees of the same
even-aged stands, and have different stem and crown allometry and branching characteristics [11,33–35].
size in even-aged stands, and have different stem and crown allometry and branching characteristics
For example, crowns of the shade-tolerant Pacific silver fir (Abies amabilis) had longer crowns when
[11,33–35]. For example, crowns of the shade-tolerant Pacific silver fir (Abies amabilis) had longer
grown in shade, and presumably different branching patterns and allometry [35]. Stem allometry
crowns when grown in shade, and presumably different branching patterns and allometry [35]. Stem
and tapering of bark along the stem may also vary between redwoods grown in multiaged versus
allometry and tapering of bark along the stem may also vary between redwoods grown in multiaged
even-aged stands, requiring more investigation. Marshall et al. [4] found that the Douglas-fir BT
versus even-aged stands, requiring more investigation. Marshall et al. [4] found that the Douglas-fir
varied among stands, and recommended applying localized coefficients to account for this source of
BT varied among stands, and recommended applying localized coefficients to account for this source
variation in BT. In addition, it is unknown how the patterns of BT tapering along the stem may also
of variation in BT. In addition, it is unknown how the patterns of BT tapering along the stem may
vary regionally. Pemberton [36] reported on the tapering of BT in terms of bark factor at BH (av. 15.6%,
also vary regionally. Pemberton [36] reported on the tapering of BT in terms of bark factor at BH (av.
range 14–16%) and the half height (av. 10.7% of stem diameter at half height, range 9.7–11.1%) for
15.6%, range 14%–16%) and the half height (av. 10.7% of stem diameter at half height, range 9.7%–
redwood in Del Norte and Humboldt Counties.
11.1%) for redwood in Del Norte and Humboldt Counties.
Other factors may also influence the BT in redwood and other species. The thick bark on redwood
Other factors may also influence the BT in redwood and other species. The thick bark on
that imparts resistance to fire is often partially consumed in non-lethal ground fires (Figure 4). Hence,
redwood that imparts resistance to fire is often partially consumed in non-lethal ground fires (Figure
the BT near the ground on large trees may be less than further up the stem. Similarly, anthropogenic
4). Hence, the BT near the ground on large trees may be less than further up the stem. Similarly,
burning may have favored trees with thicker BT as reported in Pinus radiata [37]. Bark thickness in
anthropogenic burning may have favored trees with thicker BT as reported in Pinus radiata [37]. Bark
redwood has also been reported to shrink and swell with variations in moisture content [38].
thickness in redwood has also been reported to shrink and swell with variations in moisture content
[38].Forests 2020, 11, 637 13 of 16
Forests 2020, 11, x FOR PEER REVIEW 14 of 17
Figure 4. Bark
Bark of
of old
old redwood
redwood trees partially consumed by wildfire.
In multiaged
In multiagedstands, stands,older
oldertreestreesof of
a given
a givensizesize
and and
crown ratio ratio
crown were found
were found to havetoslightly thicker
have slightly
bark, but the age effect was not pronounced. A simpler BT model
thicker bark, but the age effect was not pronounced. A simpler BT model without age included DBH without age included DBH and CR,
and itself
and CR, and represented a major improvement
itself represented a major improvementin predictive power over
in predictive the simplest
power over themodel predicting
simplest model
the BT in multiaged stands as a function of DBH alone. This finding
predicting the BT in multiaged stands as a function of DBH alone. This finding has practical has practical significance. First,
it appears that
significance. a generalized
First, it appears BT thatmodel applies toBT
a generalized allmodel
trees inapplies
multiaged
to allstands
trees in which means stands
multiaged it will
make consistent
which means it will predictions when implemented
make consistent predictions within individual tree
when implemented growth
within and yield
individual modeling
tree growth
frameworks
and predicting
yield modeling change in predicting
frameworks the DBH and CR over
change in the time.
DBH Secondly,
and CRthe over importance of CR and
time. Secondly, the
DBH for theofprediction
importance CR and DBH of BTforsuggests that constant
the prediction ‘bark factors’
of BT suggests (sometimes
that constant referred(sometimes
‘bark factors’ to as bark
ratios) [36,39]
referred to as willbarkberatios)
inadequate
[36,39]for many
will applications.forInmany
be inadequate particular, trees at either
applications. extreme of
In particular, DBH
trees at
either extreme of DBH or CR will have the BT under/overpredicted by a constant bark factor. [36]
or CR will have the BT under/overpredicted by a constant bark factor. For example, Pemberton For
reported aPemberton
example, constant bark [36] factor
reported of 15.6 for second-growth
a constant bark factor of redwood
15.6 forinsecond-growth
Humboldt andredwood Del Norte in
Counties, meaning that 15.6% of a tree’s DBH comprised bark (both
Humboldt and Del Norte Counties, meaning that 15.6% of a tree’s DBH comprised bark (both sides). sides). Dividing this factor by two
(7.8%)
Dividing makesthis itfactor
comparable to our data
by two (7.8%) makes and models for one-sided
it comparable to our data average
and modelsradial for BT. one-sided
Comparedaverageagainst
our BTBT.
radial predictions
Compared for against
dominant ourand BTcodominant
predictions trees in Humboldt
for dominant and County,
codominant the constant
trees in bark factor
Humboldt
gives a 52% underprediction of BT for a small redwood (15 cm DBH),
County, the constant bark factor gives a 52% underprediction of BT for a small redwood (15 cm DBH), a 2% overprediction for a 60 cm
aDBH redwood, and afor
2% overprediction 24%a 60overprediction
cm DBH redwood, for a 135
andcm DBHoverprediction
a 24% redwood tree.for Therefore,
a 135 cmwe DBH recommend
redwood
replacing bark factors with the best available BT equations in forest science,
tree. Therefore, we recommend replacing bark factors with the best available BT equations in forest modeling and management
applications.
science, We also
modeling andrecommend
management theapplications.
adoption of our We drilling method for
also recommend BTadoption
the measurement of ourondrilling
larger
trees duefor
method to BT
themeasurement
potential for error
on largerassociated
trees duewithtobark gauge measurements
the potential for error associated[40]. with bark gauge
Redwood
measurements [40]. stems within a sprout clump had a similar BT, and the BT varied widely among the
clumps in the same
Redwood stemsstands.
within The strong
a sprout genetic
clump hadvariance
a similarcomponent
BT, and thefor BTredwood BT suggests
varied widely amongthat the
BT should
clumps be assessed
in the same stands.in tree
The improvement
strong genetic field trials along
variance with other
component important
for redwood BTtraits suchthat
suggests as tree
BT
size, form, health, epicormic branching and wood properties [41,42].
should be assessed in tree improvement field trials along with other important traits such as tree size,Redwood planting stock with
thinner
form, bark tendencies
health, could be deployed
epicormic branching and wood in properties
areas where wildfire
[41,42]. risk is low
Redwood (e.g., closer
planting stock to
withthethinner
Pacific
coast) with the objective of sequestering and storing more carbon into
bark tendencies could be deployed in areas where wildfire risk is low (e.g., closer to the Pacific coast) long lived wood products
and producing
with the objective less of
bark residues [43].
sequestering andAlternatively,
storing moreredwood carbon planting
into longstock livedwith high
wood BT couldand
products be
deployed toless
producing more xeric
bark and fire-prone
residues inland areas
[43]. Alternatively, [44], and
redwood for use stock
planting in redwood
with highrange BTexpansion
could be
deployed to more xeric and fire-prone inland areas [44], and for use in redwood range expansionForests 2020, 11, 637 14 of 16
projects where redwood is being planted outside its natural range in more stressful environments and
may benefit from added protection from the elements [45,46].
5. Conclusions
In summary, redwood BT varied along gradients, at the tree level, in accordance with stand
structure, as well as regionally. Factors other than DBH explained important amounts of variance
and should be considered when modeling the BT instead of relying on simple bark factors that
overpredict BT for larger, older trees such as those grown on longer rotations or to later ages under
multiaged silviculture.
Author Contributions: Conceptualization and methodology, J.-P.B., K.L.O., N.E.K.; formal analysis, J.-P.B., N.E.K.;
resources, K.L.O.; writing—original draft preparation and writing—review and editing, J.-P.B., K.L.O., N.E.K.;
funding acquisition, J.-P.B., K.L.O. All authors have read and agreed to the published version of the manuscript.
Funding: This research was funded in part by the McIntire-Stennis Cooperative Forestry Research Program,
project number ME042043. The APC was funded by credits received from the publisher for peer review and
editorial service.
Acknowledgments: Field assistance was provided by Chris Ardis, Joseph King, Sophak Peou, Kirk Perttu, Merlin
Sabo, and Cody Wright. We are grateful for logistic support provided by Jackson Demonstration State Forest, and
research access permits from multiple public and private landowners.
Conflicts of Interest: The authors declare no conflict of interest.
References
1. Agee, J.K. Fire Ecology of Pacific Northwest Forests; Island Press: Washington, DC, USA, 1996.
2. Slack, A.W.; Kane, J.M.; Knapp, E.E.; Sherriff, R.L. Contrasting impacts of climate and competition on large
sugar pine growth and defense in a fire-excluded forest of the Central Sierra Nevada. Forests 2017, 8, 244.
[CrossRef]
3. Avery, T.E.; Burkhart, H. Forest Measurements; McGraw-Hill Education: New York, NY, USA, 2002.
4. Marshall, H.D.; Murphy, G.E.; Lachenbruch, B. Effects of bark thickness estimates on optimal log
merchandising. For. Prod. J. 2006, 56, 87–92.
5. Li, R.; Weiskittel, A.R. Estimating and predicting bark thickness for seven conifer species in the Acadian
Region of North America using a mixed-effects modeling approach: Comparison of model forms and
subsampling strategies. Eur. J. For. Res. 2011, 130, 219–233. [CrossRef]
6. Ashton, M.S.; Kelty, M.J. The Practice of Silviculture: Applied Forest Ecology, 10th ed.; John Wiley and Sons:
New York, NY, USA, 2018.
7. Laasasenaho, J.; Melkas, T.; Aldén, S. Modelling bark thickness of Picea abies with taper curves. For. Ecol.
Manag. 2005, 206, 35–47. [CrossRef]
8. Maguire, D.A.; Hann, D.W. Bark thickness and bark volume in Southwestern Oregon Douglas-fir. West. J.
Appl. For. 1990, 5, 5–8. [CrossRef]
9. Edmonds, R.L.; Agee, J.K.; Gara, R.I. Forest Health and Protection; Waveland Press, Inc.: Long Grove, IL,
USA, 2011.
10. Biggs, A.R.; Merrill, W.; Davis, D.D. Discussion: Response of bark tissue to injury and inflection. Can. J.
For. Res. 1984, 14, 351–356. [CrossRef]
11. Jackson, J.F.; Adams, D.C.; Jackson, U.B. Allometry of constitutive defense: A model and a comparative test
with tree bark and fire regime. Am. Nat. 1999, 153, 614–632. [CrossRef] [PubMed]
12. Zeibig-Kichas, N.E.; Ardis, C.W.; Berrill, J.-P.; King, J.P. Bark thickness equations for mixed-conifer forest
type in Klamath and Sierra Nevada Mountains of California. Int. J. For. Res. 2016, 1864039, 1–10. [CrossRef]
13. Dolph, K.L. Nonlinear Equations for Predicting Diameter inside Bark at Breast Height for Young-Growth Red Fir in
California and Southern Oregon; Res. Note. PSW-RN-409; USDA Forest Service: Berkeley, CA, USA, 1989.
14. Oliver, C.D.; Larson, B.C. Forest Stand Dynamics, Update Edition; John Wiley and Sons: New York, NY,
USA, 1996.Forests 2020, 11, 637 15 of 16
15. Olson, D.F., Jr.; Roy, D.F.; Walters, G.A. Sequoia sempervirens (D. Don) Endl. Redwood (Agriculture
Handbook 654). In Silvics of North America; Conifers; USDA Forest Service: Washington, DC, USA, 1990;
Volume 1, pp. 541–551.
16. Berrill, J.-P.; O’Hara, K.L. How do biophysical factors contribute to height and basal area development in a
mixed multiaged coast redwood stand? Forestry 2016, 89, 170–181. [CrossRef]
17. O’Hara, K.L.; Stancioiu, P.T.; Spencer, M.A. Understory stump sprout development under variable canopy
density and leaf area in coast redwood. For. Ecol. Manag. 2007, 244, 76–85. [CrossRef]
18. Berrill, J.-P.; O’Hara, K.L. Estimating site productivity in irregular stand structures by indexing basal area or
volume increment of the dominant species. Can. J. For. Res. 2014, 44, 92–100. [CrossRef]
19. Berrill, J.-P.; O’Hara, K.L. Patterns of leaf area and growth efficiency in young even-aged and multiaged
coast redwood stands. Can. J. For. Res. 2007, 37, 617–626. [CrossRef]
20. Husch, B.; Beers, T.W.; Kershaw, J.A., Jr. Forest Mensuration, 4th ed.; John Wiley & Sons, Inc.: New York, NY,
USA, 2002.
21. Biging, G.S. Taper equations for second-growth mixed conifers of Northern California. For. Sci. 1984, 30,
1103–1117. [CrossRef]
22. Amidon, E.L. A general taper functional form to predict bole volume for five mixed-conifer species in
California. For. Sci. 1984, 30, 166–171. [CrossRef]
23. Ryan, K.C.; Reinhardt, E.D. Predicting postfire mortality of seven western conifers. Can. J. For. Res. 1988, 18,
1291–1297. [CrossRef]
24. Hengst, G.E.; Dawson, J.O. Bark properties and fire resistance of selected tree species from the central
hardwood region of North America. Can. J. For. Res. 1994, 24, 688–696. [CrossRef]
25. Pallardy, S.G. Physiology of Woody Plants; Elsevier: Boston, MA, USA, 2008.
26. Berrill, J.-P.; Jeffress, J.L.; Engle, J.M. Coast redwood live crown and sapwood dynamics. In Proceedings of the
Coast Redwood Forests in a Changing California: A Symposium for Scientists and Managers; USDA Forest Service
General Technical Report PSW-GTR-238; USDA Forest Service: Albany, CA, USA, 2012.
27. Mesavage, C. Measuring bark thickness. J. For. 1969, 67, 753–754.
28. Reineke, L.H. Perfecting a stand-density index for even-aged forests. J. Agric. Res. 1933, 46, 627–638.
29. Spurr, S.H. A measure of point density. For. Sci. 1962, 8, 85–96.
30. Burnham, K.P.; Anderson, D.R. Model Selection and Multimodel Inference: A Practical Information-Theoretic
Approach; Springer: New York, NY, USA, 2002.
31. SAS Institute Inc. Base SAS® 9.4 Procedures Guide: Statistical Procedures, 6th ed.; SAS Institute Inc.: Cary, NC,
USA, 2016.
32. Malone, T.; Liang, J. A bark thickness model for white spruce in Alaska northern forests. Int. J. For. Res. 2009,
876965, 1–5. [CrossRef]
33. Kirk, C.; Berrill, J.-P. Second-log branch size comparison between even-aged and multiaged Douglas-fir
stands in coastal northern California. Math. Comp. For. Nat. Res. Sci. 2020, 12, 50–61.
34. Temesgen, H.; LeMay, V.; Mitchell, S.J. Tree crown ratio models for multi-species and multi-layered stands of
southeastern British Columbia. For. Chron. 2005, 81, 133–141. [CrossRef]
35. Sprugel, D.G. When branch autonomy fails: Milton’s Law of resource availability and allocation. Tree Phys.
2002, 22, 1119–1124. [CrossRef] [PubMed]
36. Pemberton, J.E., Jr. The relation of bark to diameter and volume in redwood. J. For. 1924, 22, 44–48. [CrossRef]
37. Stephens, S.L.; Libby, W.J. Anthropogenic fire and bark thickness in coastal and island pine populations in
Alta and Baja California. J. Biogeogr. 2006, 33, 648–652. [CrossRef]
38. Bawcome, R.; Hubbell, R.J.; Burns, D. Seasonal Diameter Growth in Trees on Jackson State Forest; State Forest
Note #6. California. Division of Forestry: Sacramento, CA, USA, 1961.
39. Meyer, A. Bark volume determination in trees. J. For. 1946, 44, 1067–1070.
40. Stängle, S.M.; Weiskittel, A.R.; Dormann, C.F.; Brüchert, F. Measurement and prediction of bark thickness in
Picea abies: Assessment of accuracy, precision, and sample size requirements. Can. J. For. Res. 2016, 46, 39–47.
[CrossRef]
41. O’Hara, K.L.; Berrill, J.-P. Epicormic sprout development in pruned coast redwood: Pruning severity,
genotype, and sprouting characteristics. Ann. For. Sci. 2009, 66, 409. [CrossRef]Forests 2020, 11, 637 16 of 16
42. Meason, D.F.; Kennedy, S.G.; Dungey, H.S. Two New Zealand-based common garden experiments of the
range-wide ‘Kuser’ clonal collection of Sequoia sempervirens reveal patterns of provenance variation in growth
and wood properties. New For. 2016, 47, 635–651. [CrossRef]
43. Berrill, J.-P.; Han, H.-S. Carbon, harvest yields, and residues from restoration in a mixed forest on California’s
Coast Range. For. Sci. 2017, 63, 128–136. [CrossRef]
44. Pausas, J.G. Bark thickness and fire regime. Funct. Ecol. 2015, 29, 315–327. [CrossRef]
45. Dagley, C.M.; Berrill, J.-P.; Johnson, F.J.; Kerhoulas, L.P. Adaptation to Climate Change? Moving Coast
Redwood Seedlings Northward and Inland. In Proceedings of the Coast Redwood Science Symposium—2016:
Past Successes and Future Direction; USDA Forest Service Gen. Tech. Rep. PSW-GTR-258; U.S. Department of
Agriculture, Forest Service, Pacific Southwest Research Station: Albany, CA, USA, 2017.
46. Kerhoulas, L.P.; Polda, W.; Kerhoulas, N.; Berrill, J.-P. Physiology and growth of Douglas-fir and redwood
seedlings planted after partial harvesting. Front. For. Glob. Chang. 2020, 23, 49. [CrossRef]
© 2020 by the authors. Licensee MDPI, Basel, Switzerland. This article is an open access
article distributed under the terms and conditions of the Creative Commons Attribution
(CC BY) license (http://creativecommons.org/licenses/by/4.0/).You can also read