Crystallization law of karst water in tunnel drainage system based on DBL theory
←
→
Page content transcription
If your browser does not render page correctly, please read the page content below
Open Physics 2021; 19: 241–255
Research Article
YongDong Wang*, Yang Liu, ChuFan Qi, TianYue Zhou, Ming Ye, and Tao Wang
Crystallization law of karst water in tunnel
drainage system based on DBL theory
https://doi.org/10.1515/phys-2021-0029
received January 21, 2021; accepted April 09, 2021
1 Introduction
Abstract: When a tunnel is constructed in a karst area, China has the largest karst area in the world, accounting
crystallization of the drainage pipe caused by karst water for 13.5% of the total area of the country; in particular, the
often threatens the normal operation of the tunnel. This proportion of the karst area in the southwest is as high as
work contributes to this field of research by proposing a 43% of the total karst landform area in China. In view of
functional model based on the diffusion boundary layer the mountainous geological environment in Southwest
(DBL) theory proposed by Dreybrodt in the 1990s. The China, tunnels and bridges are widely used in the traffic
model is formed by determining the flow rate distribution development process; the proportion of bridges and tun-
of the drainage pipe in a laminar flow state and turbulent nels in the traffic infrastructure is more than 70%, and as
state, and then by applying Fick’s diffusion law and high as 90% in some mountainous areas [1]. In addition
Skelland’s approximate formula. Then, to further verify to the widely distributed karst caves and underground
the applicability of the functional model, a model test rivers, accidents are prone to occur during the construction
was carried out in the laboratory and the test results of tunnels, which increases the construction and operation
are compared to the theoretical results. The results show costs [2,3].
that the crystallization rate of karst water is mainly Water is the natural antagonist of tunnel engineering.
affected by the roughness of the pipe wall, followed by In the early stage of tunnel construction, water and mud
the slope of pipes. The slope can affect flow state by
inrush caused by confined water poses a serious threat to
controlling the flow rate, which in turn affects the crystal-
tunnel excavation activities [4–7]. In the later stage, the
lization rate of karst water. When the slope of the drainage
leakage of lining water and the blockage of drainage pipes
pipe is 3, 4, and 5%, the error between the experimental
will not only affect the safety and normal service life of the
results and the theoretical calculation results is 24.7,
tunnel [8–10], but will also damage the ground buildings
8.07, and 27.9%, respectively, and when the liquid level
and water environment around the tunnel [11,12]. Due to
in the pipe is 7.2, 10.2, and 13.3 mm, the error is 27.9, 9.82,
the unique geological and hydrological conditions of the
and 2.07%, respectively. Considering that the flow will
karst geomorphic area of Southwest China, there are large
take away the crystalline deposits on the pipe wall in the
amounts of HCO−3 and Ca2+ (the ion content is more than
experiment, although some results have certain errors,
82%). In the weakly alkaline environment (the pH value is
they do not affect the overall regularity.
7.8–8.3), crystal precipitation easily occurs. In addition,
Keywords: tunnel engineering, DBL theory, crystallization the distribution of underground karst water is very uneven,
blockage, crystallization rate model, model test and the “tunnel life pipelines,” which are the vertical,
horizontal, and circular drainage pipes, are always affected
by crystal precipitation. Therefore, it is necessary to study
the plugging mechanism of tunnel drainage pipes in karst
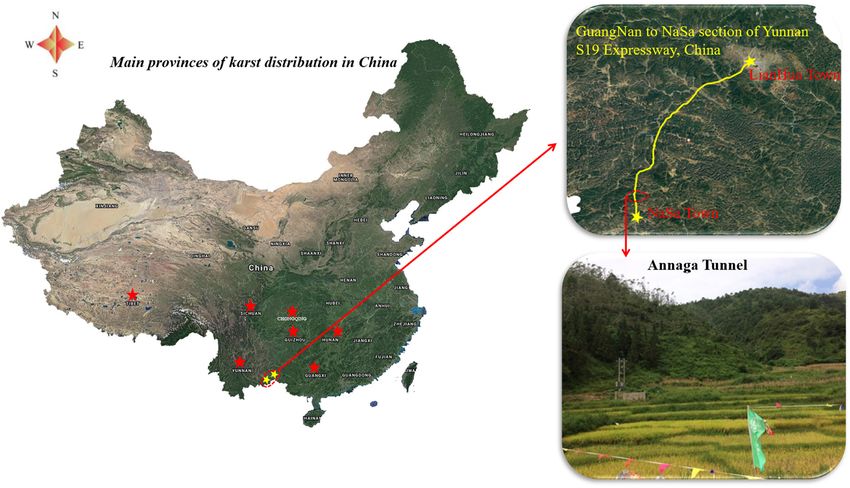
areas. The main karst landforms and related engineering
locations in China are shown in Figure 1.
The transportation and accumulation of solid parti-
cles by flow [13] and the dissolution and redeposition of
* Corresponding author: YongDong Wang, School of Highway,
soluble rock will cause the blockage of drainage pipes
Chang’an University, Xi’an 710064, China,
e-mail: wydchdgl@163.com
[14–17]. The former is a physical action, while the latter
Yang Liu, ChuFan Qi, TianYue Zhou, Ming Ye, Tao Wang: School of is a chemical action and often lasts for a long time; in
Highway, Chang’an University, Xi’an 710064, China fact, the latter is calcite calcification. To investigate the
Open Access. © 2021 YongDong Wang et al., published by De Gruyter. This work is licensed under the Creative Commons Attribution 4.0
International License.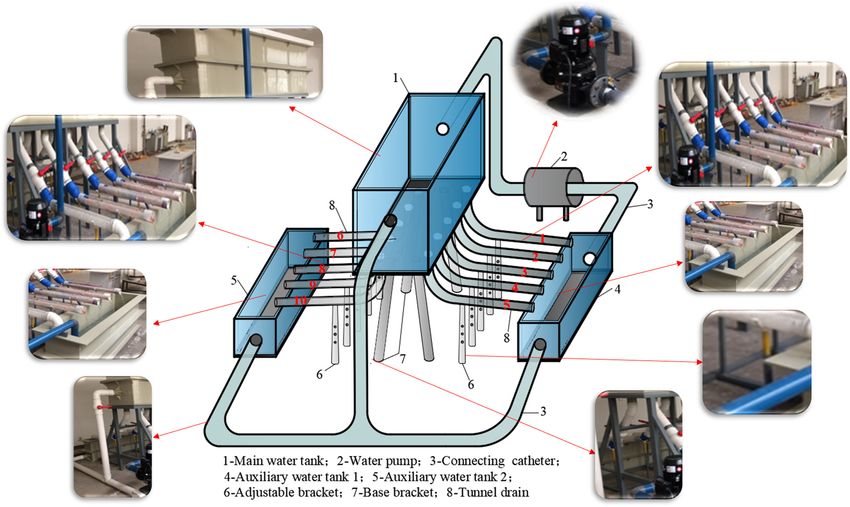
242 YongDong Wang et al.
Figure 1: The distribution of the main karst landforms in China and the research location.
crystal blockage of tunnel drainage pipes, it is essential pH, hydraulic gradient, flow rate, soil and water, micro-
to study the dynamic deposition of calcite in the pipes, organism, etc. [24–28,13]; however, these factors are
and the two well-known models by which to study this relatively single, and the comprehensive influence of
are the PWP surface reaction control model [18] proposed multiple factors has not been considered. The other
in the 1970s and the diffusion boundary layer (DBL) flow aspect is the analysis of methods for the elimination of
system control model [19] proposed in the early 1990s. crystal precipitates. Many scholars have studied the effect
Compared with the PWP model, the DBL model considers of flexible shock [29,30], geotextile filtration [31,32], and
the influences of hydrodynamic conditions (system fluidity) flocking drainpipe [33,34] on the elimination of crystal-
on the dissolution and deposition rates of calcite, the line deposits in drainage pipes from the perspective of
control of the CO2 conversion rate in solution, and the theory and experiment.
molecular diffusion effect of reactants near the solid– The previous research on the crystallization problem
liquid boundary layer; these considerations improve the of tunnel drainage pipes is mostly based on the physical
accuracy of the calculation results. The field test con- properties of water itself and studying the crystallization
ducted by Liu et al. [20,21] further validated the accuracy phenomenon occurring in the water. While in actual
of this model. Since the beginning of the twenty-first tunnel engineering, the crystallization mostly occurs on
century, the introduction of numerical methods, such as the wall of the drainage pipe, which shows that the crys-
the finite element method and discrete element method, tallization is not only related to water quality, but also
has provided convenience for the study of this problem the contact state between the water and the pipe wall.
[22,23]. However, too many assumptions in the diffusion This paper, based on the DBL theory, analyzes the flow
model result in the numerical simulation results being rate distribution of karst water in the drainage pipe under
quite different from practical engineering, and it can there- different flow patterns and establishes the crystallization
fore only be used for qualitative analysis. rate function of karst water on drainage pipe wall on the
In recent years, the research on tunnel drainage basis of considering the protrusion length and friction
system crystallization has mainly been conducted from coefficient of drainage pipe wall. Then, a model test is
two aspects. The first is the influencing factors, such carried out for three influencing factors, namely, the
as the water hardness, alkalinity, salinity, temperature, slope of the drainage pipe, the height of the free liquid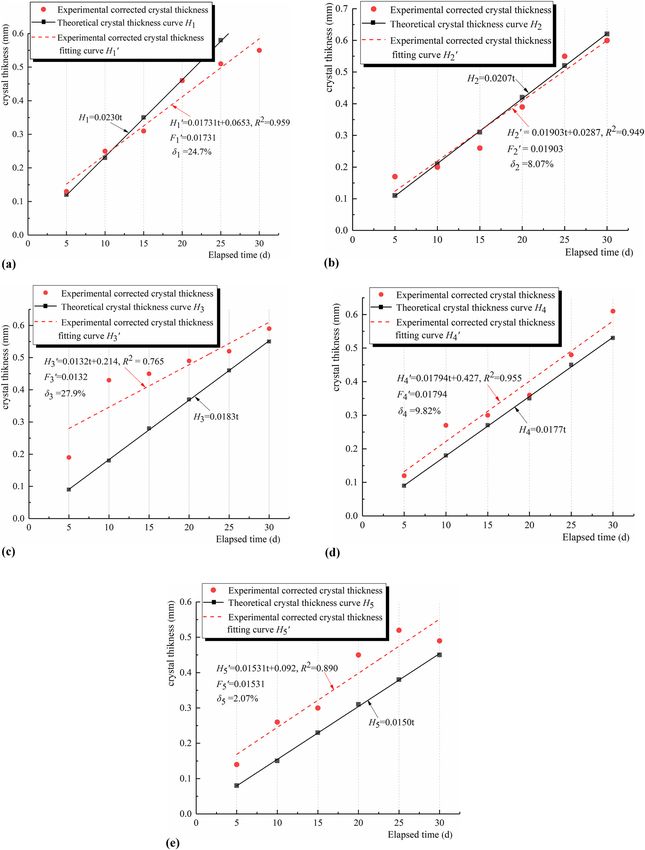
Crystallization law of karst water in tunnel drainage system 243
level in the pipe, and the roughness of the inner wall of
the drainage pipe. The experimental results are collected
and the validity of the function is verified, hence provi-
ding a theoretical basis for the study of the crystallization
blockage problem in karst areas.
2 Functional model of the karst
water crystallization rate in a
tunnel drainage pipe
Figure 2: Height of the free liquid level in drainage pipe.
2.1 Functional model of the karst water
crystallization rate in a laminar flow
state
2.1.1 Karst water laminar flow rate distribution in a
tunnel drainage pipe
The DBL model is primarily used to predict the calcifica-
tion deposition rate of a flow system [19], and the flow
characteristics (hydrodynamic conditions) are very impor-
tant for model establishment. The DBL thickness in dif-
ferent hydrodynamic conditions is significantly different
and will seriously affect the precipitation crystallization
rate. Therefore, it is necessary to determine the karst
water flow rate distribution before analyzing the crystal-
lization law. Figure 3: Flow rate distribution in the laminar flow state.
The karst water flow state in the tunnel drainage pipe
is complex, and whether the flow fills the entire drainage force near the axis of the drainage pipe is the least, and
pipe is unknown. In fact, when the flow fills the entire the flow rate is the largest, as shown in Figure 3. The
pipe, it is accompanied by a substantial amount of kinetic quadratic function expression of water in a drainage
energy, and it is difficult for the flow to maintain a pipe is given as follows:
laminar state under the action of the internal momentum.
u = umax (R2 − x 2 − h2 ) (1)
Therefore, it is reasonable to consider that the tunnel
drainage pipe is not full to study the karst water flow where umax is the largest flow rate in the section when the
rate distribution in a laminar flow state. The general tunnel drainage pipe is full, h is the height of the free
flow state of karst water in a drainage pipe in a laminar liquid level in the drainage pipe, and R is the radius of the
state is presented in Figure 2. drainage pipe.
Most tunnel drainage pipes are round, and the vis- The laminar shear stress can be calculated according
cous force is greater than the particle inertial force in the to equation (2):
laminar state. In this case, the flow state is very stable,
τ = ρgiR′ (2)
the fluid particles are not doped with each other, the
momentum and energy are not obviously exchanged, where τ is the laminar shear stress, ρ is the liquid density,
and the liquid velocity in the pipe has an approximately g is the acceleration of gravity and is generally consi-
parabolic distribution under the viscous force. The fric- dered to be 9.8 m/s2, i is the slope of the drainage pipe,
tion binding force is the largest at the pipe wall, and the R′ is the hydraulic radius, and when the pipe is filled with
flow rate is close to zero; in contrast, the friction binding water, R′ = R/2, where R is the drainage pipe radius.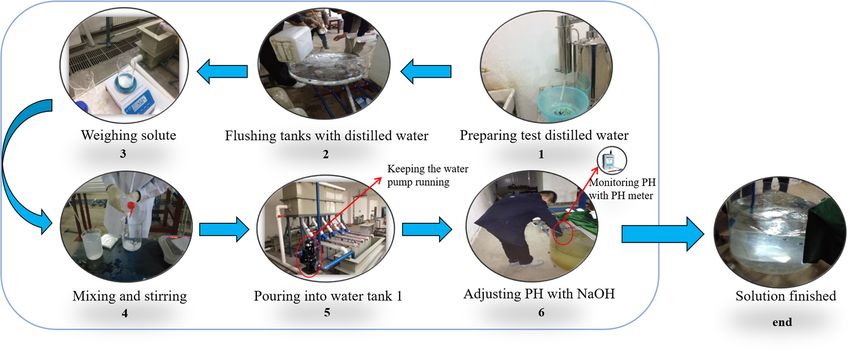
244 YongDong Wang et al.
When a Newtonian fluid moves in a circular pipe, the where Δx is the DBL thickness, L is the length of the test
inner part of the liquid follows the Newtonian friction piece along the flow direction, ν is the viscosity coefficient,
law. When karst water flows in a drainage pipe, the and ν = µ/ρ.
following is true: The DBL is very thin at the solid-liquid interface.
To calculate the DBL thickness, the flow rate in the limit
du
τ = −μ (3) region must be investigated. While equation (8) can be
dr
used to determine the flow rate distribution in a laminar
where μ is the dynamic viscosity coefficient, which is state, it is necessary to further obtain the flow rate near
related to liquid properties, and we take the value as the pipe wall. With the assistance of the Taylor series, the
the dynamic viscosity of water; u is the flow rate at a second-order expansion of equation (6) at r = R can be
liquid-free surface which away from the pipe axis is r. determined:
Substitution of equation (2) into equation (3) yields the
ρgi ρgi
following: u=0+ (R − r ) + (R − r )2 + o[(R − r ) 2] (10)
2μ 2μ
ρgiR
du = − dr (4) Because the DBL is very thin, the higher-order trace
2μ
can be omitted, and the flow rate near the pipe wall can
Simultaneously integrating both sides of this equation be determined:
yields the following:
ρgiR
ρgiR2
u= Δr (11)
u=− +C (5) 2μ
4μ
where Δr = (r0 − r) is a distance extremely close to the pipe
By substituting the critical condition r = R, u = 0, the wall, and it can be approximated that Δr = Δx. The flow
ρgiR2
constant C = 4μ
can be obtained. By substituting C into rate is then approximately proportional to the distance in
equation (5), the following can be obtained: the DBL. Therefore, equation (11) can be expressed by
equation (12):
ρgi 2
u(r ) = (R − r 2) (6) ρgiR
4μ u= Δx (12)
2μ
Substitution of r = 0 into equation (6) yields the
following: Substitution of equation (12) into equation (9) yields
the following:
ρgiR2
umax = (7) 1
4μ Lμ8 9 (13)
Δx = 2.36 4
The flow rate quadratic rectangular coordinate func- (giR)
tion of the height of the free water level can then be where L is considered to be the internal protrusion length
determined as follows: of the drainage pipe in this work.
ρgi 2 In equation (13), the factors that affect the molecular
u= (R − x 2 − z 2) z ≤ h (8) diffusion effect in the DBL are comprehensively consid-
4μ
ered; these include not only the external environmental
factors (the slope of the drainage pipe i, the diameter
of the drainage pipe R, the internal protrusion length of
2.1.2 Functional model of the karst water crystallization the drainage pipe L), but also the internal viscous effect
rate in a laminar flow state (the fluid density ρ and dynamic viscosity coefficient μ).
According to equation (13), with the increase of the slope
The dissolution or deposition flux of calcite in the DBL and radius of the pipe, the flow rate near the pipe wall will
model depends on the DBL thickness. To calculate the increase, and the DBL thickness will decrease. Additionally,
DBL thickness, the Skelland equation can be intro- with the increase of the internal protrusion length of the
duced [35]: drainage pipe, the DBL thickness will increase.
4 In the limited space of the drainage pipe, the diffu-
Δx = 2.7L 5
1 ν 5
(9) sion speed of components in the karst water is very slow.
u In the DBL area, because of the viscous resistance of the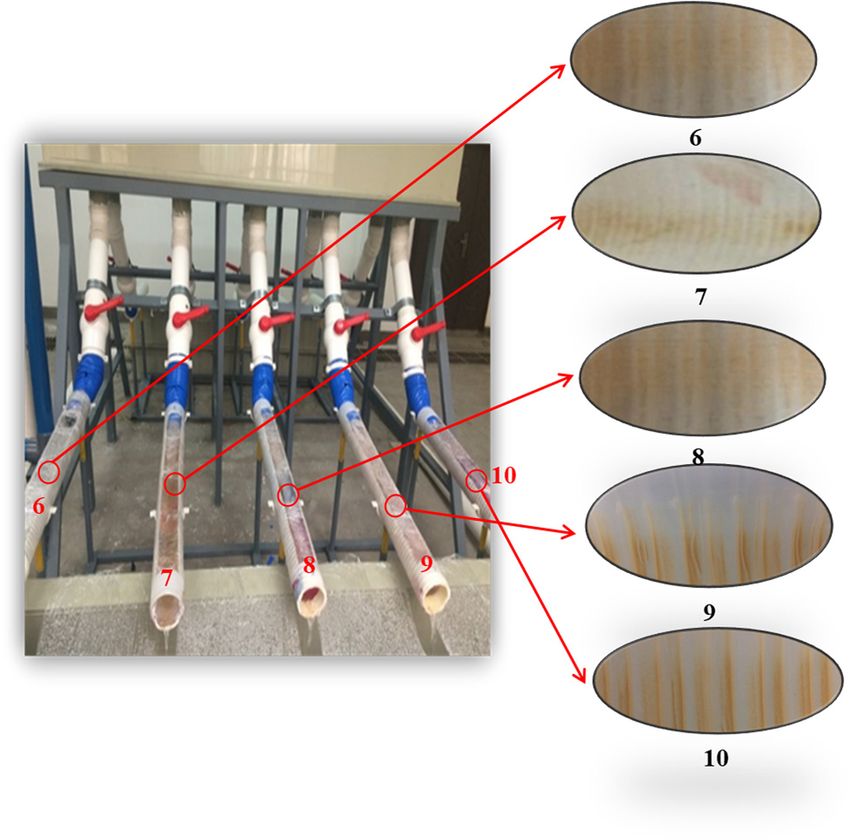
Crystallization law of karst water in tunnel drainage system 245
water, the solution is almost static and the diffusion (1) Turbulent core area: In this area, the fluid pulsation
speed of the solute is slower, so it can be approximately rate is very large and the momentum of fluid particles
considered that the diffusion process in the DBL is stable is frequently exchanged; therefore, the flow rate distri-
diffusion. Based on this assumption and Fick’s stable bution is quite different from that of the laminar state.
diffusion law, the deposition rate in the DBL can be Based on the mixed length theory, Prandtl proposed
expressed by equation (14): the flow rate empirical logarithmic function, and the
D dimensionless equation of this function is given by
F= (C Ca2+(solution) − C Ca2+(surface)) (14) equation (16).
Δx
u 1 uy
where D is the molecular diffusion coefficient, and its = ln ⁎ + c (16)
u⁎ k ν
value is 5 × 10⁻⁴ mm2/s [13]; C Ca2+(solution) is the concen-
tration of Ca2+ in the aqueous solution in the pipe, where u⁎ is the friction flow rate, and u⁎ = τ0/ ρ , τ0 is
C Ca2+(surface) is the concentration of Ca2+ on the surface the wall friction; y is the horizontal coordinate along
of the crystal precipitates, and it is determined by the direction of water; k and c are constants that must
C Ca2+(surface) = KCaCO3 . be determined by experiments, and under the full-pipe
By combining equations (13) and (14), the karst water condition, k is 0.4 and c is 5.5 [36].
crystallization rate in a laminar state can be determined (2) Transition area: The particle movement state in this
as follows: area is between the turbulent core area and viscous
4 bottom layer. This area is very thin and its flow rate
D(giR) 9 distribution and thickness are similar to the viscous
F= 1
(C Ca2+(solution) − C Ca2+(surface)) (15)
2.36(Lμ8 ) 9 bottom layer. The thickness of the transition area
cannot be considered when calculating viscous bottom
layer.
(3) Viscous bottom layer: As the boundary layer is close
2.2 Functional model of the karst water to the solid particles, the flow rate in this area is
slower due to the obstruction of the drainage pipe
crystallization rate in a turbulent state
wall, but the flow rate gradient changes substantially.
The fluid particles are mainly subjected to viscous
2.2.1 Karst water turbulent flow rate distribution in a
shear stress, the flow pattern is basically laminar,
tunnel drainage pipe
and the flow rate is distributed in a straight line.
According to Newton’s internal friction law, the flow
According to different flow conditions, the karst water in
rate in this area can be calculated by equation (17):
a tunnel drainage pipe can be divided into three areas,
namely, the turbulent core area, transition area, and vis- u uy
= ⁎ (17)
cous bottom layer, as illustrated in Figure 4. u⁎ ν
Figure 4: Schematic diagram of the flow rate zone in a turbulent state.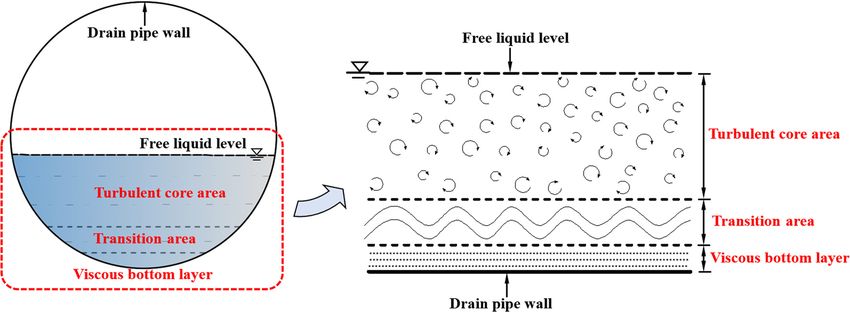
246 YongDong Wang et al.
2.2.2 Functional model of the karst water crystallization
rate in a turbulent state
The viscous bottom layer is very thin, and it is very
similar to a DBL in properties and genesis, so the viscous
bottom layer can be assumed as DBL [37]. If y′ is set as the
DBL thickness of the full pipe and y is set as the DBL
thickness of the unfilled pipe, because the flow rates in
the bottom of the turbulent core area are continuous in
the full-pipe state, the equation (18) is yielded by com-
bining equations (16) and (17):
u⁎ y′ 1 u y′ Figure 5: Distribution function of turbulent flow rate under the full-
= ln ⁎ + c (18)
ν k ν pipe condition.
Equation (18) is a nonlinear equation, and it is diffi-
cult to accurately solve it. To more conveniently fix the
Reynolds number Re* is related to the height of the free
DBL thickness in a full pipe, u/u* is taken as a vertical
liquid level h and the slope of the drainage pipe i, and the
coordinate and ln[(u*y′)/ν] is taken as a horizontal coor-
viscous shear stress consumes the work of gravity during
dinate. The function image of equations (16) and (17) in
the flow process.
the same coordinate system is presented in Figure 5.
Compared with the full-pipe state, equation (17) is
According to Figure 5, the critical interval of the
still valid, and only the values of coefficient k and c in
cohesive bottom layer (DBL) in the full pipe can be deter-
equation (16) change in an underfilled pipe; therefore,
mined by equations (19) and (20).
the DBL thickness in an underfilled pipe can be calcu-
u⁎ y′ lated by equation (24):
Cohesive bottom layer (DBL) : ≤ 11.6 (19)
ν kR
y= (24)
u y′ Re λ
Turbulent core area : ⁎ > 11.6 (20)
ν
After the tunnel drainage pipe is determined, with
Therefore, the DBL thickness in the full pipe can be the increase of the flow rate, the flow state in the pipe
calculated by equation (21): will gradually change from laminar to turbulent, and the
11.6ν process is continuous. Therefore, the critical Reynolds
y′ = (21)
u⁎ number Re* is continuous in its neighborhood when
the flow state in the DBL changes from laminar to turbu-
According to the Darcy–Weisbach equation, equation
lent. Then, by combining equations (13) and (24), the
(21) can be transformed into equation (22):
following is obtained:
32.8R
y′ = (22) 1
Re λ Lμ8 9 KR (25)
2.36 4
=
(giR) Re⁎ λ
where R is the diameter of the drainage pipe, λ is the head
loss coefficient, and the Reynolds number (Re) can be The coefficient K can then be determined by equa-
calculated by equation (23): tion (26):
1
iφ(h)
Re = ψ(i, h) = 2.36 Re⁎ λ Lμ8 9 (26)
μ k= (giR)4
R
R2 − h 2 −h (23)
ρgi Then, by substituting equation (26) into equation
=− 2
lμ
∫ ∫ (R2 − x2 − z 2 ) dz dx
(24), the DBL thickness in a turbulent state is calculated
− R2 − h 2 − R2 − x 2
as follows:
Equation (23) is the calculation equation of Re in an 1
underfilled pipe, where l is the wetted perimeter of the 2.36 Re⁎ Lμ8 9 (27)
y=
liquid surface. According to equation (23), the critical Re (giR)4 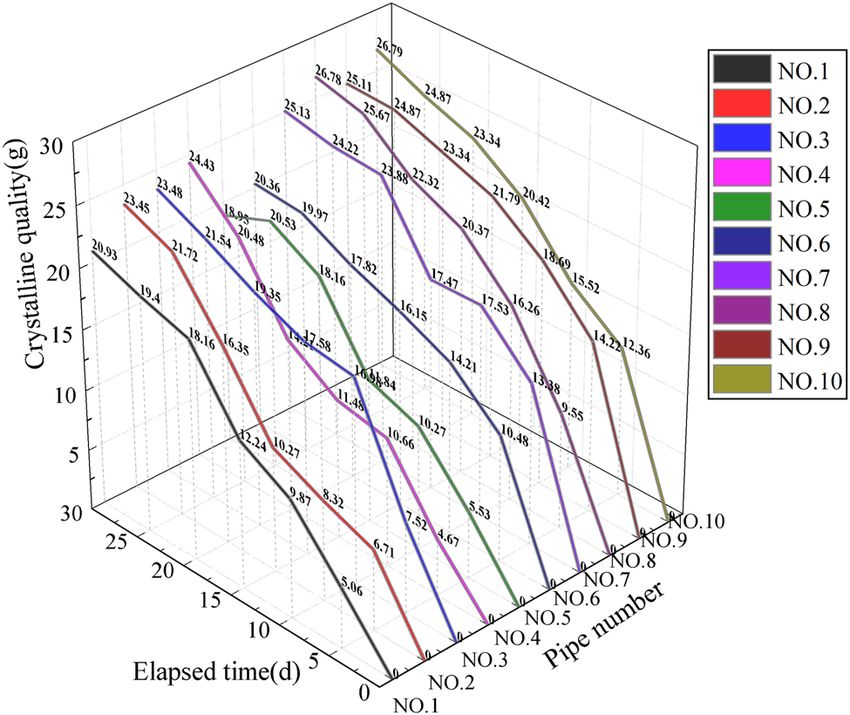
Crystallization law of karst water in tunnel drainage system 247
Finally, by combining equations (27) and (14), the
karst water crystallization rate in a turbulent state can
be calculated as follows:
4
Re D(giR) 9
F= (CCa2+(solution) − CCa2+(surface)) (28)
2.36 Re⁎ (Lμ8 ) 91
3 Model test
3.1 Water sample investigation and test Figure 6: Mechanism of crystallization and precipitation of carbo-
mechanism nate solution.
The water sample used in this study was taken from the
to maintain the cleanliness of an experimental environment
Annaga tunnel of the Guangna Expressway in Yunnan
and a continuous flow in a construction site. Because these
Province, China. The tunnel construction area is located
factors would affect the accuracy of experimental results,
in a subtropical zone, which has a mild climate and
a model test was carried out. The water sample analysis
abundant rainfall. Moreover, the underground water is
results show that HCO−3 and Ca2+ are the main ions. Based
rich and the surface water is relatively developed. The
on the principle of the main contradiction, Ca(HCO3)2 was
groundwater is mainly Quaternary pore water and carbo-
chosen as the main solute to prepare the solution and
nate karst water, and the karst is widely developed. A test
NaOH was used to adjust the pH value of the solution.
of a groundwater sample revealed that there are many
The experimental mechanism is presented in Figure 6.
different kinds of ions in the groundwater; the main
cations are Na+, K+, Ca2+, and Mg2+, and the main anions
are Cl−, SO24−, and HCO−3 . Of all the ions, the content of
Ca2+ is the highest of the cations, accounting for 26.52% 3.2 Experimental equipment and solution
of the total ion content, while the content of HCO−3 is the preparation
highest of the anions, accounting for 61.74% of the total
ion content. In addition, Al3+, Zn2+, Fe2+, and Fe3+ were A self-developed test system for crystal precipitation in
also found in the water sample, but the proportions were a tunnel drainage pipe that can realize self-circulation
very low; thus, they can be ignored. The specific compo- was adopted in the model test. The water solution can
sition of the water sample is presented in Table 1. circulate in the system without human intervention.
Karst water crystallization experiments take a long The whole system mainly comprised four parts, namely,
time and require higher water quality, and it is difficult a water storage system, power water supply system, drai-
nage pipe system, and support system. The water storage
system was composed of three customized water tanks,
Table 1: Analysis of the composition of a water sample from the including one main water tank with a capacity of 2,000 L,
Annaga tunnel (average) the size of which was 0.8 × 1.0 × 2.5 m, and two auxiliary
water tanks with a capacity of 528 L and a size of 0.4 × 0.5 ×
Polarity Type Concentration Content 2.2 m. The three water tanks had closed covers and were
(mmol/L) percentage (%) equipped with the solution. The dynamic system included a
Cation Na+ 0.003 0.04 KQL80 pump with a rated voltage of 380 V and a power of
Cation K+ 0.021 0.34 220 kW, and the power of the pump could be controlled
Cation Ca+ 1.635 26.52 by a Sanji S1100 frequency converter. The drainage pipe
Cation Mg+ 0.286 4.64
system mainly included an experimental drainage pipe
Anion Cl− 0.405 6.57
and connecting pipe, and the experimental drainage
Anion SO2−
4
0.005 0.08
pipe was the most important component in the experiment;
Anion HCO−3 3.801 61.74
the crystallization quality of the solution on the inner wall
Note: The pH value of the water sample was 7.86. was the focus of the experiment. The experimental drainage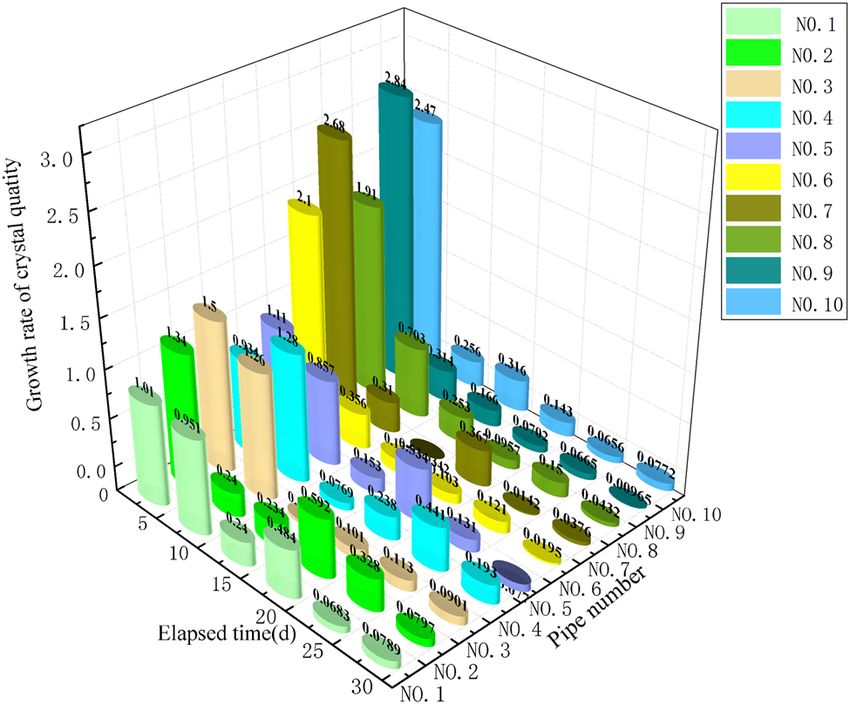
248 YongDong Wang et al.
pipe was a PVC corrugated pipe with a diameter of 100 mm, of HCO−3 and Ca2+ at a normal temperature, so they were
and the quantity was 10; the connecting pipe was DN110 ideal solutes to make the solution; the details of the
circular pipe with a diameter of 110 mm, and the quantity solution preparation process are presented in Figure 8.
was based on the experimental situation. The support During the process of solution preparation, distilled water
system mainly included the main water tank support and produced by a laboratory-level electric distilled water
the test drainage pipe adjustment support, which were used generator was used as a solvent. In process 5, all valves
to adjust the slope of the drainage pipe. The experimental in the test drainage pipe were closed when pouring the
device is presented in Figure 7. In the experiment, the solution that was dissolved in a small beaker into the main
frequency converter was used to adjust water pump 2 to water tank 1. At this time, the water pump was opened to
control the solution from the auxiliary tank 4 to flow into keep the distilled water in water tank 4 continuously
the main tank 1 through the connecting conduit 3 at a flowing into the main water tank 1 to ensure that the solute
certain flow rate. The pipe ball valve was adjusted to control in the main water tank 1 could be distributed evenly as
the solution flow from the main tank 1 to the auxiliary tanks soon as possible. In process 6, a pH meter was used to
4 and 5 through the corrugated pipe 8 at a certain rate, and monitor the solution pH in real-time, and the addition of
the solution moved through the whole system according NaOH was stopped when the pH value reached approxi-
to this mode during the experimental process. The solid mately 7.86. During the entire experiment, the solution of
crystallization quality was weighed after every cycle by a each water tank was sampled regularly to ensure that the
precision electronic scale. ion concentration and the pH value were stable.
The selection of the solute is a crucial step in the
process of preparing a solution and has a significant
impact on the final experimental results. In this experi- 3.3 Experimental setup
ment, the solution was prepared mainly based on Table 1.
However, the stability of Ca(HCO3)2 is not good, and it The experiment took place in a hydraulic laboratory. The
easily produces CaCO3 in water. In contrast, the mixture environmental temperature was relatively stable, the
solution of CaCl2 and NaHCO3 can maintain the stability solution temperature was 19.6°C, the CO2 concentration
Figure 7: Experimental equipment design.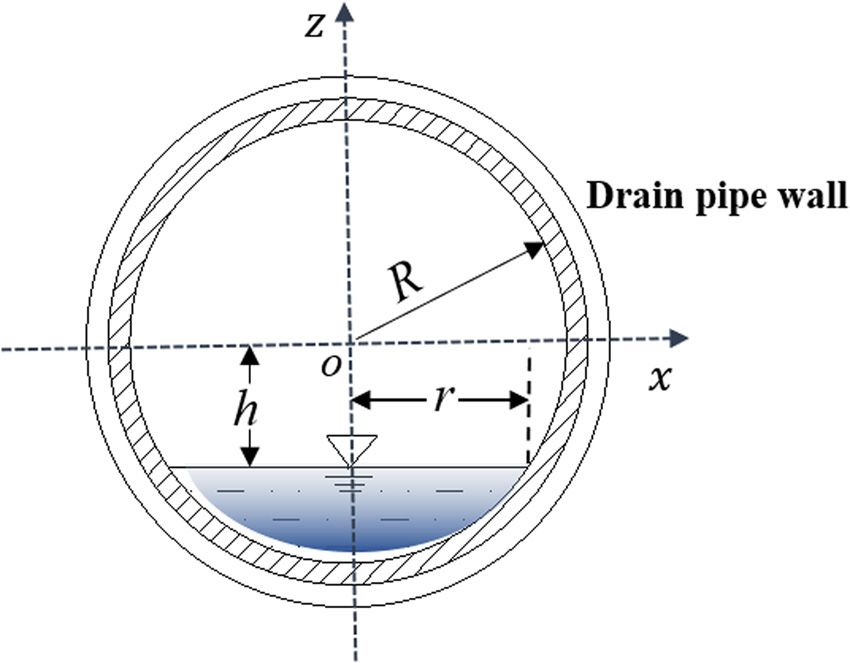
Crystallization law of karst water in tunnel drainage system 249
Figure 8: Solution preparation.
was between 520 and 570 ppm, and the effective dia- Previous theoretical investigation has shown that,
meter of the inner wall of the pipes was 97 mm. To avoid among the factors that affect the karst water crystalliza-
errors, the experimental drainage pipes were numbered tion law in tunnel drainage pipes, the environmental
from No. 1 to No. 10, as shown in Figure 7. The concen- temperature, the physical index of the liquid, and the
tration of Ca2+ in the solution was 1.635 mmol/L and the flow pattern in the drainage pipes are uncontrollable
concentration of HCO−3 was 3.801 mmol/L. The measure- factors. These factors are affected by the geological con-
ment cycle of the experiment was 5 days, and the experi- ditions and are not controlled by manpower, whereas
ment lasted for 30 days. The crystallization quality in factors such as the drainage pipe diameter, the drainage
each cycle was determined to infer the crystal volume, pipe slope, and the length of the protuberance in the
and then the crystallization thickness in each cycle was inner wall can be controlled artificially. From this point
calculated by the cross-sectional area of liquid overflow. of view, a control variable experiment was set up for the
On this basis, the crystallization rate of the experimental height of the free liquid level in the pipe, the slope of the
pipes was determined. The initial properties of the drainage pipe, and the friction coefficient, and the setting
experimental pipes are reported in Table 2. of these variables is reported in Table 3. The adjustment of
the slope of the drainage pipe was realized by adjusting
the height of the adjusting bracket under the experimental
drainage pipe. The height of the free liquid level in the pipe
Table 2: Initial properties of experimental pipes
was adjusted by controlling the valve rotation and the pump
Pipe No. Initial Effective Protuberance Protuberances power. The inner wall friction coefficient was set by placing
mass length length l2 (cm) quantity (n) cloth with different friction coefficients in the drainage pipe.
m0 (g) l1 (cm) The inner wall of pipe No. 6 was smoothed.
1 476.66 72.05 0.59 55
2 626.43 73.52 0.62 55
3 466.03 73.61 0.62 55
4 438.07 73.62 0.64 55
5 633.52 73.73 0.62 55 4 Results and discussion
6 610.34 73.37 0.68 55
7 442.33 71.26 0.59 55
8 606.38 73.84 0.62 55 4.1 Analysis of experimental results
9 379.34 73.12 0.61 55
10 467.26 73.13 0.59 55
The crystallization blockage of a tunnel drainage pipe is
Note: The protuberance length l2 is the test piece length L in the result of the joint action of internal factors (water
equation (9). quality, water temperature, solution pH, etc.) and external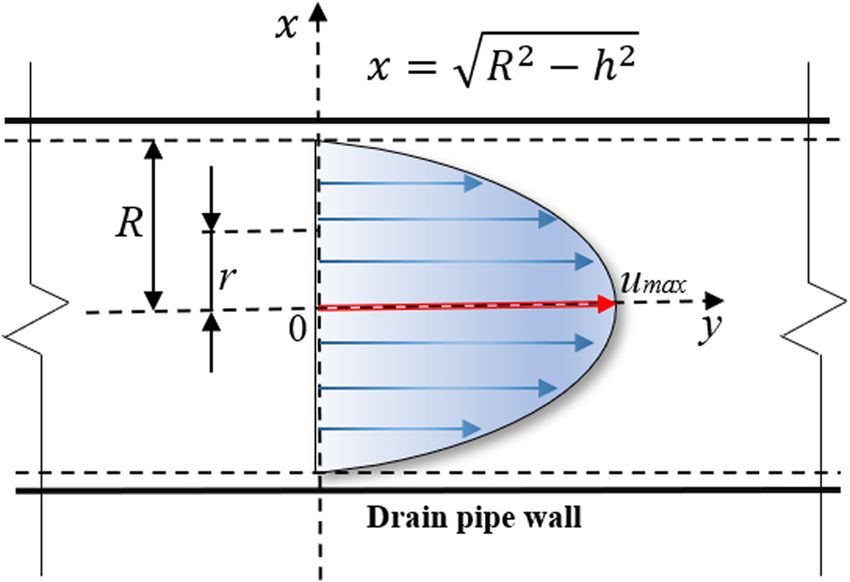
250 YongDong Wang et al.
Table 3: Experimental variable setting
Experiment group Pipe No. Height of the free Slope (%) Inner wall Initial flow
liquid level (mm) roughness rate (cm/s)
Slope 1 7.2 3 0.26 41.36
2 7.2 4 0.21 43.73
3 7.2 5 0.23 45.28
Height of the free liquid level 3 — — — —
4 10.2 5 0.27 41.83
5 13.3 5 0.24 39.86
Inner wall roughness 3 — — — —
6 7.2 5 0.12 43.36
7 7.1 5 0.53 42.11
8 6.8 5 0.65 40.41
9 7.0 5 0.69 43.78
10 7.3 5 0.83 39.19
factors (drainage pipe material, drainage pipe construc- The thickness of the precipitate at the convex position of
tion process, etc.). Internal factors are difficult to change the inner wall was the thickest and its color was more
due to the influence of geological conditions, whereas obvious, whereas there was less precipitate at the concave
external factors can be adjusted. In the experiment, due position of the inner wall and the color was not obvious.
to the sticking effect of the bulge on the inner wall of the During the experiment, the crystallization quality in
pipe, the flow rate at the bulge was less than the depres- the drainage pipe was measured every 5 days, and the
sion. According to equations (15) and (29), the crystalliza- change trend of the crystallization quality with time in
tion rate at the bulge is faster and the crystallization effect each cycle is presented in Figure 10. From Figure 10,
is more obvious, and these phenomena were verified we can found that the crystallization quality generally
by the experimental results, as presented in Figure 9. increased with time, but the development varied under
In Figure 9, the yellow areas are crystal precipitates; the different experimental conditions.
darker the color, the more precipitate there is. The preci- In the inner wall roughness group, the crystallization
pitate in the drainage pipe was distributed in strips. quality showed an obvious increasing trend with the
increase of the friction coefficient. The crystallization
qualities of pipes No. 7–No. 10 were concentrated in
25.0–27.0 g; it was obviously larger than No. 3 and No. 6
with lower friction coefficient. Compared to the other two
experiment groups, the crystallization phenomenon of
the inner wall roughness group is also obvious, which
means the friction coefficient has the greatest impact on
crystallization among all the influencing factors, and this
is consistent with the expectations. From the microscopic
point of view, the greater the friction coefficient, the
rougher the water surface, the larger the surface area of
karst water contacting the inner wall, the stronger the
resistance of the solute in the water flow. This will slow
the movement speed of anions and cations in the solution,
thereby making the two easier to combine and ultimately
resulting in the inevitable acceleration of the crystalliza-
tion rate, which are complementary.
In the slope group, the crystallization quality of pipe-
line No. 3 was greater than those of No. 2 and No. 1, and
the crystallization quality increased with the increase of
Figure 9: Crystallization distribution. the slope, which is consistent with inference of ref. [13]Crystallization law of karst water in tunnel drainage system 251
Figure 10: Crystallization quality of the drainage pipe in the test Figure 11: Crystallization quantity growth rate in each cycle.
period.
and the findings of the theoretical calculation model cliff-like decline that was much greater than those of the
derived previously in this paper. In fact, the gradient other two experimental groups, and the growth rate in the
controls the flow rate of the solution; the greater the gra- first cycle was also much larger than those of the other two
dient, the greater the flow rate. Thus, the flow in the pipe groups. These findings confirm the previous inference that
will convert to a turbulent state, and the critical flow rate the effect of the inner wall roughness on the crystallization
will also be faster, thereby thinning the DBL layer [19]. rate is obvious and is the most important factor considered
Therefore, the ions in the solute can more easily diffuse in this work. Compared with the inner wall roughness
through the DBL to the precipitation layer to crystallize group, the slope group and the free liquid level height
out, ultimately accelerating the precipitation rate. The group exhibited slower growth rates in the first cycle,
crystallization rate of pipe No. 3 slowed down obviously but the rapid-growth time was longer. The rapid accumu-
in the later period of the experiment because the inner lation of crystallization quality within two cycles (10 days)
wall friction coefficient increased with the continuous then stabilized. In the second stage, the crystallization
precipitation of crystals and their adhesion on the inner quality growth rate of pipe No. 2 decreased rapidly, which
wall of the drainage pipe, which slowed down the flow is most likely due to a measurement error of the crystal-
rate near the pipe wall and thickened the DBL, ultimately lization quality caused by the weak adhesion of the tiny
slowing down the crystallization rate. When the friction crystal nuclei and washing away by the water flow at the
coefficient reaches a certain degree, the effect of the fric- beginning of crystallization.
tion effect on solution crystallization is greater than that
of the diffusion layer effect, and the crystallization rate
will be accelerated again. 4.2 Comparison of the experimental and
To further understand the change of the crystalliza- theoretical values
tion rate with time, the increasing rate of the crystalliza-
tion quality in each cycle during the experiment was Because the inner wall of the bellows is uneven, the dis-
calculated, as shown in Figure 11. It can be seen that, tribution of crystal precipitation in the bellows is uneven.
with the increase of time, the increasing rate of the quality In order to facilitate the comparison, the crystal thickness
of each drainage pipe gradually decreased. The rapid- needs to be corrected; the corrected crystal thickness can
growth period of crystalline quality was mainly concen- be calculated as follows:
trated in the first cycle (the first 5 days), and starting from
m
the third cycle, the growth rate began to decrease rapidly, Δh = c Δh′ = c (29)
ρl1 S
and finally stabilized. This phenomenon was particularly
obvious in the inner wall roughness group. The third-cycle where Δh′ is the average thickness of the pipe crystal-
crystallization quality growth rate in this group exhibited a lization, and Δh′ = m / ρl1 S , m is the crystallization quality252 YongDong Wang et al.
measured in the experiment (see Figure 10), S is the area From Figure 12, it is clear that the experimental crys-
where the solution flows in the pipe, and ρ is the sediment tallization rates of pipes No. 2, No. 4, and No. 5 are close
density (ρ = 2.71 g/cm3, which is calculated by a density to the theoretical results, and the relative errors are all
test experiment). Additionally, c is the error correction within 10%. However, considering that pipe No. 2 had
coefficient of the sediment thickness caused by the inner crystallization loss, its crystallization rate will be slightly
protrusion of the pipe wall, and c = l / nl2 , l is the wet water greater than the fitting crystallization rate actually, and it
perimeter and l2 is the length of the inner wall protuber- is closer to or greater than the theoretical crystallization
ance of the pipe. rate. Additionally, the experimental crystallization rates
According to equations (15) and (28), it can be dis- of pipes No. 1 and No. 3 differ greatly from the theoretical
cerned that the crystallization rate is a determined value results with respective errors of 24.7 and 27.9%, but it
when all factors are determined. When the crystallization cannot be proven that the theory is not applicable. In fact,
precipitation area does not change significantly, the from the perspective of the crystal thickness, even when
crystallization thickness is proportional to the elapsed considering the crystallization loss of pipe No. 2, the
time. Taking pipes No. 1 through No. 5 as an example, phenomenon that the experimental crystal thickness
the theoretical crystallization thickness is presented in was greater than the theoretical crystal thickness is
Table 4. normal. On the one hand, the crystallization developed
By linearly fitting the experimental results, the Hn′ − t into a thin solid precipitation layer on the wall along
function (which describes the relationship between the with the continuation of the experiment, which increased
experimental crystallization thickness and time) was the friction coefficient of the water cross-section because
obtained. The experimental fitting function was then of the rough surface of the precipitation layer. The experi-
compared with the theoretical model function in one mental conditions were then changed and the crystal-
graph, as shown in Figure 12. From the figure, it is evi- lization rate increased, which made the experimental
dent that the dispersion of the experimental results is crystallization thickness greater than the theoretical
not high; excluding the lower regression coefficient of thickness. However, in the latter part of the experiment,
fitting function 3, the regression coefficients of the other the continuous development of the precipitation layer
functions are basically maintained at above 90%. This slowed down the flow rate in the DBL, which reduced
indicates that most of the experimental results are basi- the crystallization rate and slowed the growth rate of the
cally linearly distributed, which is consistent with the crystallization thickness. On the other hand, to calculate
assumption that the crystallization rate is constant when the theoretical crystallization thickness, it was assumed
all factors are determined. that the coverage area of the crystallization precipitation
In Figure 12, the slope of the Hn′ − t function repre- layer did not change with time; however, this assumption
sents the experimental crystallization rate in each pipe, is not perfect. With the continuous development of crystal-
δn represents the relative error between the experimental lization in the experiment, the attachment area of the
crystallization rate and the theoretical crystallization rate precipitation layer gradually increased, and the crystalli-
in each pipe, and δn can be calculated by equation (30): zation quality also increased correspondingly. This caused
the error to further expand, which is reflected in the figure
|F ′(n) − F(n)|
δn = × 100% (30) by the fitting function curve that is higher than the function
F(n)
curve of the theoretical model.
The theoretical functional model indicates that the
smoother the inner wall of the drainage pipe, the thinner
Table 4: Theoretical crystallization thickness of each pipe
the DBL, and the faster the crystallization rate. However,
consideration should be given to the problem that tiny
Experiment Pipe No. Theoretical Theoretical
group crystallization crystallization crystal nuclei stuck to the inner wall of the pipe at the
rate Fn thickness Hn beginning of the experiment. When the inner wall friction
(Hn = Fnt) coefficient of the pipe is less than a certain value, the tiny
Slope 1 F1 = 0.0230 H1 = 0.0230t crystal nuclei can be easily washed away before adhering
2 F2 = 0.0207 H2 = 0.0207t to the inner wall, which will slow the crystallization rate
3 F3 = 0.0183 H3 = 0.0183t to a certain degree. Research by Liu et al. [34] demon-
Free liquid 3 — — strated that flocking in the inner wall of the pipe can
level height 4 F4 = 0.0177 H4 = 0.0177t
significantly increase the inner wall friction coefficient,
5 F5 = 0.0150 H5 = 0.0150t
which will significantly slow the flow rate at the pipeCrystallization law of karst water in tunnel drainage system 253 Figure 12: Comparison of experimental fitting function and theoretical model function. (a) No. 1 (i = 3%, h = 7.2 mm) (b) No. 2 (i = 4%, h = 7.2 mm) (c) No. 3 (i = 5%, h = 7.2 mm) (d) No. 4 (i = 5%, h = 10.2 mm) (e) No. 5 (i = 3%, h = 13.3 mm). wall, increase the DBL thickness, and eventually cause be determined that the reference of the DBL theory is a decrease of the crystallization rate. Therefore, it can conditional. If the inner wall is too smooth or too rough,
254 YongDong Wang et al.
the use of only the DBL theory cannot correctly handle [2] Marinos PG. Tunneling and mining in karstic terrain: an engi-
the problem of the crystallization rate in the inner wall neering challenge. 8th Multidisciplinary Conference on
of the pipe. Sinkholes and the Engineering and Environmental Impacts of
Karsts. Louisville KY, USA: 2001.
[3] Zhao YJ, Wang FG, Li CS, Wu FS, Cao YQ. Carbonate karst
Erosion experiment research of Guizhou Huangguoshu tunnel.
5 Conclusion [4]
Coal Technol. 2016;35(7):310–2.
Zhao Y, Li PF, Tian SM. Prevention and treatment technologies
of railway tunnel water inrush and mud gushing in China.
Via the research presented in this paper, a functional J Rock Mech Geotech Eng. 2013;5:468–77.
model of the crystallization rate in a tunnel drainage [5] Hou TX, Yang XG, Xing HG, Huang KX, Zhou JW. Forecasting and
pipe based on the DBL theory was established, and its prevention of water inrush during the excavation process of a
diversion tunnel at the Jinping II Hydropower Station, China.
rationality was verified by a model test. The following
Springer Plus. 2016;5:1–19. doi: 10.1186/s40064-016-2336-9.
main conclusions can be drawn:
[6] Wu W, Zhao ZH, Duan K. Unloading-induced instability of a
(1) Under the action of molecular diffusion, the solute in simulated granular fault and implications for excavation-induced
karst water will pass through DBL and form crystal- seismicity. Tunn Undergr Space Technol. 2017;63:154–61.
lization on the pipe wall. When the liquid in drainage [7] Liu JQ, Chen WZ, Yuan JQ, Li CJ, Zhang QY, Li XF. Groundwater
pipe transits from laminar flow to turbulent flow, the control and curtain grouting for tunnel construction in completely
weathered granite. Bull Eng Geol Environ. 2018;77:515–31.
increase of flow rate will reduce the thickness of DBL,
[8] Wang TT. Characterizing crack patterns on tunnel linings
and then reduce the difficulty of solute passing through associated with shear deformation induced by instability
DBL, and ultimately accelerate the crystallization rate of neighboring slopes. Eng Geol. 2010;115:80–95.
of karst water. [9] Shin JH, Lee IK, Joo EJ. Behavior of double lining due to
(2) The crystallization rate of karst water in turbulent long-term hydraulic deterioration of drainage system.
state depends on Reynolds number Re and critical Struct Eng Mech. 2014;52(6):1257–71.
[10] Tan YQ, Smith JV, Li CQ, Currell M, Wu YF. Predicting external
Reynolds number Re*. The higher the Re/Re*, the
water pressure and cracking of a tunnel lining by measuring
faster the crystallization rate of karst water. water inflow rate. Tunn Undergr Space Technol. 2018;71:115–25.
(3) Among the factors considered in this paper, the most [11] Panthi KK, Nilsen B. Uncertainty analysis for assessing
influential factor on the crystallization rate of karst leakage through water tunnels: a case from Nepal Himalaya.
water is the inner wall roughness, followed by the Rock Mech Rock Eng. 2010;43:629–39.
[12] Yu SN, Jang JH, Han CS. Auto inspection system using a mobile
slope of the pipe, and finally the liquid level height.
robot for detecting concrete cracks in a tunnel. Autom Constr.
The slope can control flow rate, affect the liquid flow 2007;16:255–61.
pattern, and then affect the crystallization rate of [13] Zhou Z. Study on the plug of the tunnel drainage pipe
karst water; the liquid level height has a greater mechanism caused by groundwater seepage crystallization in
influence on the crystallization range, but has a Karst area and the proposal of treatment. Xi’an, China:
less influence on the crystallization rate. Chang’an University; 2015. p. 12–5.
[14] Jongtae W. A Study on analysis of influx path and ingredient of
(4) The application of DBL theory will be limited by the
sedimentation substance in tunnel drainage system. J Korea
inner wall roughness. When the pipe wall is too Inst Struct Maint Inspection. 2004;8(4):145–52.
rough or too smooth, the accuracy of the theoretical [15] Gamisch T, Girmscheid G. Life-cycle maintenance manage-
formula will be affected. ment of traffic tunnels-strategy assessment to develop new
calcification reduction methods in tunnel drainage system.
2nd International conference on structural and construction
engineering, Rome, Italy; 2003.
Acknowledgments: This work was supported by the Science [16] Jia N, Tassin B, Calon N, Deneele D, Koscielny M, Prevot F.
and Technology Project of Department of Transport of Scaling in railway infrastructural drainage devices: site study.
Yunnan Province (N0. YJKJ2019[54]). Innovative Infrastruct Solut. 2016;1:1–11.
[17] Wu ZL, Gui YJ, Barrett AG, Moreno MM, Deng YF. Role of
surrounding soils and pore water in calcium carbonate
Conflict of interest: Authors state no conflict of interest.
precipitation in railway tunnel drainage system.
Transportation Geotech. 2019;21:1–8.
[18] Chen YF, Cui YJ, Barrett GA, Chille F, Lassalle S. Investigation of
References calcite precipitation in the drainage system of railway tunnels.
Tunn Undergr Space Technol. 2019;84:45–55.
[1] Li CS, Gao B, Mei ZR. Karst and groundwater advance predic- [19] Dreybrodt W, Buhmann D. Amass transfer model for dissolution
tion techniques. 1st ed. Chengdu, China: Southwest Jiaotong and precipitation of calcite from solutions in turbulent motion.
University Press; 2013. p. 1–3. Chem Geol. 1991;90(1–2):107–22.Crystallization law of karst water in tunnel drainage system 255
[20] Liu ZH, Svensson U, Dreybrodt W, Yuan DX, Buhmann D. [28] Pavla R, Zdenek P, Hana S, Petr B, Pavel T. The role of
Hydrodynamic control of inorganic calcite precipitation in bacterially induced calcite precipitation in self-healing of
Huanglong Ravine, China: field measurements and theoretical cement paste. J Build Eng. 2021;39:1–11.
prediction of deposition rates. Geochimica et Cosmochimica [29] Xin ZH, Moon JH, Kim YU. Effect of vibration of flexible
Acta. 1995;59(15):3087–97. transducer on shear resistance of scaling in tunnel drainage.
[21] Liu ZH, Dreybrodt W. Dissolution kinetics of calcium carbonate KSCE J Civ Eng. 2017;21(5):1929–32.
minerals in H2O-CO2 solutions in turbulent flow: the role of the [30] Xin ZH, Moon JH, Kim YU. Reduction of adherent forces of
diffusion boundary layer and the slow reaction H2O + CO2 ↔ H+ + sedimentous contaminants in tunnel drainage using vibrations
HCO3−. Geochimica et Cosmochimica Acta. from flexible and transparent organic films. KSCE J Civ Eng.
1997;61(14):2879–89. 2018;22(7):2619–22.
[22] Romanov D, Gabrovsek F, Dreybrodt W. Leakage below dam [31] Kim KH, Park NH, Kim HJ, Shin JH. Modelling of hydraulic
sites in limestone terrains by enhanced karstification: deterioration of geotextile filter in tunnel drainage system.
a modeling approach. Environ Geol. 2007;51:775–9. Geotext Geomembr. 2019;48:210–9.
[23] Arvidson RS, Fischer C, Luttge A. Calcite dissolution kinetics- [32] Yoo C. Hydraulic deterioration of geosynthetic filter drainage
A comment upon “Evidence and potential implications of system in tunnels–its impact on structural performance of
exponential tails to concentration versus time plots for tunnel linings. Geosynth Int. 2016;23(6):463–80.
the batch dissolution of calcite by V. W. Truesdale”. [33] Liu SY, Zhang XF, Gao F, Wei LW, Liu Q, Lü HY, et al.
Aquat Geochem. 2015;21:415–22. Two-dimensional flow field distribution characteristics
[24] Xue DD. The study of influencing factors and prevention on of flocking drainage pipes in tunnel. Open Phys. 2020;
scaling of leachate pipe. Chengdu, China: Southwest Jiaotong 18:139–48.
University; 2008. [34] Liu SY, Gao F, Zhang XF, Han FL, Zhou YF, Xiang K, et al.
[25] Yu JF, Huo J, Yuan CG, Tang SM. The prediction for calcium Experimental study on anti-crystallization law of tunnel
carbonate scaling trend in brine pipeline in Jiangsu oilfield. transverse flocking drainpipe at different velocities.
J Salt Chem Ind. 2011;40(5):7–9. ASIA-PACIFIC J Chem Eng. 2020;15:1–9.
[26] Shi Y, Ren K, Wei SY, Zhou XP. Influencing factors for calcium [35] Liu ZH, Dreybrodt W. The DBL model and prediction of calcite
carbonate deposition of karst streams: a case study of dissolution/precipitation rates. Carsol Sin. 1998;17(1):1–7.
Baishuwan spring and its stream in Nanchuan, Chongqing. [36] Zhao ZX, He JJ. Hydraulics. 2nd ed. Tsinghua University Press;
J Southwest Univ (Nat Sci Ed). 2015;37(2):89–95. 2010. p. 95–6.
[27] Wu ZL, Cui YJ, Barrett AG. The control method of scale in [37] Boudreau B, Jørgensen BB. The benthic boundary layer:
drainage pipe of deteriorated tunnel used magnetic field transport processes and biogeochemistry. Oxford University
and quantum stick. Transportation Geotech. 2019;21:1–34. Press; 2001. p. 658–9.You can also read