Learning-Based Stock Market Trending Analysis by Incorporating Social Media Sentiment Analysis
←
→
Page content transcription
If your browser does not render page correctly, please read the page content below
Learning-Based Stock Market Trending Analysis by Incorporating Social Media Sentiment Analysis Zhaoxia Wang ( zxwang@smu.edu.sg ) Singapore Management University https://orcid.org/0000-0001-7674-5488 Zhenda HU Shanghai University of Finance and Economics Fang LI Nanyang Technological University Seng-Beng HO Institute of High Performance Computing Research Article Keywords: Social Media Sentiment Analysis, Machine Learning, Technical Analysis, Stock Market Trending Posted Date: April 28th, 2021 DOI: https://doi.org/10.21203/rs.3.rs-181424/v1 License: This work is licensed under a Creative Commons Attribution 4.0 International License. Read Full License
Noname manuscript No.
(will be inserted by the editor)

Learning-Based Stock Market Trending Analysis by
Incorporating Social Media Sentiment Analysis
Zhaoxia WANG1             · Zhenda HU2 · Fang LI3 · Seng-Beng HO4

Received: date / Accepted: date

Abstract
Stock market trending analysis is one of the key research topics in financial analysis. Various theories once high-
lighted the non-viability of stock market prediction. With the advent of machine learning and Artificial Intelligence
(AI), more and more efforts have been devoted to this research area, and predicting the stock market has been
demonstrated to be possible. Learning-based methods have been popularly studied for stock price prediction.
However, due to the dynamic nature of the stock market and its non-linearity, stock market prediction is still one
of the most difficult tasks. With the rise of social networks, huge amount of data is being generated every day
and there is a gaining in popularity of incorporating these data into prediction model in the effort to enhance the
prediction performance. Therefore, this paper explores the possibilities of the viability of learning-based stock mar-
ket trending prediction by incorporating social media sentiment analysis. Six machine learning methods including
Multi-Layer Perception, Support Vector Machine, Naı̈ve Bayes, Random Forest, Logistic Regression and Extreme
Gradient Boosting are selected as the baseline model. The result indicates the possibilities of successful stock
market trending prediction and the performance of different learning-based methods is discussed. It is discovered
that the distribution of the value of stocks may affect the prediction performance of the methods involved. This
research not only demonstrates the merits and weaknesses of different learning-based methods, but also points
out that incorporating social opinion is a right direction for improving the performance of stock market trending
prediction.
Keywords Social Media Sentiment Analysis · Machine Learning · Technical Analysis · Stock Market Trending

                                                             1 Introduction
    Zhaoxia WANG
zxwang@smu.edu.sg                                            In recent years, stock market trending analysis has be-
                                                             come one of the more popular research areas due to the
    Seng-Beng HO
hosb@ihpc.a-star.edu.sg                                      high returns of the stock market. Stock market time
                                                             series has been characterized as dynamic and largely
 1
     School of Computing and Information Systems, Singa-     non-linear, and stock price prediction is a challenging
pore Management University, Singapore                        task (Bollen et al. 2011; Patel et al. 2015). Given the
 2                                                           dynamic nature of the stock market, the relationship
    School of Information Management and Engineering,
Shanghai University of Finance and Economics, Shanghai       between market parameters and target price is not lin-
                                                             ear. This results in many economists’ belief that stock
 3
    School of Computer Science and Engineering, Nanyang      market prediction does not seem to be viable, and this
Technological University, Singapore                          is being explained by the Efficient Market Hypothesis
  4                                                          (EMH) and Random Walk Theory (RWT)(Bollen et al.
     Social and Cognitive Computing Department, Institute
of High Performance Computing(IHPC), Agency for Science,     2011; Patel et al. 2015; Dutta and Rohit 2017). EMH
Technology and Research (A*STAR), Singapore                  states that the price of a security reflects all information
2
available and everyone has access to the information. As Technical Indicators. The model utilized a three-stage
for RWT, it states that stock market prediction is im- method to determine the final trend prediction based
possible as prices are determined randomly, and hence on intermediate predictions. 3. Abundant experiments
outperforming is infeasible. were conducted on six stocks data including Dow Jones
However, with the advent of modern technologies Industrial Average (DJIA), Google (GOOG), Amazon
such as machine learning and Artificial Intelligence (AI), (AMZN), Apple (AAPL), eBay (EBAY) and Citigroup
more and more researches have started venturing into (C). The proposed model outperformed several baseline
the possibilities of using AI technologies such as Ma- models for predicting stock’s trend, which proved the
chine Learning and Deep Learning in stock market trend- effectiveness of relevant social sentiment and Technical
ing analysis and prediction. As early as in the 1990s, Indicators.
Varfis et al. (1990) had tried to apply artificial neu- The rest of the paper is organized as follows: “Re-
ral network to financial time series tasks [31]. In addi- lated Work” section discusses the related work about
tion, researchers are constantly improving the predic- stock prediction and “The Proposed Methodology” presents
tion models in the attempt to further enhance the per- the proposed stock trending prediction methodology.
formance of stock market predictions. More and more “Experiment and Discussion” shows parameter setting
different machine learning and deep learning methods in the experiments and discusses the results of the ex-
such as Support Vector Machine (SVM), Artificial Neu- periments. “Conclusion, Limitations and Future Work”
ral Network (ANN), Long Short-term Memory Net- section presents the conclusion obtained from the ex-
works (LSTM) and their fusion models have been ap- periments and future work.
plied to stock market predictions (Rather et al. 2015;
Hafezi et al. 2015; Li et al. 2017; Lee et al. 2019; Kim
2003). 2 Related Work
Inspired by behavioral finance, researchers began
There are many internal and external factors influenc-
to add information that can reflect investors’ behav-
ing the stock price in the stock market. And the fluctu-
ior to the stock forecasting model. Bollen et al. (2011)
ation of stock price volatility is not only affected by
used the emotion tracking tool to analyze the content
macro monetary policy, but also affected by macro-
of tweets and used the generated emotion time series
economic environment and emergencies. According to
to predict the change rate of the Dow Jones Industrial
the different mechanisms of stock price prediction, the
Index. After that, many researchers began to use the
related work is reviewed under two different aspects as
tools that can reflect or influence the market to study
follows.
the stock market from the emotional and psychologi-
cal information of participants. Furthermore, with the
rise of social networks, huge amount of data is being 2.1 Stock Forecasting Based on Stock Price
generated every day. And there is a gaining in pop-
ularity of using these data to enhance the prediction Compared with the traditional algorithm, machine learn-
performance (Bharathi and Geetha 2017; Ichinose and ing algorithm has the capability of processing large amount
Shimada 2018; Zhang et al. 2018; Si et al. 2014; Wang of data and multi-dimensional data. Due to the bet-
et al. 2018; Nguyen et al. 2015; Li et al. 2017; Hu et al. ter prediction performance, more and more researchers
2018;). applied machine learning algorithms to stock market
In this research work, we proposed a hybrid Ma- trending analysis and prediction.
chine Learning model to predict the stock’s trend. The As learning-based methods, Support Vector Machine
hybrid model is an integration of Machine Learning Al- (SVM), Neural Network and Naı̈ve Bayes (NB) are widely
gorithms such as Artificial Neural Network (ANN) with applied in the field of financial forecasting (Huang et al.
Social Media Sentiment Analysis and Technical Indi- 2005; Nacini et al. 2010; Huang et al. 2008). Support
cators. The results show that the performance can be Vector Machine (SVM) is known to have capacity con-
improved when relevant social sentiment and Technical trol of decision function, use of kernel functions and
Indicators are considered. sparsity of solutions (Wang et al. 2020b). It has been
The contributions of this paper are summarized as applied to stock market analysis and has been verified
follows: 1. This paper solves the stock trending problem to be effective when it is being compared with other
as a typical classification problem to predict the trend- algorithms, such as the Random Walk Model (RW),
ing of the stock price. 2. This paper proposes a hybrid Linear Discriminant Analysis (LDA), Quadratic Dis-
Machine Learning model integrating Machine Learning criminant Analysis (QDA) and Elman Backpropaga-
Algorithms with Social Media Sentiment Analysis and tion Neural Networks (EBNN) (Huang et al. 2005). It3
has been used for stock market daily price prediction sion Tree (GBDT) can effectively improve the stock pre-
(Henrique et al. 2018; Marković et al. 2017) and Pro- diction results, the relatively slow detection rate limits
ducer Price Index (PPI) prediction (Tang et al. 2018). the method. In order to find a fast and high accuracy
Although the feasibility was proved, the research also prediction method, XGboost model is used for stock
pointed out the limitations for solving such problem prediction, which can improve the prediction accuracy
as a regression task (Henrique et al. 2018). And Neu- as well as the prediction speed.
ral network is known to have the capability for pattern In recent years, with the development of deep learn-
recognition (Anitescu et al. 2019). Nacini et al. (2010) ing technology, many stock forecasting models based
compared feed forward Multi-Layer Perception (MLP) on deep learning have been proposed. Fischer et al.
and Elman recurrent network by leveraging linear re- (2018) studied the application of LSTM in financial
gression. Their experiment showed that linear regres- market forecasting by using stack LSTM and bidirec-
sion was comparatively better in terms of predicting the tional LSTM to forecast the SP 500 index. By com-
direction of changes on the next day, whereas MLP dis- paring with deep network, random forest and logis-
played a lowest error in predicting the amount of value tic regression model, the empirical results show that
changed. This implied that neural networks adapted LSTM has higher forecasting accuracy. Nelson et al.
well to the dynamic nature of the stock market by pro- (2017) used LSTM model to analyze five stocks from
viding the lowest error rate. From the perspective of the the Brazilian stock market and compared the forecast-
relationship between the stock technical indicators and ing results of LSTM, MLP, random forest and pseudo-
the stock market, Göçken et al. (2016) used harmony random with statistical testing and trading strategies,
search algorithm and genetic algorithm to select the and proved that the accuracy of LSTM is higher. Stoean
most relevant technical indicators and applied them to et al. (2019) used LSTM and CNN to build stock predic-
the artificial neural network for stock price prediction. tion models respectively and established trading strate-
The experimental results show that the mean absolute gies according to the prediction results. Kim et al. (2019)
percentage error of the ANN model based on harmony combined LSTM and CNN model to predict stock data
search and genetic algorithm is 3.38% and 3.36% re- from two perspectives of time series and stock image.
spectively, which is better than the model only using Image data is also used for stock market forecasting.
ANN algorithm. As for Naı̈ve Bayes (NB) based predic- Sezer and Ozbayoglu (2020) directly used 2-D stock bar
tion method, it’s a type of supervised learning method chart images to trained a deep Convolutional Neural
that learns from historic records or expert’s knowledge Network (CNN) for stock trading model and obtained
and utilizes probabilistic approaches to find an optimal promising results.
solution (Zhu et al. 2020). Huang et al. (2008) utilized
a set of independent data which was collected randomly
from Taiwan Stock Exchange Corporation (TSEC), and
2.2 Stock Forecasting with Social Media Sentiment
9 attributes were used to build the NB predictor. Their
Analysis
result showed successful prediction, with a probability
of 13.46% of making a loss. This implies the possibil- Social media sentiment analysis is a popular research
ity of using the NB based predictor for stock market area in the Natural Language Understanding (NLU)
prediction in getting good results. domain that identifies and categorizes opinions that are
Besides the traditional machine learning methods expressed in news, articles, tweets or text (Wang et al.
mentioned above, there are some Ensemble Learning 2016; Wang et al. 2020a). In the field of stock market
(EL) methods used to forecast future trends of stock prediction, it is often used as an indicator of the public
price movements (Khaidem et al. 2016; Chen and Guestrin sentiment towards events and scenarios. There are sev-
2016). Random Forest (RF) can overcome overfitting eral ways to incorporate Sentiment Analysis into stock
problems by training multiple decision trees on differ- market prediction. The very popular method is to feed
ent subspaces of the features at the cost of slightly in- the sentiment value as an input and another method
creased bias. The previous experiment indicated that is to use it as an external factor that will affect the fi-
RF resulted in high accuracy rate for all periods, and nal prediction (Bharathi and Geetha 2017; Ichinose and
the longer the trading period, the higher the accuracy Shimada 2018; Zhang et al. 2018; Si et al. 2014; Wang
rate (Khaidem et al. 2016). XGboost was proposed by et al. 2018; Nguyen et al. 2015; Li et al. 2017; Hu et al.
Chen and Guestrin (2016). It was proved that XGboost 2018;).
has the characteristics of low computational complexity, Bharathi and Geetha (2017) aimed to present the
fast running speed and high accuracy. For the analysis impact of Really Simple Syndication (RSS) feeds on
of time series data, although Gradient Boosting Deci- stock market values. The approach of this article is to4
utilize the Sentiment Analysis result as an external fac- of the stocks. Considering that different events may af-
tor that is used together with the Sensex-Moving Aver- fect public sentiments and emotions differently, the pa-
age results to produce a final-result prediction of the per proposed a learning-based method which incorpo-
trend. Ichinose and Shimada (2018) proposed a sys- rated social and news opinion and sentiment analysis to
tem that utilized Bag of Keywords from expert articles predict stock price. Besides public sentiment, Khan et
(BoK-E) to predict the trend of the next day. In the ex- al. (2019) also explored the effect of political situation
periment conducted, it was reported that the average on the stock prediction accuracy. And the experimen-
accuracy obtained using BoK-E was 61.8%, which is a tal results show that the sentiment feature improves
9.5% increase in accuracy compared to using standard the prediction accuracy of machine learning algorithms
Bag of Word approach. Zhang et al. (2018) utilized the by 0–3% while political situation feature improves the
correlation of events from web news and public senti- prediction accuracy of algorithms by about 20%.
ments from social media and stock movement to deter- Different from the work done above, this paper aims
mine the next day trend. The proposed coupled stock to solve the stock trending problem as a typical clas-
correlation (CMT) method (62.50%) performs better sification problem to predict the trending of the stock
compared to models without stock correlation informa- price, e.g., Buy or Rise (1), Sell or Drop (-1) and Hold
tion (60.25%)). (0). The research work and findings of this research not
In addition, Si et al. (2014) proposed the use of a Se- only demonstrate the merits of the proposed method,
mantic Stock Network (SSN) to model the relationship but also point out the correct direction for future work
between stocks. It proves that the utilization of SSN in this area.
has a higher capability than Correlation Stock Network
(CSN) to predict the stock market. And Nguyen et al.
3 The Proposed Methodology
(2015) incorporated aspect-based Sentiment Analysis
into SVM for stock market prediction and showed the
The performance of various learning-based methods has
effectiveness of aspect-based methodology. Based on the
been demonstrated by different researchers using differ-
experimental results, it was observed that the proposed
ent stock market datasets. This research aims to lever-
approach achieved 9.83% better accuracy compared to
age the same stock market time series data to investi-
method that only uses historical prices and is 3.03%
gate the performance of different learning-based meth-
better than Human Sentiment methodology.
ods by incorporating social media sentiment analysis.
There is also a gaining in popularity of using Twit- In this section we propose a new stock market data
ter data for Sentiment Analysis (Li et al. 2017). In analysis method to investigate and compare different
addition, Li et al. (2017) also suggested that the pro- learning-based methods in a unique way which consid-
posed approach of using Twitter data for stock market ers data correlation analysis between different stocks.
prediction achieved a better performance when using The proposed methodology consists of 3 phases, each
Tweets’ sentiment values to predict the stock price of with multiple steps.
three days later. Gupta and Chen (2020) analyzed the
StockTwits tweet contents and extracted financial sen-
timent using a set of text featurization and machine 3.1 Stock Data Pre-processing
learning algorithms. The correlation between the ag-
gregated daily sentiment and daily stock price move- Various stocks from SP 500 were identified and retrieved
ment is then studied. And the effectiveness of the pro- from Yahoo Finance (https://sg.finance.yahoo.com). The
posed work on stock price prediction is demonstrated period for data extraction was between 1st Jan 2000 to
through experiments on five companies (Apple, Ama- 26th Dec 2018. Entries in the data include:
zon, General Electric, Microsoft, and Target). In addi- • Date: Index of each record
tion, Google Trends data is used to provide the search • Open: Price of stock at opening of trading (in
volume for keywords searched such that the model can USD)
determine the impact of events that might affect the • High: Highest price of stock during trading day
stock market. Hu et al. (2018) considered the use of (in USD)
Google Trends data in improving the performance of • Low: Lowest price of stock during trading day (in
stock market prediction. According to the experimen- USD)
tal results, Google Trends is capable of enhancing the • Close: Price of stock at closing of trading (in USD)
accuracy in predicting the trend of the stock market. • Volume: Amount of stocks traded (in USD)
This paper solved the stock trending prediction prob- • Adjusted Close: Price of stock at closing adjusted
lem as a typical regression problem to predict the price with dividends (in USD)5
Learning-based methods can be leveraged to analyze -Step 2: In this pre-processing stage, duplicated News
all the time series datasets, such as “Open”, “High”. is first be removed and redundant punctuations, special
“Low”, “Close” and “Adjusted Close” for the stock characters and short words (less than 2 characters long)
market data. In this paper, we illustrate the results of are then removed. Next, the New York Times News un-
analyzing “Adjusted Close” time series for the purpose dergoes Tokenization, Stemming and lastly, joining the
of comparing different prediction methods. stemmed tokens back to form a stemmed sentence.
All available stock market data were downloaded -Step 3: The pre-processed dataset then undergoes
for analysis, which were daily data. The trending is Sentiment Analysis to determine the daily sentiment
grouped under Buy or Rise (1) when the percentage value (polarity). The sentiment scores (compound score)
change is above +1% and Sell or Drop (-1) when the is then calculated using the vaderSentiment library. To
percentage change is below -1%, else it would be under derive the daily sentiment value for the News, the com-
Hold (0). The learning-based methods were performed pound score (normalized, weighted composite score) of
on different stocks and the results were compared. each News items within the same day is summed up and
The 5 stocks from SP 500 index were selected for divided by the total number of News items generated
performing the experiment. They were namely Alpha- on the same specific day.
bet Inc Class A (“GOOGL”), Amazon.com Inc. (“AMZN”), Phase 3: In phase 3, the two intermediate predic-
Apple Inc. (“AAPL”), Citigroup Inc. (“C”) and “EBAY” tions (Trend Intermediate Predictions and Daily Senti-
Inc. (“EBAY”). ment Values) are combined to determine the final trend
prediction of the next day.
-Step 1: Once the two intermediate prediction values
3.2 Stock Trending Analysis by Incorporating Social
have been obtained, sliding window of 3 days is applied
Media Analysis
to the two intermediate prediction datasets (Trend In-
termediate Prediction and Daily Sentiment Value). The
The proposed Stock Trending Analysis by Incorporat-
two datasets will then be joined together to form a final
ing Social Media Analysis method used to perform stock
dataset with their dates included.
trending will be presented and explained in detail. The
In addition, the Daily Sentiment Value of each slid-
proposed methodology consists of 3 phases, each with
ing window day will be further pre-processed such that
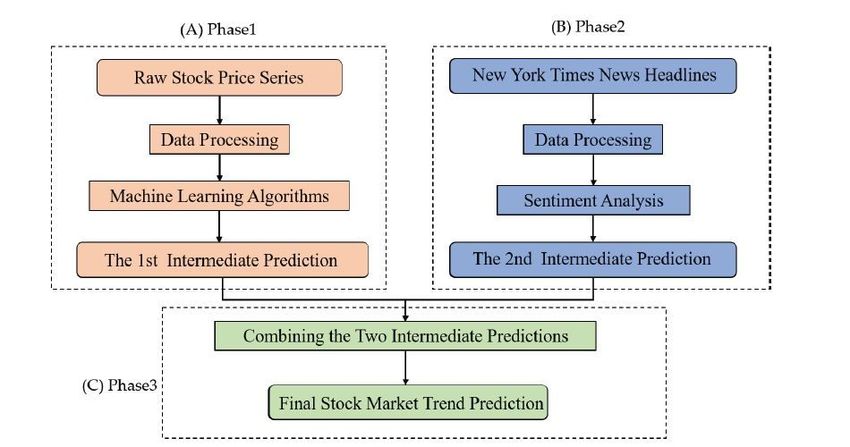
multiple steps. The details of the methodology are il-
the impact of the Daily Sentiment Value will decrease
lustrated in Fig. 1.
as the days go by. The Weighted Daily Sentiment Value
Phase 1: In phase 1, the 1st Intermediate Predic-
of Dayt−x on Dayt can be calculated using the follow-
tion is obtained using Machine Learning Algorithms.
ing equation:
-Step 1: The model first retrieves the data either
w−x
manually or automatically by using a crawler that is W eightedV aluet−x = ∗ V aluet−x (1)
coded using Python. w
where w represents the window size.
-Step 2: The dataset then undergoes pre-processing
-Step 2: After the final datasets have been gener-
to ensure the dataset is ready to be fed into the Machine
ated, it is now ready to be fed into the machine learn-
Learning Algorithms. In addition, Technical Indicator
ing algorithm for prediction. This final trend will then
would be considered, and it can be added as part of
be the final prediction result of the proposed hybrid
the input dimensions. The Technical Indicators can be
machine learning model.
calculated using the Python library ta with the stock’s
Open, High, Low, Close and Volume as inputs to the
ta library. 4 Experiment Results and Discussion
-Step 3: The dataset is fed into the model as inputs
and the Machine Learning Algorithms are used to per- 4.1 Stock Market Data Used
form Intermediate Prediction of the trend of the next
day. Six stocks were identified to be used, namely Dow Jones
Phase 2: In Phase 2, the model generates a 2nd Industrial Average (DJIA), Google (GOOG), Amazon
Intermediate Prediction. This Intermediate Prediction (AMZN), Apple (AAPL), eBay (EBAY) and Citigroup
is the daily sentiment values of the public derived from (C). For the six stocks, two type of datasets are re-
performing Sentiment Analysis on the News’ headline. quired. The first is the historical values of stocks, and
-Step 1: In the first step, it retrieves News items the second is the relevant New York Times News’ head-
that are related to the stocks from online media sources lines.
such as the New York Times. The duplicate rows and For the stocks’ historical values dataset, the six stocks
redundant information within the News are removed. daily data were downloaded from Yahoo! Finance. The6
Fig. 1 Layout of the proposed method. (A) Phase 1, the first intermediate prediction, (B) Phase 2, the second intermediate
prediction, (C) Phase 3, final stock market trending prediction
dataset contains 7 columns, ‘Date’, ‘Open’, ‘High’, ‘Low’, And then the Recursive Feature Elimination method
‘Close’, ‘Volume’, and ‘Adjusted Close’. The interval (RFE) was used for feature selection. The Logistic Re-
taken was from 1st Jan 2014 to 31st Dec 2018 – five gression model was set as the estimator considering the
years in total. time cost. Finally, five most important features includ-
For the New York Times dataset, the New York ing ’volume cmf’, ’volume mfi’, ’volatility kcp’, ’volatil-
Times News dataset was obtained using the New York ity dcw’ and ’volatility ui’ were selected. ‘cmf’ means
Times Archive API. The API also allows the News to Chaikin Money Flow. Different window sizes, n, were
be filtered based on the stock’s name and the dataset used for the trending prediction. For example, when
retrieved was of 5 years, from 1st Jan 2014 to 31st Dec the window size n is 10, it means that we use the value
2018. of the previous 10 days to predict the value of the 11th
day. After experimental exploration, we chose 3 as the
window size. Under data preprocessing, empty or infi-
4.2 Parameter setting nite values were replaced with the value 0. In addition,
independent variable (X) was normalized from the ac-
The experiment is designed as a trending prediction tual value to its percentage change to obtain a smaller
problem. A total of 6 learning-based methods are used range of values to reduce variability, as formulated by
for comparison in this research. It comprises SVM, neu- using the following equation:
ral networks, Naı̈ve Bayes based method, Random For- x − xmin
xnorm = (2)
est, Logistic Regression and XGBoost model. For SVM, xmax − xmin
we select RBF as the kernel function. For neural net- where xnorm is the normalized data, X is the original
works method, we used a 3-layer MLP model and the data, and xmin and xmax are corresponding minimal
hidden layer sizes were all set as 300. For Random For- and maximal of each data dimension.
est and XGboost, 100 sub models and 1000 sub mod- The dependent variable (Y ) would be the trending
els were chosen, respectively. In addition, 80% of the label based on n days of prediction. Finally, the per-
dataset was selected as training set, which was used to formance was evaluated based on accuracy rate and
build the model for the learning-based methods, and the F-score. Accuracy rate measures the total number of
remaining 20% was used for testing, which was used to correct predictions over total number of predictions. F-
verify the performance of the learning-based methods. score measures the precision and recall rate compre-
For Technical Analysis, this paper uses Technical hensively in classification task. Precision measures the
Analysis Library in Python to generate a total of 58 number of correct predictions in the total number of
features through an original stock time series dataset. positive predictions and Recall measures the number of7
positive predictions in the total true positive samples. Base Line with Sentiment Analysis and Technical Anal-
The formula for the balanced F-score, F 1, is as follows: ysis managed to achieve the highest F-score of 80.87%
for the stock ‘C’ in all cases.
precision ∗ recall
F1 = 2 ∗ (3) As for different learning-based methods, SVM and
precision + recall
LR both achieved the best result for four stocks ‘GOOG’,
‘AAPL’, ‘EBAY’ and ‘C’ while SVM achieved the best
4.3 Comparison of Performance for Individual Stock result for the stock ‘AMZN’, which shows that SVM
can be a good choice for the five stocks.
In this section, results obtained using the proposed ap-
proach are briefly discussed and are evaluated against
the Accuracy and F-score evaluation metric for the stock
tickers: GOOG, AMZN, AAPL, C and EBAY. Base
Line with Technical Analysis means adding generated
technical indexes to the original stock time series dataset. 4.4 Discussions
Base Line with Sentiment Analysis means adding New
York Times news polarity to original stock time series From the results obtained, it is discovered that the
dataset. Base Line with Sentiment Analysis and Tech- performance of the proposed methods varies between
nical Analysis means using both of them. The experi- stocks.
ments can be seen in Table 1 and Table 2.
Firstly, by comparing the Base Line approach and
Table 1 shows the Accuracy obtained for analyz- Base Line with Technical Indicator approach, it is ob-
ing the individual stock by using six different learning- served that the accuracy and F-score of prediction both
based methods. It can be observed that Base Line with drop in most case when utilizing Technical Indicators.
Sentiment Analysis and Technical Analysis achieved the However, there are also some cases where the Base Line
best results in 24 out of 30 cases for all stocks while with Technical Indicator approach improves the accu-
only two best results were achieved both by Base Line racy and manages to generate the best accuracy com-
and Base Line with Technical Analysis. Compared with pared to the other 3 approaches. The result implies that
Base Line, Base Line with Technical Analysis achieved utilization of Technical Indicators has the potential in
better results only in 8 out of 30 cases and Base Line increasing the accuracy of prediction. However, such
with Sentiment Analysis achieved better results in 24 Technical Indicators must be carefully selected through
out of 30 cases. And Base Line with Sentiment Analysis an optimized feature selection algorithm to prevent it
and Technical Analysis managed to achieve the highest from causing the opposite effect of reducing the accu-
accuracy of 68.16% for the stock ‘EBAY’ in all cases. racy.
The results show that Base Line approach and Base
Line with Technical Analysis have the worst prediction Secondly, looking at the results obtained using Base
accuracy while the proposed approach Base Line with Line approach and Base Line with Sentiment Analy-
Sentiment Analysis and Technical Analysis outperforms sis approach, it can be observed that the utilization of
the other approaches in most cases. daily sentiment values from New York Time News as
As for different learning-based methods, SVM achieved an external factor (Phase 2 of the proposed model) to
the best result for the stock ‘GOOG’ while four mod- the predicted trend is largely capable of increasing the
els all achieved the best result for the stock ‘AMZN’. accuracy of stock prediction. However, there are cases
Random Forest achieved the best result for ‘AAPL’ where slight drops of accuracy when utilizing Sentiment
while SVM and LR both achieved the best result for Analysis are experienced. This can be caused by reasons
the stocks ‘EBAY’ and ‘C’. such as failing to capture negation in News, and insuf-
Table 2 shows the F-score obtained for analyzing the ficient number News items considered in the Sentiment
individual stocks by using six different learning-based Analysis Phase.
methods. It can be observed that Base Line with Sen- Lastly, from the observation of the 6 stocks, the
timent Analysis and Technical Analysis achieved the proposed approach of Base Line with Sentiment Anal-
best results in 15 out of 30 cases for all stocks while ysis and Technical Analysis outperforms the 3 other
other three methods achieved the best results in no approaches in most cases. Thus, this implies that the
more than 10 cases. Compared with Base Line, Base utilization of Technical Indicators together with Daily
Line with Technical Analysis achieved better results in Sentiment Values of New York Times News might have
14 out of 30 cases and Base Line with Sentiment Anal- the effect of further increasing the accuracy of stock
ysis achieved better results in 20 out of 30 cases. And prediction.8
Table 1 Accuracy of Different Learning-Based Methods for Individual Stock
Base Line with
Learning-Based Base Line with Base Line with
Stock Base Line Sentiment Analysis
Methods Technical Analysis Sentiment Analysis
and Technical Analysis(proposed)
MLP 56.97 56.18 57.83 59.44
SVM 61.75 61.75 61.85 61.85
Naı̈ve Bayes 58.17 44.22 57.83 57.83
GOOG
Random Forest 52.59 56.97 56.22 58.23
Logistic Regression 61.75 58.57 61.85 61.85
XGBoost 51.79 56.57 57.03 57.03
MLP 55.20 49.20 58.23 51.81
SVM 56.80 56.80 58.23 59.84
Naı̈ve Bayes 56.00 47.60 58.23 59.84
AMZN
Random Forest 56.80 57.20 58.23 59.04
Logistic Regression 57.20 56.80 58.23 59.84
XGBoost 50.00 55.20 58.23 57.43
MLP 58.63 49.00 60.73 61.94
SVM 63.05 63.05 61.54 63.56
Naı̈ve Bayes 58.23 54.62 61.13 63.56
AAPL
Random Forest 61.85 58.63 59.51 63.97
Logistic Regression 63.05 62.65 63.16 63.56
XGBoost 56.63 61.85 59.11 60.32
MLP 65.85 61.79 60.82 63.67
SVM 67.48 67.48 67.35 68.16
Naı̈ve Bayes 61.79 61.79 66.53 66.53
EBEY
Random Forest 58.13 63.01 61.63 64.49
Logistic Regression 67.48 65.85 67.35 68.16
XGBoost 58.13 60.57 63.27 66.12
MLP 63.31 55.24 66.26 67.07
SVM 67.74 67.74 67.89 67.89
Naı̈ve Bayes 64.92 57.66 65.45 65.45
C
Random Forest 56.45 63.71 59.76 59.76
Logistic Regression 67.74 66.53 67.89 67.89
XGBoost 55.24 55.65 60.16 60.16
5 Conclusion, Limitations and Future Works 72.98% and the highest F-score of 84.11% for DJIA. In
addition, the effect of utilizing Sentiment Analysis and
In conclusion, different from EMH and RWT, where Technical Indicator was also discussed in detail. Also,
both theories emphasize the non-viability of stock mar- utilizing Technical Indicator together with Sentiment
ket prediction, the research in this paper has demon- Analysis can be seen to further increase the prediction
strated that it is possible to predict the trending of accuracy.
stock market by using the right methods. Due to the limited amount of News retrieved, the
effect of utilizing Sentiment Analysis may be limited
The proposed method is a 3-phase hybrid predic-
and thus not fully reflected in the results. This is also
tion model where Daily Sentiment Values and Technical
the limitation of this research work.
Indicators are considered when predicting the stocks,
GOOG, AMZN AAPL, EBAY and C. The 3 phases in It was observed that no learning-based method is ca-
the approach are Phase 1: Intermediate Prediction us- pable of consistently achieving the best accuracy across
ing Machine Learning Algorithm to generate the first the 6 different approaches. This suggests that the ap-
Intermediate Trend Prediction, Phase 2: Sentiment Anal- plicability of each learning-based method differs among
ysis where Daily Sentiment Values of New York Times stocks. In the future, combining different deep learning-
News are calculated, and Phase 3: Final Prediction where based methods, such as LSTM, CNN, and transfer learn-
the final trend is predicted by considering Sentiment ing methods will be attempted, and the detailed method
Analysis as an external factor to the first Intermediate and discovery will be reported.
Trend Prediction.
Acknowledgements The author would like to thank the
The performance of the model is evaluated against
FYP students, Jun Hao NG, and Adrian TAN from NTU, and
Accuracy and results have shown that the proposed Senior Engineer, Chee Seng CHONG from IHPC, A*STAR
approach managed to achieve the highest accuracy of for their contributions, support and assistance.9
Table 2 F-score of Different Learning-Based Methods for Individual Stock
Base Line with
Learning-Based Base Line with Base Line with
Stock Base Line Sentiment Analysis
Methods Technical Analysis Sentiment Analysis
and Technical Analysis(proposed)
MLP 46.58 51.18 50.95 55.17
SVM 76.35 76.35 76.43 76.43
Naı̈ve Bayes 45.42 39.04 53.69 53.69
GOOG
Random Forest 48.64 56.88 51.3 53.69
Logistic Regression 76.35 59.14 76.43 76.43
XGBoost 50.7 57.08 55.39 55.39
MLP 47.77 48.96 55.21 51.61
SVM 72.45 72.45 55.21 55.25
Naı̈ve Bayes 45.58 46.05 55.21 55.25
AMZN
Random Forest 53.29 55.41 55.21 55.15
Logistic Regression 42.05 46.06 55.21 55.25
XGBoost 48.44 54.95 55.21 55.35
MLP 52.9 49.78 56.28 60.62
SVM 77.34 77.34 48.5 61.23
Naı̈ve Bayes 54.24 55.39 57.17 61.23
AAPL
Random Forest 58.82 58.15 55.67 62.31
Logistic Regression 77.34 49.95 50.01 61.23
XGBoost 55.45 62.17 58.38 59.68
MLP 56.14 61.38 54.91 60.87
SVM 80.58 80.58 80.49 61.49
Naı̈ve Bayes 56.78 62.63 55.84 61.83
EBEY
Random Forest 56.21 60.64 58.25 62.23
Logistic Regression 80.58 56.14 80.49 62.29
XGBoost 57.6 60.5 59.44 63.74
MLP 57.54 55.58 54.8 55.22
SVM 80.77 80.77 80.87 80.87
Naı̈ve Bayes 57.76 57.73 55.01 55.01
C
Random Forest 52.24 58.57 55.61 55.94
Logistic Regression 80.77 57.26 80.87 80.87
XGBoost 53.42 54.19 54.79 54.79
Declarations References
Anitescu C, Atroshchenko E, Alajlan N, Rabczuk T
Conflict of interest The authors declare that they (2019) Artificial neural network methods for the solu-
have no conflict of interest. tion of second order boundary value problems. Com-
Human and animal rights This article does not con- puters, Materials and Continua 59(1):345–359
tain any studies with human or animal subjects per- Bharathi S, Geetha A (2017) Sentiment analysis for ef-
formed by any of the authors. fective stock market prediction. International Journal
Informed consent Informed consent was obtained from of Intelligent Engineering and Systems 10(3):146–154
all individual participants included in the study. Bollen J, Mao H, Zeng X (2011) Twitter mood predicts
the stock market. Journal of computational science
2(1):1–8
Authors’ contributions Chen T, Guestrin C (2016) Xgboost: A scalable tree
Zhaoxia WANG: Conceptualization, Methodology, Su- boosting system. In: Proceedings of the 22nd acm
pervision, Data curation, Software design, Visualiza- sigkdd international conference on knowledge discov-
tion, Writing - original draft, Writing - review & edit- ery and data mining, pp 785–794
ing; Zhenda HU: Investigation, Formal analysis, Soft- Fischer T, Krauss C (2018) Deep learning with long
ware testing, Visualization, Validation, Writing - re- short-term memory networks for financial market
view & editing; Fang LI: Investigation, Data cura- predictions. European Journal of Operational Re-
tion, Software development, Writing - original draft; search 270(2):654–669
Seng-Beng HO: Conceptualization, Methodology, Su- Göçken M, Özçalıcı M, Boru A, Dosdoğru AT (2016)
pervision, Data curation, Writing - original draft, Writ- Integrating metaheuristics and artificial neural net-
ing - review & editing.10 works for improved stock price prediction. Expert tional Conference on Intelligent Sustainable Systems Systems with Applications 44:320–331 (ICISS), IEEE, pp 654–661 Gupta R, Chen M (2020) Sentiment analysis for stock Marković I, Stojanović M, Stanković J, Stanković M price prediction. In: 2020 IEEE Conference on Multi- (2017) Stock market trend prediction using ahp and media Information Processing and Retrieval (MIPR), weighted kernel ls-svm. Soft Computing 21(18):5387– IEEE, pp 213–218 5398 Hafezi R, Shahrabi J, Hadavandi E (2015) A bat-neural Naeini MP, Taremian H, Hashemi HB (2010) Stock network multi-agent system (bnnmas) for stock price market value prediction using neural networks. In: prediction: Case study of dax stock price. Applied 2010 international conference on computer informa- Soft Computing 29:196–210 tion systems and industrial management applications Henrique BM, Sobreiro VA, Kimura H (2018) Stock (CISIM), IEEE, pp 132–136 price prediction using support vector regression on Nelson DM, Pereira AC, de Oliveira RA (2017) Stock daily and up to the minute prices. The Journal of market’s price movement prediction with lstm neural finance and data science 4(3):183–201 networks. In: 2017 International joint conference on Hu H, Tang L, Zhang S, Wang H (2018) Predicting neural networks (IJCNN), IEEE, pp 1419–1426 the direction of stock markets using optimized neu- Nguyen TH, Shirai K, Velcin J (2015) Sentiment anal- ral networks with google trends. Neurocomputing ysis on social media for stock movement prediction. 285:188–195 Expert Systems with Applications 42(24):9603–9611 Huang TT, Chang CH (2008) Intelligent stock select- Patel J, Shah S, Thakkar P, Kotecha K (2015) Pre- ing via bayesian naive classifiers on the hybrid use of dicting stock and stock price index movement us- scientific and humane attributes. In: 2008 Eighth In- ing trend deterministic data preparation and ma- ternational Conference on Intelligent Systems Design chine learning techniques. Expert systems with ap- and Applications, IEEE, vol 1, pp 617–621 plications 42(1):259–268 Huang W, Nakamori Y, Wang SY (2005) Forecast- Rather AM, Agarwal A, Sastry V (2015) Recurrent ing stock market movement direction with support neural network and a hybrid model for prediction vector machine. Computers & operations research of stock returns. Expert Systems with Applications 32(10):2513–2522 42(6):3234–3241 Ichinose K, Shimada K (2018) Stock market predic- Sezer OB, Ozbayoglu AM (2020) Financial trading tion using keywords from expert articles. In: Interna- model with stock bar chart image time series with tional Conference on Soft Computing and Data Min- deep convolutional neural networks. Intelligent Au- ing, Springer, pp 409–417 tomation Soft Computing 26(2):323–334 Khaidem L, Saha S, Dey SR (2016) Predicting the di- Si J, Mukherjee A, Liu B, Pan SJ, Li Q, Li H (2014) rection of stock market prices using random forest. Exploiting social relations and sentiment for stock arXiv preprint arXiv:160500003 prediction. In: Proceedings of the 2014 Conference on Khan W, Malik U, Ghazanfar MA, Azam MA, Alyoubi Empirical Methods in Natural Language Processing KH, Alfakeeh AS (2019) Predicting stock market (EMNLP), pp 1139–1145 trends using machine learning algorithms via public Stoean C, Paja W, Stoean R, Sandita A (2019) Deep ar- sentiment and political situation analysis. Soft Com- chitectures for long-term stock price prediction with a puting pp 1–25 heuristic-based strategy for trading simulations. PloS Kim Kj (2003) Financial time series forecasting us- one 14(10):e0223593 ing support vector machines. Neurocomputing 55(1- Varfis A, Versino C (1990) Univariate economic time 2):307–319 series forecasting by connectionist methods. In: Kim T, Kim HY (2019) Forecasting stock prices with a 1990 International Conference on Neural Networks feature fusion lstm-cnn model using different repre- (ICNN), IEEE, pp 342–345 sentations of the same data. PloS one 14(2):e0212320 Wang Z, Chong CS, Lan L, Yang Y, Ho SB, Tong JC Lee SW, Um JY (2019) Stock fluctuation prediction (2016) Fine-grained sentiment analysis of social me- method and server. US Patent 10,185,996 dia with emotion sensing. In: 2016 Future Technolo- Li B, Chan KC, Ou C, Ruifeng S (2017) Discovering gies Conference (FTC), IEEE, pp 1361–1364 public sentiment in social media for predicting stock Wang Z, Ho SB, Lin Z (2018) Stock market prediction movement of publicly listed companies. Information analysis by incorporating social and news opinion Systems 69:81–92 and sentiment. In: 2018 IEEE International Confer- Maini SS, Govinda K (2017) Stock market predic- ence on Data Mining Workshops (ICDMW), IEEE, tion using data mining techniques. In: 2017 Interna- pp 1375–1380
11

Wang Z, Ho SB, Cambria E (2020a) A review of emo-        Zhang X, Zhang Y, Wang S, Yao Y, Fang B, Philip SY
  tion sensing: Categorization models and algorithms.      (2018) Improving stock market prediction via hetero-
  Multimedia Tools and Applications pp 1–30                geneous information fusion. Knowledge-Based Sys-
Wang Z, Jiao R, Jiang H (2020b) Emotion recognition        tems 143:236–247
  using wt-svm in human-computer interaction. Jour-      Zhu K, Zhang N, Ying S, Wang X (2020) Within-
  nal of New Media 2(3):121                                project and cross-project software defect prediction
Xiong L, Lu Y (2017) Hybrid arima-bpnn model for           based on improved transfer naive bayes algorithm.
  time series prediction of the chinese stock market.      Computers, Materials and Continua 63(2):891–910
  In: 2017 3rd International Conference on Information
  Management (ICIM), IEEE, pp 93–97
Figures

Figure 1

Layout of the proposed method. (A) Phase 1, the rst intermediate prediction, (B) Phase 2, the second
intermediate prediction, (C) Phase 3, nal stock market trending prediction
You can also read