CAT 2008 Post-Tournament Evaluation: The Mertacor's Perspective
←
→
Page content transcription
If your browser does not render page correctly, please read the page content below
CAT 2008 Post-Tournament Evaluation: The Mertacor’s Perspective

                                  Lampros C. Stavrogiannis and Pericles A. Mitkas
      Aristotle University of Thessaloniki, Faculty of Engineering, Department of Electrical and Computer Engineering
                                               GR541 24 Thessaloniki, Greece
                                                mertacor@olympus.ee.auth.gr

                           Abstract                                 first (Smith 1962) and software agents afterwards (Gode and
                                                                    Sunder 1993; Rust, Miller, and Palmer 1993) trade to verify
  TAC Market Design (or CAT ) tournament is an effort to study
                                                                    the effectiveness of the mechanism. The use of multi-agent
  the competition among modern stock exchanges trying to at-
  tract potential traders while maximizing their profit. This
                                                                    systems in this kind of experiments introduced a new scien-
  paper shortly presents Mertacor, our entrant for 2008, and        tific field, known as Agent-based Computational Economics
  makes an attempt to evaluate its performance. We compare          (Tesfatsion 2002).
  Mertacor with the other available entries for the setting of          Each DA consists of two distinct aspects: its structure and
  CAT 2008 as well as beyond the tournament. What’s more,           its behavior (Vytelingum 2006). The latter is mainly occu-
  we introduce a simple yet effective way of computing the          pied with the bidding strategies of the traders and has dom-
  global competitive equilibrium that Mertacor utilizes and dis-    inated related research. However, scientists have recently
  cuss about its importance for the game.                           turned their attention to the structure of the DA, that is, to
                                                                    the rules and the protocols that govern every such auction.
                                                                    The majority of the relevant literature until now deals with
                       Introduction                                 isolated markets which operate free of charge. Nevertheless,
The invasion of the Internet in our daily life has given rise to    in today’s global economy, each country’s market institu-
new, innovative applications of electronic commerce. Com-           tions compete with each other as well as with the remainder
mon examples include electronic marketplaces and online             stock exchanges worldwide. Having recognized this, sci-
trading systems that most of the major stock exchanges use          entists from the universities of Liverpool and Southampton,
to trade futures, options, equities as well as their derivatives.   and Brooklyn College introduced TAC Market Design (or
   The double auction (DA) is an auction where multiple             CAT ) tournament in 2007, in a joint effort to study the impact
buyers and sellers are able to make committed offers to             of dynamically changing mechanisms on trading.
buy and sell goods and then accept similar offers. Be-                  This paper is organized as follows: Section 2 provides a
sides its prevalence in financial and commodities markets,          short description of the CAT tournament. The notion of the
many variants of the DA have been successfully applied              global competitive equilibrium and how Mertacor manages
as a solution to a multitude of resource allocation prob-           to accurately estimate it are given in Section 3. Section 4
lems (Dash et al. 2007; Gomoluch and Schroeder 2003;                shortly discusses the strategies implemented by Mertacor for
Nisan et al. 1998), where different stakeholders compete            the games of 2008. Section 5 presents the results of our ex-
against each other to obtain units of a scarce resource. The        periments, comparing Mertacor with its opponents. A brief
importance of DAs lies in the fact that they manage to ex-          summary concludes the paper in Section 6.
hibit a high allocative efficiency (ratio of traders’ actual
profit to their theoretical maximum profit) with the imple-                         CAT Tournament 2008
mentation of very simple rules.
   Mathematicians, economists and computer scientists have          The CAT game consists of two principal entities: trading
long used game theory to analyze simple forms of this mech-         agents (or traders) and specialists. Each trader may be either
anism (Chatterjee and Samuelson 1983; Kagel and Vogt                a buyer or a seller willing to exchange goods, whereas each
1993; Satterthwaite and Williams 1993) but their findings           specialist represents a DA market where these traders will
have been criticized for being of scant relevance to prac-          trade. Trading agents are provided by the organizers and
tical scenarios due to their strict assumptions, like the in-       specialists are designed by the competition entrants. The
dependence of private values and traders’ full rationality.         platform of the tournament is JCAT, a client-server imple-
Moreover, the dynamics of the CDA presents an important             mentation of the Java Auction Simulator API (JASA), pro-
obstacle in any pure theoretical approach. This led to the          viding additional support for the operation of multiple mar-
adoption of simulation techniques where human subjects at           kets (Niu et al. 2008b).
                                                                       Traders are equipped with a trading strategy and a market
Copyright c 2009, Association for the Advancement of Artificial     selection strategy. The first determines their bidding behav-
Intelligence (www.aaai.org). All rights reserved.                   ior, the decision making process of selecting their offers (or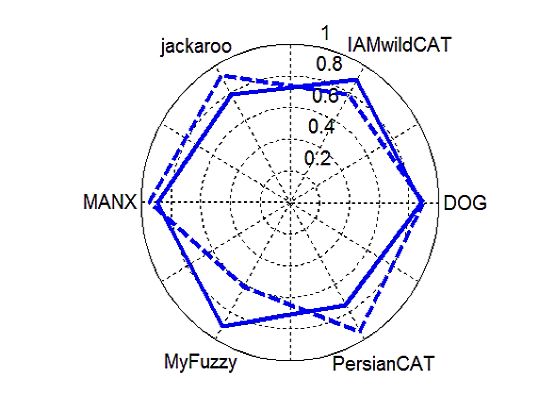
shouts) in the market, and follows one of the four extensively identify this equilibrium and coordinate its transaction prices
studied strategies in the DA literature, namely ZI-C (Gode with it.
and Sunder 1993), ZIP (Cliff and Bruten 1997), RE (Roth To estimate this point Mertacor continually keeps track
and Erev 1995) and GD (Gjerstad and Dickhaut 1998). The of the highest bids (buy offers) and lowest asks (sell offers)
market selection strategy specifies the specialist to register submitted in its market. These prices constitute the clos-
for their trades and is typically based on their profit from est available estimation of traders’ private values. More-
the market. Implemented market selection strategies in JCAT over, the number of goods traded every day in the past con-
treat the selection as an n-armed bandit problem (Sutton and sists a very accurate estimation of their daily endowment.
Barto 1998). Every trader is endowed with a set of goods When a sufficient number of trading agents have been ex-
to trade and a private value (the maximum amount willing plored, Mertacor forms the global cumulative demand and
to purchase or the minimum accepted sale’s price for buyers supply curves and computes the desired competitive equi-
and sellers respectively) for each of them. Both strategies librium pair of price and quantity. This threshold was set at
and private values constitute personal information which is 80% of the total traders’ population for the games of 2008.
not revealed to the competitors during the game. In addition, Mertacor exploits the possibility of subscription
Each entrant owns a single exchange market and must ef- provided by CAT, gaining access to the shouts placed in the
fectively set its rules so as to meet his design objectives. opponent markets, thus accelerating the process.
Common questions to answer are: Which offers to accept in Table 1 illustrates the expected and estimated values of
the market? How to match accepted offers? What should the the global competitive equilibrium price for the three final
price of each transaction be? How much to charge for every games of CAT 2008 (real prices are not available but organiz-
service provided? ers provided us with the distributions of private values after
Each game of CAT comprises several virtual trading days, the end of the tournament). As can be seen, the mean abso-
each of which is further divided in trading rounds of fixed lute percentage error for our estimation is less than 2% in all
duration. At the beginning of the day, specialists announce cases, validating the effectiveness of our method. It is inter-
their fees and traders must decide upon which market to se- esting to mention that our specialist managed to successfully
lect for the rest of this day. Traders’ shouts are single-unit estimate this competitive equilibrium since the fifth, eighth
and persistent, meaning that every offer expresses the de- and sixth trading day for the three final games respectively.
sire to trade one unit of the commodity and, once accepted,
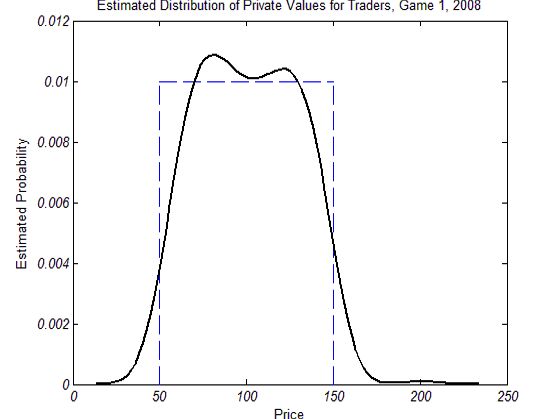
remains active until a transaction is executed or the end of Figures 1(a) and 1(b) show the estimated probability den-
the day is reached. Traders’ private values are drawn from sity functions (pdf) of the prices of the lowest accepted asks
an unknown distribution at the start of the game and remain and the highest accepted bids respectively that were obtained
constant for the rest of it. by Mertacor’s log files for the first final game of TAC Market
The daily evaluation of the entrants consists of three Design 2008. The form of the pdf is similar for the remain-
parts: the market-share, which is the percentage of the total ing games. The estimation of the pdf is based on the Parzen
traders’ population registered in the market, the profit-share, window method, also called kernel density estimation (Bow-
which is the ratio of the daily profit a specialist obtains to the man and Azzalini 1997). A closer look at these figures re-
profit of all specialists, and, finally, the transaction success veals a relative symmetry of the distributions around the ex-
rate (TSR), which is the percentage of the shouts accepted pected global competitive equilibrium price (equal to 100).
that result in transactions. The daily score of each specialist This is further clarified in Figure 1(c), illustrating the dis-
is the mean value of the above metrics. Assessment com- tribution of the prices of all the shouts recorded. As can be
mences and terminates in randomly selected days and total observed, the resulting price distribution is very close to the
score is the sum of the scores across these days (Gerding et real uniform distribution of the private values, U (50, 150).
al. 2007). We believe that the form of this distribution is caused by
the traders’ strategy mix selected, which was identical for
buyer and seller populations, and the fact that private values
The Global Competitive Equilibrium were drawn from the same distribution for buyers and sell-
The global competitive equilibrium is the competitive equi- ers, leading to an almost equal mean profit margin for both
librium of the equivalent single global market where all the trading sides.
buyers and sellers would trade had it not been their splitting
due to the existence of multiple specialists. In an efficient
global allocation only globally intra-marginal traders (buy-
ers and sellers with private values above and below the price Table 1: Expected and estimated global competitive equilib-
of the global competitive equilibrium respectively) transact. rium price for the final games of CAT 2008.
However, the diffusion of the traders in the various spe-
cialist markets provides the opportunity for the globally Game Private Exp. Est. Abs.
extra-marginal traders to conduct transactions either for the Values Gl. CE Gl. CE Percentage
reason that they might be intra-marginal ones for the market Distribution Price Price Error
registered with or because of the inability of the specific spe- 1 U (50, 150) 100 100.199 0.199%
cialist’s rules to prevent extra-marginal trades, thus leading 2 U (100, 200) 150 152.411 1.607%
to a drop in both global and market’s (for the latter case) al- 3 U (70, 170) 120 118.931 0.891%
locative efficiency. It is therefore to the entrant’s interest to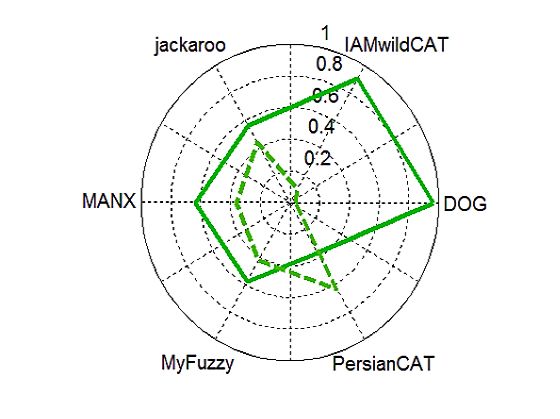
(a) Asks                                    (b) Bids                                   (c) Shouts

      Figure 1: Kernel density estimation of the shout prices recorded by Mertacor for the first final game of CAT 2008.

                    Agent Mertacor
In this section we shortly describe the strategies followed by
our entrant, which was placed 5th in the finals of 2008. Mer-
tacor’s policies are primarily based on the theory of microe-
conomics, combined with heuristic techniques that improve
the agent’s performance for the specific setting of the tour-
nament. Our agent’s main design objective is the acquisition
of a satisfactory level of profit-share score, compromising
its target for the market-share. Figure 2 illustrates Merta-
cor’s architecture. As shown, there are five different policies
along with the auctioneer and the market client parts.
   The latter is the communication component of the agent,
converting incoming messages to a comprehensible form for
the specialist and, conversely, transforming Mertacor’s deci-
sions according to CATP, the message protocol of JCAT, and
then transmitting the resulting information to the CAT server.
   The auctioneer acts as a coordinator among the rest of the                     Figure 2: Mertacor’s architecture.
components, assembling and transferring all the information
required by each of them. In addition, it undertakes the re-
sponsibility to compute the global competitive equilibrium.          the global competitive equilibrium price. This policy offers
The successful estimation of this point initiates the steady-        each individual the same profit that would be obtained in a
state behavior of the agent discussed here. Before that, Mer-        global efficient allocation. For the last rounds of each day a
tacor acts like a modified CDA market that has proved to be          modified version of the side-based pricing policy, originally
effective in a variety of settings.                                  introduced by IAMwildCAT (Vytelingum et al. 2008), is
   The quote-accepting policy determines the shouts that             utilized, providing a higher amount of profit to the desired
will be accepted for potential transactions in the market.           globally intra-marginal traders.
Its filtering behavior is crucial, as this component is mainly          The time of the transactions is determined by the clearing
responsible for the TSR score of the specialist. Mertacor            policy. Mertacor uses a round clearing policy for the first
implements a global equilibrium beating accepting policy,            rounds and then switches to a continuous clearing rule to
allowing only globally intra-marginal trades to take place           increase the volume of its transactions.
during the first rounds of the trading day, and subsequently            Finally, the charging policy selects the type and the
switches to a policy that implements the NYSE rule, accord-          amount of the fees that registered traders should pay to ob-
ing to which received shouts must beat the quote (current            tain market services. There are four different kinds of fees
best offer placed in the market).                                    in the CAT game: (a) the registration fee, charged for the
   After the acceptance of the qualified shouts, a specialist        registration of the traders in the market, (b) the information
must select the pairs of bids and asks that will lead to trans-      fee, for their access in an opponent market’s accepted shouts
actions. This is the task of the matching policy, which imple-       and transactions executed, (c) the shout fee, for every shout
ments the 4-heap algorithm (Wurman, Walsh, and Wellman               placed, (d) the transaction fee, for every transaction carried
1998) in the case of Mertacor.                                       out, and (e) the profit fee, which is a percentage of the profit
   The price of each transaction is specified by the pricing         obtained by each trader from a transaction. Our specialist
policy. Our contestant uses a uniform global equilibrium             charges a small profit fee, since we decided that only prof-
pricing policy which sets the price of all the transactions at       itable traders ought to pay for their trades. Mertacor uses a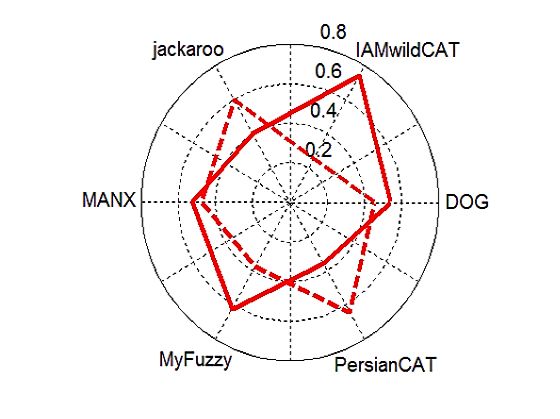
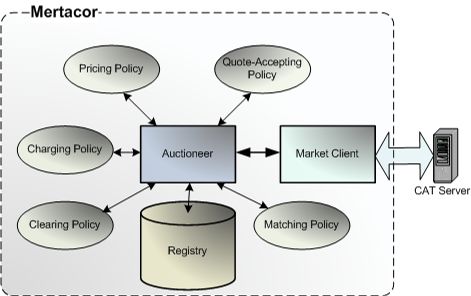
(a) Market-share                             (b) Profit-share                                (c) TSR

Figure 3: Tournament’s evaluation metrics for the one-to-one experiments. The polar coordinates of each vertex of the dashed-
line polygon represent opponent’s score whereas the coordinates of the vertices of the solid-line polygon represent Mertacor’s
respective score.

                                                                      Heterogeneous Markets
Table 2: Results of one-to-one experiments for the games
of CAT 2008. Each opponent is compared against Mertacor.              We ran a total of 18 experiments for the case of the het-
The second value in each column refers to the respective              erogeneous markets. At first, we carried out one-to-one
mean score of Mertacor. Each experiment was repeated 9                experiments where one market of each opponent competes
times.                                                                with one Mertacor specialist. The remainder of the exper-
                                                                      iments concern one-to-many comparisons where five spe-
 Opponent            Score         Efficiency     Conv. Coef.         cialists of each entrant compete with one Mertacor and, con-
 DOG              0.465 - 0.797   0.906 - 0.929   6.461 - 6.427       versely, five Mertacor markets operate against one opponent.
 IAMwildCAT       0.382 - 0.848   0.885 - 0.936   9.156 - 5.029       Traders’ strategy mix was identical to that of the games of
 jackaroo         0.655 - 0.584   0.937 - 0.877   6.047 - 7.475       2008. More specifically, GD, ZIP, RE and ZI-C strategies
 MANX             0.594 - 0.684   0.913 - 0.935   7.414 - 6.943       were followed by 20%, 30%, 30% and 20% of the trad-
 MyFuzzy          0.473 - 0.701   0.890 - 0.943   7.741 - 5.904       ing agents for the first game, 20%, 25%, 30% and 25% for
 PersianCAT       0.738 - 0.493   0.952 - 0.853   4.396 - 7.905       the second game, and 15%, 30%, 35% and 20% of the total
                                                                      trader population for the third game respectively. All traders
                                                                      followed an -greedy market selection strategy ( = 0.1, α
                                                                      = 1). Each experiment was repeated 9 times (3 iterations
limited score-based charging policy, keeping the fee in the           for each game). The duration of the games was 500 trading
interval [0.1, 0.3], and setting its amount based on its market       days and each day comprised 10 rounds. The performance
statistics and opponent scores. According to this policy, our         criteria include the tournament’s evaluation metrics as well
entrant makes an attempt to beat better opponents in time             as specialist’s allocative efficiency and coefficient of conver-
intervals proportional to their score differences, also taking        gence. The latter is proportional to the standard deviation of
into account its rivals with lower cumulative score but higher        transaction prices around the market’s competitive equilib-
daily score that might threaten its position in the game.             rium price and constitutes a measure of their volatility.
                                                                      One-to-One Experiments. The score of each competitor
                Mertacor’s Evaluation                                 depends not only on its policies but also on the trader pop-
                                                                      ulation and its opponents in a game. This kind of experi-
We conducted a number of experiments to evaluate our spe-             ments isolates the influence of the specialists’ mix on a mar-
cialist’s performance against its opponents. Our results are          ket’s performance, making a direct comparison between two
not statistically significant, considering the length of each         competitors. Table 2 illustrates the mean values of score,
game (four hours approximately), which presents an impor-             allocative efficiency and coefficient of convergence for our
tant limitation, as already mentioned in the analysis of (Niu         comparisons with Mertacor.
et al. 2008a). We adopt a similar methodology to (Niu et                 These findings generally agree with the results of the tour-
al. 2007), originally introduced by (Tesauro and Das 2001)            nament, except for the case of MANX, which was placed
for trading strategies, comparing our specialist in homoge-           second in the finals, although this may be due to the minor
neous and heterogeneous market settings. We have used our             modification of Mertacor’s charging policy for our experi-
post-tournament version of Mertacor, found as version 2 in            mental setting. We found out that traders’ strategy mix does
the TAC agent repository. All specialists were obtained from          not affect the quality of our results, as Mertacor is beaten
the same repository, although we did not manage to include            by PersianCAT and jackaroo and continually wins over the
BazarganZebel, CrocodileAgent and PSUCAT because of                   other specialists. Figures 3(a)-3(c) show the market-share,
their unstable operation.                                             profit-share and TSR in a polar system where the score of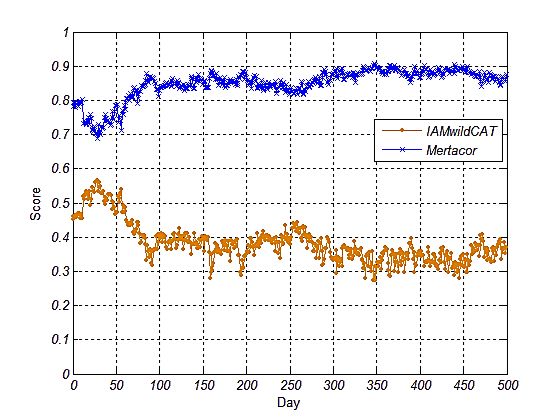
(a) Mertacor vs. DOG                      (b) Mertacor vs. IAMwildCAT                  (c) Mertacor vs. jackaroo

          (d) Mertacor vs. MANX                         (e) Mertacor vs. MyFuzzy                  (f) Mertacor vs. PersianCAT

                                      Figure 4: Daily score results of one-to-one experiments.

each opponent is represented by the coordinates of its vertex          One-to-Many Experiments. In this experimental setting
in a dashed-line polygon and the respective score of Merta-            one specialist of each contestant is compared with many
cor against each opponent is represented by the coordinates            specialists of the same opponent. This kind of experiments
of the vertices of a similar solid-line polygon. The profit-           demonstrates how a specialist might exploit the competition
share score shows that Mertacor succeeds in its objective for          of the opponents in majority, revealing the benefits of its de-
the profit, although PersianCAT obtains a higher profit-share          viation from a homogeneous market markup.
because of its greater market-share and similar charging pol-             Table 3 shows the results of the one-opponent-to-many-
icy. As can be seen, TSR constitutes the weakest metric for            Mertacors experiments, evaluating opponents’ performance
Mertacor, being lower than the respective score for the ma-            against Mertacor. The mean values for the Mertacor refer to
jority of its rivals. Finally, there is an apparent impact of the      the best performing market of our specialist in terms of its
opponent’s selection on both allocative efficiency and coef-           total score. We have also included the mean ranking for the
ficient of convergence, whose values are worse when Merta-             single specialist, providing more details on their ability to
cor faces a stronger entrant and better for a weaker one.              manipulate their Mertacor opponents. It becomes obvious
   It is also useful to see how specialists’ total scores change       from these results that PersianCAT and jackaroo dominate
on a daily basis, providing insights into the way that the du-         Mertacor in this kind of games, since they beat its markets in
ration of the game affects our findings. In addition, these            all of the experiments conducted. Mertacor was the winner
graphs may help us segregate the start effect of the game,             for all of the remaining games except for the experiments
revealing specialists’ steady state behavior. The results are          with MANX. The results for the latter are ambiguous, given
illustrated in Figures 4(a)-4(f). Score differences are con-           that it managed to win in one of the games and had a mean
stant from the beginning of the game for the majority of the           ranking of three. Finally, we observe a better performance of
results but there seems to be a small convergence for Merta-           DOG than IAMwildCAT, even though the latter was placed
cor and jackaroo and an obvious one for the case of MANX.              above the former in the finals of 2008, thus uncovering a
Figure 4(d) clearly illustrates the difference in the scores of        relative strength when it confronts our specialist.
Mertacor and MANX for the first days, mainly due to their                 The results of the experiments with one Mertacor versus
different charging policies implemented. Mertacor exploits             many opponent markets are illustrated on Table 4. The val-
the fact that most of its opponents operate free of charge dur-        ues for the opponents in majority also refer to their score-
ing the initial days, setting its fees from the start of the game.     maximizing specialist, whereas the mean ranking corre-
This has also helped PersianCAT to obtain a higher score               sponds to the Mertacor competitor. The results are similar
difference since the second game of 2008, when it switched             to the above except for the case of MANX and jackaroo.
to an akin charging policy.                                            Mertacor takes advantage of the competition among MANX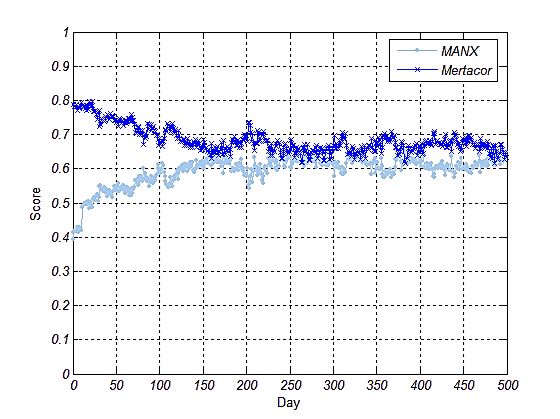
Table 3: Results of one-to-many experiments for the games of CAT 2008. One opponent is compared with many Mertacor
specialists. The second value in each column refers to the best-performing Mertacor market. The mean ranking corresponds to
the single opponent specialist. Each experiment was repeated 9 times.

     Opponent        Op. Rank         Score         Market-share    Profit-share         TSR           Efficiency       Conv. Coef.
     DOG                 6         0.351 - 0.424    0.153 - 0.182   0.011 - 0.203    0.888 - 0.886    0.889 - 0.928     6.665 - 6.724
     IAMwildCAT          6         0.316 - 0.429    0.095 - 0.193   0.017 - 0.205    0.835 - 0.887    0.908 - 0.929     9.899 - 6.598
     jackaroo            1         0.438 - 0.404    0.245 - 0.158   0.126 - 0.197    0.943 - 0.857    0.941 - 0.916     6.170 - 7.607
     MANX                3         0.408 - 0.419    0.184 - 0.182   0.102 - 0.189    0.939 - 0.886    0.926 - 0.934     7.233 - 7.234
     MyFuzzy             6         0.279 - 0.419    0.131 - 0.190   0.118 - 0.177    0.588 - 0.890    0.884 - 0.933     7.956 - 7.065
     PersianCAT          1         0.482 - 0.388    0.274 - 0.152   0.232 - 0.175    0.938 - 0.837    0.952 - 0.903     4.630 - 7.410

Table 4: Results of one-to-many experiments for the games of CAT 2008. Many specialists of each opponent are compared with
one Mertacor. The second value in each column refers to the best-performing opponent market. The mean ranking corresponds
to the single Mertacor specialist. Each experiment was repeated 9 times.

    Opponent        Mert. Rank         Score        Market-share     Profit-share         TSR           Efficiency       Conv. Coef.
    DOG                 1           0.364 - 0.686   0.161 - 0.230    0.018 - 0.926    0.913 - 0.903    0.911 - 0.937     6.848 - 6.730
    IAMwildCAT          1           0.375 - 0.683   0.174 - 0.409    0.072 - 0.728    0.879 - 0.913    0.930 - 0.942     7.684 - 4.898
    jackaroo          2.333         0.422 - 0.416   0.186 - 0.131    0.161 - 0.313    0.919 - 0.804    0.923 - 0.882     6.884 - 7.790
    MANX              1.222         0.420 - 0.446   0.173 - 0.174    0.158 - 0.301    0.930 - 0.862    0.924 - 0.931     8.378 - 8.072
    MyFuzzy             1           0.329 - 0.502   0.140 - 0.340    0.171 - 0.230    0.677 - 0.935    0.905 - 0.954     8.323 - 6.056
    PersianCAT        5.889         0.430 - 0.339   0.187 - 0.124    0.194 - 0.137    0.910 - 0.755    0.926 - 0.852     5.919 - 8.035

specialists and wins in almost all of the games. This is true         The selection of this strategy lies in the fact that these trading
for the jackaroo opponents as well, where Mertacor was the            agents exhibit zero rationality, submitting offers at random,
winner of five games, obtaining a mean ranking of 2.333.              so we expect to obtain a lower bound for the allocative effi-
   A closer look at the market-share and profit-share metrics         ciency and an upper limit for the coefficient of convergence.
of Tables 3 and 4 reveals an increased profit-share score per         Moreover, all trading agents follow an -greedy market se-
trader for Mertacor when it faces multiple homogeneous op-            lection strategy ( = 0.1, α = 1). We have chosen not to use
ponents for all of the results except for the games against           a random market selection strategy, as this would annihilate
PersianCAT. This mirrors the influence of our charging pol-           the influence of the specialists’ charging policy on traders’
icy on Mertacor’s score and is the main reason for its relative       movement among the markets and, consequently, on their
success over jackaroo for some of the last experiments, al-           global performance obtained.
though the values of allocative efficiency and coefficient of            Table 5 illustrates the results for these experiments. As
convergence are better for the latter in these games.                 shown, MANX, jackaroo and PersianCAT are the most glob-
                                                                      ally efficient specialists, although the differences observed
                Homogeneous Markets                                   among markets are diminutive. Most important, the global
                                                                      allocative efficiency might be lower than its respective value
In this kind of experiments all specialists implement the
same policies, revealing their ability to cooperate and pro-
duce desirable global outcomes for the trading agents. This
is very useful in cases where the designer owns all of the            Table 5: Results for homogeneous markets populated by ZI-
specialists. The metrics used for our evaluation in this set-         C traders following an -greedy market selection strategy.
ting include the global allocative efficiency and the global          Each experiment was repeated 9 times.
coefficient of convergence. The latter is proportional to the
standard deviation of the prices from the global competitive
equilibrium price divided by that price. The global allocative          Specialist        Global Efficiency(%)         Global Conv. Coef.
efficiency is defined as the ratio of the traders’ actual profit        MANX                     93.516                      8.598
to their theoretical maximum profit (obtained, according to             jackaroo                 93.134                      6.813
microeconomic theory, when the price of all the transactions            PersianCAT               93.081                      4.213
is set at the global competitive equilibrium price) had all the         Mertacor                 92.542                      8.094
traders been in a single global market.                                 IAMwildCAT               92.247                      4.799
   We ran 7 different experiments, one for each contestant.             DOG                      91.063                      5.697
Each experiment was repeated 9 times and comprised 6 spe-               MyFuzzy                  90.940                      5.231
cialists and 240 ZI-C traders (120 buyers and 120 sellers).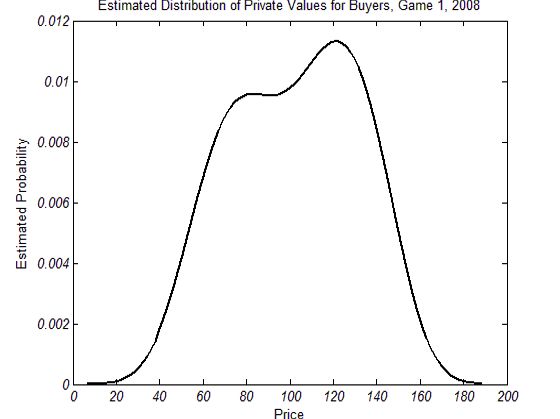
for a single market, as expected, but its mean value is above                         Acknowledgements
90% in all cases, validating once again the effectiveness of        We would like to thank the CAT organizing team for their
the DA mechanism regardless of the traders’ strategy mix            support during the competition as well as for providing us
utilized. PersianCAT presents a notably small value for the         with the tournament’s parameter values.
global coefficient of convergence, followed by the markets
of IAMwildCAT and MyFuzzy, thus revealing a quick con-                                      References
vergence of the transaction prices to the global competitive
equilibrium. On the other hand, jackaroo and, particularly,          Bowman, A. W., and Azzalini, A. 1997. Applied smooth-
MANX and Mertacor produced much higher values for this               ing techniques for data analysis: the kernel approach with
metric, despite being more efficient than the two last spe-          S-Plus illustrations, volume 18 of Oxford statistical sci-
cialists above.                                                      ence series. Walton Street, Oxford OX2 6DP, UK: Oxford
                                                                     University Press.
           Conclusions and Future Work                               Chatterjee, K., and Samuelson, W. 1983. Bargaining under
In this paper we have shortly described CAT tournament as            incomplete information. Operations Research 31(5):835–
well as our agent’s policies for the games of 2008.                  851.
   Moreover, we have introduced a successful way of com-             Cliff, D., and Bruten, J. 1997. Minimal-intelligence agents
puting the global competitive equilibrium, constituting the          for bargaining behaviors in market-based environments.
most valuable component of our specialist’s strategy. The            Technical Report HPL-97-91, Hewlett-Packard Labs.
importance of this point is twofold. From a market de-               Dash, R. K.; Vytelingum, P.; Rogers, A.; David, E.; and
signer’s perspective, the successful approximation of this           Jennings, N. R. 2007. Market-based task allocation mech-
point may help him meet his design objectives. The main              anisms for limited capacity suppliers. IEEE Transactions
challenge for a CAT specialist is to promote not only the            on Systems, Man, and Cybernetics - Part A 37(3):391–405.
quantity but also the quality of its traders’ population, identi-    Gerding, E.; McBurney, P.; Niu, J.; Parsons, S.; and Phelps,
fying and attracting the globally intra-marginal clients, thus       S. 2007. Overview of cat: A market design competition.
increasing both its allocative efficiency and potential profit       Technical Report ULCS-07-006, Dept. of Computer Sci-
from trades. This computation along with the classification          ence, Univ. of Liverpool.
of the bidding strategies might be the key to the success.
From the trading agent’s view, this estimation might provide         Gjerstad, S., and Dickhaut, J. 1998. Price formation in
the opportunity to obtain novel bidding strategies for multi-        double auctions. Games and Economic Behavior 22(1):1–
ple markets. Moreover, the global competitive equilibrium            29.
could be utilized from an arbitrageur (trader that exploits          Gode, D. K., and Sunder, S. 1993. Allocative efficiency
the price difference of the same good exchanged in multiple          of markets with zero-intelligence traders: Market as a par-
markets, buying it low and then selling it high) to identify         tial substitute for individual rationality. Journal of Political
the most profitable stock exchanges for its trades irrespec-         Economy 101(1):119–137.
tive of the markets’ pricing policies implemented. However,          Gomoluch, J., and Schroeder, M. 2003. Market-based re-
we must examine how modifying private values’ distribu-              source allocation for grid computing: A model and simu-
tion, trading strategies and market rules might affect our es-       lation. In Proceedings of the First International Workshop
timation results.                                                    on Middleware for Grid Computing, 211–218.
   In addition, we have provided a thorough analysis of the          Kagel, J. H., and Vogt, W. 1993. Buyer’s bid double auc-
competition of CAT entrants against Mertacor. We have                tions: Preliminary experimental results. In Friedman, D.,
compared our agent in one-to-one and one-to-many, as well            and Rust, J., eds., The Double Auction Market: Institutions,
as in homogeneous market settings. We have concluded that            Theories and Evidence. Cambridge, MA, USA: Perseus
the results of the tournament are in accordance to our find-         Publishing. chapter 10, 285–305.
ings, although there seems to be a slight divergence in the
                                                                     Nisan, N.; London, S.; Regev, O.; and Camiel, N. 1998.
case of MANX, which deserves further investigation. The
                                                                     Globally distributed computation over the internet - the
major problem with Mertacor is its low score of transac-
                                                                     popcorn project. In Proceedings of the 18th Interna-
tion success rate, which is possibly due to its quote-beating
                                                                     tional Conference on Distributed Computing Systems, 592.
accepting policy for the last rounds of each day, allowing
                                                                     Washington, DC, USA: IEEE Computer Society.
the submission of extra-marginal shouts. On the other side,
Mertacor manages to obtain a respectable level of profit in          Niu, J.; Cai, K.; Parsons, S.; and Sklar, E. 2007. Some pre-
the majority of the cases, being the second most profitable          liminary results on competition between markets for auto-
specialist in our experiments, thus accomplishing its main           mated traders. In Proceedings of the Workshop on Trading
design objective.                                                    Agent Desing and Analysis (TADA-07).
   The absence of a dominant strategy for the TAC Mar-               Niu, J.; Cai, K.; McBurney, P.; and Parsons, S. 2008a. An
ket Design setting provides each contestant with the incen-          analysis of entries in the first tac market design competi-
tives to attempt to improve his specialist’s behavior. Hence,        tion. In Proceedings of the IEEE/WIC/ACM International
we intend to conduct more experiments to detect the main             Conference on Web Intelligence and Intelligent Agent Tech-
sources of Mertacor’s inefficiency and eliminate them for            nology, volume 2, 431–437. Sydney, Australia: IEEE
our participation in the CAT tournament 2009.                        Computer Society.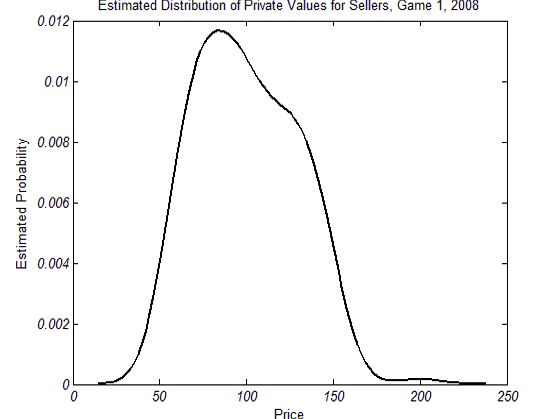
Niu, J.; Cai, K.; Parsons, S.; Gerding, E.; McBurney, P.;
Moyaux, T.; Phelps, S.; and Shield, D. 2008b. Jcat: a plat-
form for the tac market design competition. In Proceedings
of the 7th international joint conference on Autonomous
agents and multiagent systems, 1649–1650. Richland, SC:
International Foundation for Autonomous Agents and Mul-
tiagent Systems.
Roth, A. E., and Erev, I. 1995. Learning in extensive
form games: Experimental data and simple dynamic model
in the intermediate term. Games and Economic Behavior
8:164–212.
Rust, J.; Miller, J. H.; and Palmer, R. 1993. Behavior of
trading automata in a computerized double auction market.
In Friedman, D., and Rust, J., eds., The Double Auction
Market: Institutions, Theories and Evidence. Cambridge,
MA, USA: Perseus Publishing. chapter 6, 155–198.
Satterthwaite, M. A., and Williams, S. R. 1993. The
bayesian theory of the k-double auction. In Friedman, D.,
and Rust, J., eds., The Double Auction Market: Institutions,
Theories and Evidence. Cambridge, MA, USA: Perseus
Publishing. chapter 4, 99–123.
Smith, V. L. 1962. An experimental study of com-
petitive market behaviour. Journal of Political Economy
70(2):111–137.
Sutton, R., and Barto, A. 1998. Reinforcement Learning:
An Introduction. Cambridge, MA, USA: MIT Press.
Tesauro, G., and Das, R. 2001. High-performance bidding
agents for the continuous double auction. In Proceedings of
the Third ACM conference on Electronic Commerce, 206–
209. New York, NY, USA: ACM.
Tesfatsion, L. 2002. Agent-based computational eco-
nomics: Growing economies from the bottom up. Artificial
Life 8(1):55–82.
Vytelingum, P.; Vetsikas, I.; Shi, B.; and Jennings, N.
2008. Iamwildcat: The winning strategy for the tac market
design competition. In Proceedings of the 18th European
Conference on AI, 428–432.
Vytelingum, P. 2006. The Structure and Behaviour of the
Continuous Double Auction. Ph.D. Dissertation, School of
ECS, Univ.of Southampton, Southampton, UK.
Wurman, P. R.; Walsh, W. E.; and Wellman, M. P. 1998.
Flexible double auctions for electronic commerce: theory
and implementation. Decision Support Systems 24(1):17–
27.
You can also read