Towards a Rights-Based Ice Monitoring Trigger - CRIPE
←
→
Page content transcription
If your browser does not render page correctly, please read the page content below
CGU HS Committee on River Ice Processes and the Environment
 21st Workshop on the Hydraulics of Ice Covered Rivers
 Saskatoon, Saskatchewan, Canada, August 29 - September 01, 2021.

 Towards a Rights-Based Ice Monitoring Trigger

 Bruce Maclean1, Caroline Bampfylde2, Melody Lepine3 and Lisa Tssessaze4
1
 Maclean Environmental Consulting, 812 Jubilee Ave. Winnipeg, Manitoba, R3L 1P9
 bruce@macleanconsutling.ca
 2
 Biomath, 9716 84 Ave NW, Edmonton, Alberta T6E 2E9
 caroline@biomath.co.uk
 3
 Mikisew Cree First Nation – Government and Industry Relations,
 Suite G – 8219 Fraser Avenue, Fort McMurray, Alberta T9H 0A2
 melody.lepine@mcfngir.ca
 4
 Athabasca Chipewyan First Nation – Dene Lands and Resource Management
 200 Taiganova Cres. Fort McMurray, Alberta T9K 0T4
 lisa.tssessaze@acfn.com

 The Mikisew Cree First Nation and the Athabasca Chipewyan First Nation
 operate Community-Based Monitoring (CBM) Programs and have collected ice,
 snow and weather observations for over 9 winter seasons. This work started in
 response to their Elders’ concerns about ice-quantity and quality changes. Data
 has been collected to understand the impacts of climate change, oil sands water
 withdrawals and hydro-electric development and how cumulatively these impact
 their traditional rights.

 The Nations have developed a culturally and scientifically relevant monitoring
 methodology which includes Environmental Effects Monitoring-type triggers.
 These triggers are being used to give context for any future observed change.

 Maximum seasonal ice thickness and snow depth has varied at sites across the
 region and over time, with differences falling within expected ranges and no
 statistically significant temporal trends. Average monthly ice thickness however,

 1
has decreased in January but increased in March, while average monthly snow
depth has increased in February, perhaps a reflection of climate change.

The Nations have also developed a field-data-parameterized model, to predict ice-
thickness growth from weather data. The Nations undertook a historical
retrospective using the model, which has shown a decreasing trend and
approximately 8 cm of lost maximum thickness over the last 100 years, reflective
of Elders’ Indigenous Knowledge.

In addition, the model calculates ice-travel duration (Arp et al. 2020), which is
the predicted number of safe-travel days each season. This metric has
implications for regional winter-travel safety. The Nations are exploring ‘Ice-
travel duration’ as a rights-based management trigger. This index can be used to
track cumulative impacts on Section 35 Aboriginal and Treaty rights. Harvest
activities are predicated on safe travel to traditional harvest areas and the CBMs
can track how changing conditions impede the ability to safely access traditional
territory.

 2
1. Introduction
The Peace Athabasca Delta (PAD), located in northeastern Alberta, Canada, is the largest
freshwater delta in North America. The Delta was designated as a wetland of international
importance under the RAMSAR Convention, and is also listed as a UNESCO World Heritage Site.

For the Mikisew Cree First Nation and Athabasca Chipewyan First Nation (here after referred to
as MCFN and ACFN respectively) this is their traditional territory and they have witnessed vast
changes to this homeland. There has been rapid development of the oil sands in the lower
Athabasca Region, ongoing hydro-electric development along the Peace River, environmental
stressors in the Peace and Athabasca watersheds such as agriculture, urban growth, the legacy of
pulp and paper, mining, waste incineration, and climate change. Cumulatively, this has led to
negative ecological changes in the PAD. ACFN and MCFN, downstream from oil sands operations
and the Peace River hydroelectric development, are increasingly concerned about magnifying
contamination and decreasing water levels, as well as changes to winter conditions, including ice
quality and quantity.

The ACFN and MCFN established community-based monitoring programs (MCFN in 2008 and
ACFN in 2010) to track changes in the environment and relate these to their lost potential to safely
continue to access their Section 35 rights.

1.1 Context
First hand observations by Indigenous Knowledge holders of declines and changes in the water
levels of the PAD rivers, declines in water quality, fish health, wildlife numbers and ice quality
and subsequent overall decline in the ecological health of the PAD prompted the Elders to
initiate a Community-Based Monitoring program to understand the implications.

The PAD itself is drying: Satellite imagery analysis of the PAD shows ~1450 km2 of temporarily
inundated regions that support critical habitat have diminished by ~10 km2/yr over the past 46
years; a decline of ~32 percent over the last half century. This environmental change corresponds
to the severe decline of culturally and economically important wildlife populations such as
muskrats (Ward and Gorelick 2018).

Ice-jam flooding and subsequent flood-induced recharge of perched water basins in the PAD has
been decreasing since the 1970s (AECOM 2010, Beltaos 2016, Beltaos et al. 2006, Beltaos et al.
2008, Candler 2013, Carver 2013, Carver 2016, Davidson and Hurley 2007, Dubé and Wilson
2013, MCFN 2017, 2018a, 2018b, Peters and Buttle 2010, Peterson and Courtorielle 1992, Prowse
and Conly 1998, Prowse and Conly 2002, Prowse et al. 2006, The PAD Project Group 1972,
Wrona et al. 1996). This was also the conclusion of a 2018 Strategic Environmental Assessment
(SEA) of Word Buffalo National Park (Independent Environmental Consultants 2018). The SEA
found the main causes of this ice-jam decline to be a combination of higher winter flows and ice
elevations due to flow regulation on the Peace River, exacerbated by decreased snowpack runoff
from tributaries to the Peace River due to climate change.

Indigenous Knowledge Holders and scientists noted in the SEA report and interviews, that poor
quality and thin ice cover, in combination with the lower strength of the Peace River flows in the

 3
spring, prevents the large ice jams that are needed to flood the PAD in the spring and replace
water in lakes and channels in order to keep the PAD healthy (ACFN 2018, MCFN 2018a,
2018b).

The loss of ice has widespread ecological concerns, however Elders and land users are also
concerned with access to the land for traditional rights, recreation, harvesting and spiritual
activities. In particular in the winter season, access to traditional territory and travel safety is a
concern which is determined by ice thickness and the timing of freeze-up and break-up. Elders are
concerned with changing ice conditions which translates into a concern about the conditions for
safe travel. Dangerous ice conditions involve thin ice, weak or brittle/candled ice, overflow and
hanging ice.

Since hydro-electric regulation of the Peace River has altered the natural flow patterns, hydro-
electric operations are blamed by many Elders and active land users for creating worse ice
formation. The artificial high freeze-up levels leads to dangerous hanging ice, where the ice is not
touching the water, and a fall hazard for snowmobile travel. Overflow from hydro-electric flow
regulation, unusual climate-driven winter melting, or early seasonal snows before full ice
formation can bring as much as 20 cm of water overtop of winter roads and snowmobile trails; -
cumulatively this is deemed too much weight for such ice to be safe. Elders have observed that the
freeze and thaw on the Peace is unpredictable due to a combination of hydro-electric operations
and a changing climate and creates rough, sharp ice that makes travel challenging. Many Elders
mention that the ice seems to erode from the bottom up on the Peace River. Community-monitoring
crews have observed unexpected ice loss in the height of winter on the Peace River, coinciding
with winter flow fluctuations resultant from hydro-electric operations.

Higher flows at freeze-up coupled with irregular winter flows is also leading to sediment in ice.
Increased sedimentation in both the Athabasca and Peace River systems are blamed for lack of
good ice formation. The sediment content creates a darker ice which does not freeze as well, melts
more quickly in the sun and creates slushy conditions even if decent ice thickness remains.

 We had open water this winter. Saw this back in ’96 or ’97. This year, crossings on
 the river are okay, just bad close to Fort Chip. Currents from the lake are moving
 around sediment, which makes it not freeze. If weirs were fixed, it would help ice
 form. – Land users advocates network (LUAN) Elder

A consensus among Elders and active land users is that the spring melt has become too fast for
safe traditional hunting activities in late spring. Ice ‘rots’ far quicker and even the most experienced
land user can get caught stranded as ice gives way to open water.

Elders and land users have observed negative trends for Indigenous Knowledge indicators such as
ice colour; - used to be black and sometimes blue in the past and now is described as white or even
brown, while ice quality was formerly solid and now is considered of less suitable quality and is
more brittle or slushy. Less ice and ice of weaker quality, more overflow and a more rapid melt
have been described in detail. Elders have shared that ice no longer forms as well, or as thick, as
Elders recall from decades ago. Elders have noted on caribou hunting trips much farther to the

 4
northeast into Saskatchewan (Ivanhoe Lake) that they encounter ice like they used to see in the
PAD; -consistently over a metre of thick hard blue ice (Courtoreille 2016).

Winter roads and ice crossing maintenance have become far more challenging. The winter road is
the main artery for fuel, food and social contact. Ice timing and quality also impact annual
construction of the Fort Chipewyan winter road. As observed in the winter of 2019-20, ice
conditions were unusual and included open water at the outlet of Lake Athabasca into the Des
Rochers River. Despite very solid, thick ice on the southern Athabasca River and the upper Peace
River, PAD ice formation was well below expectations for some regions of the Delta. This forced
the relocation of the winter road for the community of Fort Chipewyan. Unsafe ice conditions were
also responsible for at least one vehicle and one experienced snowmobile operator going through
the ice. That winter season, open water persisted at the winter road crossing location into February.

 It does something to a person. This is safety. We’re scared to let the kids go out.
 We are travelling with the windows rolled down because we are scared to cross the
 winter roads. Our lives are on the line. – LUAN Elder

 The road conditions are scaring people away. People are not coming to visit us
 because of the story of the ice. – LUAN Youth representative

Given the changing conditions, people often need to travel longer, using land-based routes which
have financial implications. Overflow and hanging ice are deemed very dangerous to travel, and
raise fears in the community that the Athabasca River, its tributaries and the PAD, will no longer
support the safe passage so important to traditional Indigenous lifestyles.

1.2 Elder direction for Community-Based Monitoring Program
To address some of these concerns and assess changes over time in the PAD, the Community-
Based Monitoring (CBM) winter work includes regular visits to sites of interest to collect weather
data, ice thickness, snow depth and water-quality and quantity parameters under-ice. The
knowledge Elders have shared with CBM program developers and staff has in turn shaped the
CBM program.

Interviews with Elders have resulted in ice quality indicators (colour and quality) that are tracked
weekly by the CBM program. The Indigenous Knowledge indicators for CBM inform us that blue,
black and clear coloured ice is good quality ice, while a white colour represents weaker ice. Ice
density is important and ice of high quality is solid, while poor ice is described as slushy or brittle.

The Athabasca Chipewyan First Nation recently undertook Indigenous Knowledge interviews with
their Elders and found that 59 of 61 interviewees stated that ice quality has changed in their
lifetime. Elders describe “brown ice”, ice that is “slushy and dirty”. Fifty-one of 59 Elders stated
that ice quantity has been reduced in their lifetime. Ice is now described as “brittle”, “thinner”, and
with “more open holes”. Elders also note that snow falls earlier in winter and is heavier than it
once was. Conditions are deemed “unpredictable,” and one interviewee was very concerned to
have noted rain in January. Because of these winter changes, 54 respondents (out of 63) have

 5
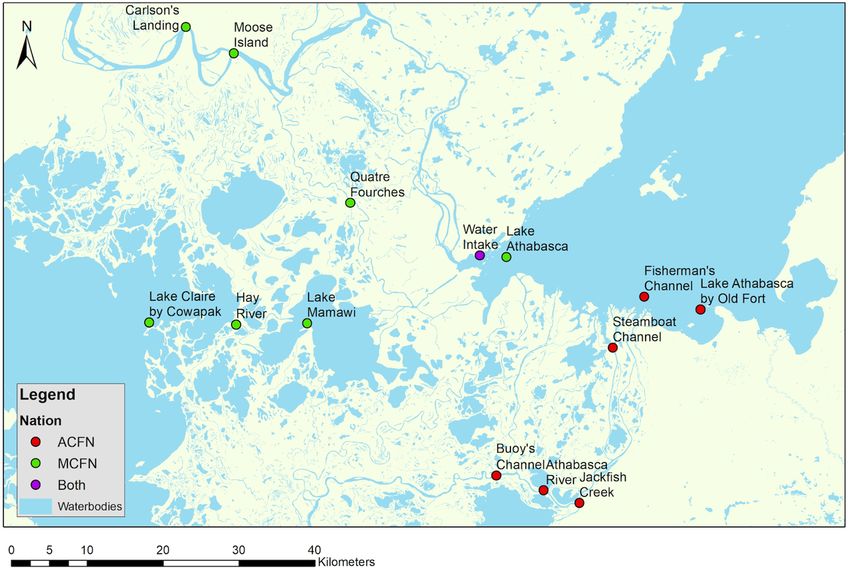
altered at least some percentage of their travel routes. Overall Elders note that winters are less cold
and are shorter.

Elders have directed the development of the CBM, in particular to track ice changes and winter
conditions and identified many of the locations to monitor. Therefore, the Community-Based
Monitoring program seeks to understand, within the PAD, whether snow and ice conditions are
changing over time and if there is an impact of climate change on the winter conditions. The CBM
has undertaken Indigenous and scientific methodology development to support a long-term winter
monitoring program. The intent with this work is to set monitoring and management triggers that
can be used going forward. This now forms the basis of the Winter Program and will integrate
with ongoing efforts of the existing CBM program. Practically, information on winter-travel safety
in the PAD can also be derived from this program including periods of safe travel on ice,
predictions of ice-thickness growth. Finally, the CBM ice work has the potential to provide
valuable information on spring ice-jam potential, important in evolving Federal Action Plan work
to guide ecological flow needs.

While the Community-Based Monitoring program combines Indigenous Knowledge and western
science to understand environmental conditions and trends, the purpose of this paper is to focus
mostly on the scientific findings of the last 9 winter seasons of data collection.

2. Methods
Since 2012, MCFN and ACFN monitoring crews have been collecting data about ice thickness
and snow depth measurements as well as Indigenous Knowledge indicators of ice colour and
quality at sites throughout the PAD. They also collect under-ice water-chemistry samples (similar
to the open water season water-quality monitoring), weather conditions such as air temperature,
wind speed and direction, barometric pressure, and humidity. Data collection methodology has
evolved over time but the current program has received reviews from experts in the field and is
consistent with other winter programs.

2.1 Sampling Sites
Data collection involved crews travelling to sites on a regular basis throughout the winter season
starting after freeze-up when the ice is safe to walk on, and continuing until break-up or when the
ice becomes unsafe (Government of Canada 2005). Sampling sites were chosen by Elders along
with the assistance of Kevin Courtoreille and Jocelyn Marten (MCFN), Johnathan Bruno (ACFN)
and Ronnie Campbell (Parks Canada). Sites reflect both local knowledge from frequent lake and
river users, as well as Traditional Knowledge from ACFN and MCFN members. Sites’ locations
have evolved across the seasons. Sites currently included in the program and prior sites can be
seen in Figure 1. Winter monitoring sites are listed in Table 1.

 6
Table 1. Wintering monitoring sites. Water Intake site is a duplicate site for both crews for
 comparative Quality Control.
 Nation Site Latitude Longitude Date started Date discontinued Notes
ACFN Water Intake 58.710765 -111.145046 2014-15 -
ACFN Buoy's Channel 58.450695 -111.106541 2019-20 - near Jackfish
ACFN Athabasca River 58.433244 -110.999792 2013-14 -
ACFN Jackfish Creek 58.418221 -110.918850 2012-13 site moved close to AR in by Graveyard - called
 2018-19 Maybelle
ACFN Steamboat Channel 58.601883 -110.842783 2012-13 site used to be Goose Island
 Channel right at mouth of
 GIC on Steamboat
ACFN Fisherman's Channel 58.661951 -110.771037 2013-14 -
ACFN Lake Athabasca by Old Fort 58.646655 -110.643761 2019-20 -
ACFN Embarras by Canoe Portage 58.566035 -111.096407 2012 2018-19 ice wasn't safe - too
 much overflow and
 hard to get to
ACFN Big Eddy on Athabasca River 58.473333 -111.126167 2013 2016 moved to cut above
 island (current AR site)

MCFN Lake Athabasca 58.717338 -111.147388 2012 - unsafe in 2019-20
MCFN Quatre Fourches 58.772467 -111.439936 2012 -
MCFN Moose Island 58.948298 -111.708670 2016 -
MCFN Water Intake 58.710985 -111.144864 2014-15 -
MCFN Lake Mamawi 58.629793 -111.535942 2012 -
MCFN Hay River 58.627288 -111.697139 2012 -
MCFN Carlson's Landing 58.978716 -111.818920 2019-20 -
MCFN Lake Claire by Cowapak 58.628715 -111.894062 2019-20 -

 Figure 1. Sampling locations for MCFN and ACFN, 2020 winter season.

 7
2.2 Field Methods and Procedures
At each site, for early measurement years, only one ice thickness measurement was taken each
time in undisturbed areas. During the 2019-2020 winter season, three ice-thickness measurements
were recorded across the water course or body. This methodology change was based on feedback
from Federal Government scientists. Starting in the 2020-21 winter field season, extra effort will
be taken in March to sample more sites and to complete 7 measurements per transect (up from 3).
Humidity readings will also be taken.

Snow depth measurements are taken concurrently with ice-thickness measurements by firmly
inserting a graduated (cm) metal or wooden stake into the snow until it hits ice, and then a
measurement can be taken to the nearest cm. Ice thickness is measured using a cm-divided
measurement stick or tape measure. For every visit to each site, new drill holes are made at
previously undisturbed places in the same spot as the snow depth measurement. The ice is
measured for its thickness (the total thickness of ice, including the black ice, the snow ice (white
ice) and the water layers between ice layers) to the nearest cm. Holes are located at a distance of
at least 50 m from the shore when possible. (Finnish Environment Institute 2018). Water depth is
measured from the upper surface of the hole cut in the ice (in cm) to the bottom. Depth
measurements are taken with a depth sounder.

Water-quality measurements are taken using an YSI Pro DSS water-quality device. These
parameters are temperature, dissolved oxygen, conductivity, salinity, pH, and turbidity. A Secchi
tube is also employed to get a measurement of water clarity. Weather conditions are taken from
observations by crews. These parameters are wind direction, wind speed, air temperature and
barometric pressure at each site. Measurements are taken using a Kestrel anemometer (wind meter)
and GPS compass.

Indigenous knowledge indicators of ice colour and ice quality are recorded at each site. Elders are
frequent participants in the CBM field work and help refine these indicators and educate the
younger staff.

2.3 Data Quality Assurance and Quality Control
During each field trip, data collected at the sites is uploaded into the GeoKeeper database (custom
database). Any photographs taken are also attached to the GeoKeeper database record and
uploaded. When outside of wireless or cellular range, uploads are done back at the office. The raw
data is then merged at the end of each winter season and reviewed for data quality. For parameters
with multiple measurements such as ice depth, snow thickness, water depth and Secchi disc, an
average value is calculated.

Observations or recordings were reviewed in the context of seasonal and historical data for each
site and for the PAD as a whole. Blanks or zero data entries were reviewed to ensure they were
correctly attributed. For parameters with minimum or maximum reasonable values, data outside
of these ranges were reviewed and addressed as necessary. Erroneous data was removed from
further analysis.

 8
Once a clean data set was created for each winter season these were merged with previous seasons.
Data analysis was then carried out on the cleaned data.

2.4 Data Analysis Methods
Ice thickness observations were analyzed and the maximum ice thickness for each site for each
winter season was extracted. The number of observations and the date of each maximum were also
recorded.

Snow depth observations were analyzed in a similar way to ice thickness, with the maximum snow
depth for each site for each winter season extracted. The number of observations and the date of
each maximum were also recorded.

In order to place observations in context, a region-wide (for all ice seasons) mean maximum ice-
thickness and snow-depth value was calculated along with a standard deviation. For sites with
sufficient observations over multiple seasons, trends were analyzed to understand how variable ice
thickness and snow depths have been over the period of record.

In order to understand changes in the timing of ice formation, break-up and snow accumulation,
the monthly trends in ice thickness and snow depth were also analyzed (for the most recent decade
only). These may indicate seasonal changes caused by climate change or hydro-electric regulation
or both for some sites. For climate-driven variables, often data of 30 years or more is required.

2.5 Modelling Approaches
To investigate whether maximum ice thickness and seasonal growth could be predicted from
climate variables, such as temperature and snow accumulation, a mathematical model was
developed based on the established Stefan equation but parameterized using local PAD-specific
data.

3. Results
3.1 Maximum Ice Thickness
A total of 123 maximum data points were generated considering each site and each ice season of
observations. For sites with more than 50 observations over all ice seasons, temporal trends were
evaluated. The results are shown in Figure 2.

 9
Figure 2. Variation of maximum ice thickness across ice seasons at sites throughout the PAD.
 Blue circles indicate maximum ice thickness for each ice season. Green dashed lines indicate
regional mean maximum ice thickness for all ice seasons. Solid green lines indicate ± 2 ∗
 _ . 95% of observations are expected to fall between the solid lines.

There are some ice seasons where the maximum ice thickness falls outside of the solid lines (see
Figure 2), but these occur mostly for ice seasons with single observations often taken early in the
ice season before ice has had time to build up. The only site with multiple visits within an ice
season with a point outside of the solid lines is the Water Intake site for 2015-16. There are no
obvious trends in maximum ice thickness over the period of record, which is not unexpected given
the short-term nature of the data collected to date. Note that due to logistics, crew constraints and
safety considerations, the timing of ice thickness measurements is variable depending on the site
and year. A limitation of the data for maximum ice thickness at a site is that the final measurement
may occur anytime between January and April. For dates earlier in the ice season, measured ice
thickness may not be indicative of actual maximum ice thickness, so this should be taken as an
assumption of any analysis work.

 10
3.2 Maximum Snow Depth
A total of 123 maximum data points were generated considering each site and each ice season of
observations. For sites with more than 50 observations over all ice seasons, temporal trends were
evaluated. The results are shown in Figure 3.

Figure 3. Variation of maximum snow depth across winter seasons at sites throughout the PAD.
Blue squares indicate maximum snow depth for each winter season. Green dashed lines indicate
regional mean maximum snow depth for all winter seasons. Solid green lines indicate ±
 2 ∗ _ . 95% of observations are expected to fall between the solid lines.

There are some winter seasons where the maximum snow depth falls outside of the solid lines (see
Figure 3), but these occur mostly for winter seasons with single observations often taken early in
the winter. The only site with multiple visits within a winter season with a point outside of the
solid lines is Moose Island for 2013-14 and 2015-16. There are no obvious trends in maximum
snow depth over the period of record.

 11
3.3 Monthly Trends over Winter Seasons
In order to investigate if the timing of ice formation, freeze-up and break-up is changing over time,
the average monthly ice thickness across all sites for each ice season was obtained from averaged
daily values collected within a month (see similar approach for snow depth by Liu et al 2019). The
results are shown in Figure 4 (left hand column).

Figure 4. Linear regression of average monthly ice thickness (left hand column) and snow depth
 (right hand column) for entire region for each ice season.

As can be seen in Figure 4, the average January ice thicknesses have decreased significantly, while
the average March ice thicknesses have increased significantly over the past 9 winter seasons. This
could indicate that freeze-up is happening later in the ice season and also break-up is happening
later in the ice season. Thus, based on the last decade of observations, the period of ice cover may
have shifted. This may have implications for the condition of ice, especially towards the end of the
ice season when temperatures get warmer, and in particular on the establishment of the winter
road.

Similarly, the average monthly snow depths were calculated for each winter season to determine
if there was a trend over time. The results are shown in Figure 4 (right hand panels). The only
month with a significant trend over time was February with increasing snow depths. The increased

 12
snow depths have implications for insulation of the ice under the snow and potentially reduced ice
formation under the snow.

3.4 Modelling Maximum Ice Thickness
In order to investigate whether maximum ice thickness could be predicted from climate variables,
the data observations for maximum ice thickness was analyzed as a function of accumulated degree
days of frost (ADDF - this is the accumulated average temperatures below zero from the start of
the winter season until the date of the maximum) and the measured snow depths. We use the Stefan
ice-growth model (Stefan 1891), in this instance, the model is a simple mathematical equation
tailored to the specific conditions of the PAD. The equation used is: max ice thickness=f(snow
depth)*sqrt(ADDF). A linear form of the function f was considered but there was strongest
evidence for using a constant term for f. The resulting equation, parameterized using field data had
the following form:

 Max ice thickness = a*sqrt(ADDF) [1]

where a varies by site. Models for individual sites were all significant with p0.87.
The range of a values was between 1.359 and 1.726 which is comparable to results from other
northern lakes and rivers (Michel 1971). Some example comparisons between field observations
and modelled output are shown for Embarras River and Lake Mamawi sites below in Figure 5.

Figure 5. Comparison between field observations (blue symbols) for maximum ice thickness and
model predictions (orange symbols) for Embarras River and Lake Mamawi sites, R2= 0.937 and
 0.969 respectively.

While there are some discrepancies, the model is a useful approach to be able to predict maximum
ice thickness using climate variables.

3.5 Predicted Regional Ice Growth and Decay
Another way to compare across winter seasons, and integrate the weather and climatic conditions
in terms of their impact on ice thickness in the region, is to use a regional model of ice growth
within an ice season. We used all the regional data for ice thickness as it evolves throughout each
season from all sites and climate data from the Fort Chipewyan RCS weather station (ID 3072659).
A regional model for ice thickness on any day of the season included a growth component with

 13
input variables of accumulated temperatures and snow accumulation and a thawing contribution
(ice decay when temperatures are above zero). This approach is consistent with other northern
lakes and river systems (Arp et al. 2020 and Bilello 1980). The regional ice growth model was
used for analysis going forward in this paper and in particular to calculate maximum ice thickness
and ice-travel duration for each season as follows:

 Ice thickness = a*sqrt(ADDF)–b*snow accumulation*sqrt(ADDF)–c*ADDT [2]

where a = 1.24, ADDF are the accumulated degree days of freezing, b = 0.0008, c = 1, ADDT are
the accumulated degree days of thawing. ADDF and ADDT are calculated from October 1 for lake
sites and November 1 for river sites. If ice thickness falls to zero, then ADDF and ADDT are reset
to zero for that date and then accumulation continues once ice thickness is predicted to be positive
again.

Examples of ice growth during a season at a site and comparison with the model predictions can
be seen in Figure 6. Here the pattern observed is followed closely by the model predictions,
although the predicted ice thickness appears to slightly underestimate the observed ice thickness.
Results can be interpreted as conservative estimates.

Figure 6. Comparison between field observations for ice thickness throughout an ice season and
 model predictions for Jackfish Creek 2017-18 season and Quatre Fourches 2018-19 season,
 R2=0.921 and 0.904 respectively.

This approach means that the seasonal maximum ice thickness can be estimated even if crews are
not able to visit sites on the exact date of maximum thickness due to safety or other constraints.
This metric allows better comparisons between winter seasons and across time. The approach also
enables a prediction to be made about ice-on/ice-off dates which are inherently difficult to estimate
from the ground in the field (distant field sites cannot be reached safely until at least 30 cm or 12
inches of ice). An example winter season (using regional data) with ice thickness growth is shown
in Figure 7.

 14
Figure 7. Example ice growth and decay curves for the 2014-15 winter season, the time when
 maximum ice thickness (MIT) is reached and the period representing ice-travel duration (ITD).

The results for modelled regional maximum ice thickness for each season are shown in Figure 8.
There is a slight decrease in maximum ice thickness over the years, but this is not significant.

 Figure 8. Regional maximum ice thickness (blue circles) calculated by using a model that uses
 daily temperatures and snow accumulation across an ice season to describe ice growth and
 decay. Mean predicted maximum ice thickness is displayed (dashed line) and upper and lower
triggers representing ± 2 ∗ _ (solid lines), calculated over the period
 of record.

3.6 Ice-Travel Duration – Rights-based management trigger
Another metric of interest is the period of time when it is safe to travel on the ice due to sufficient
ice thickness, known as Ice-Travel Duration (ITD; Arp et al, 2020). This is estimated from the
modelled ice growth from an ice thickness of 30 cm to the day of the winter season when the
maximum ice thickness is reached. Even if safe travel is possible, once the ice starts to decay, this
is difficult to estimate, therefore a conservative approach is to use the date of maximum ice
thickness. Once decay begins, the ice loses strength and bearing capacity rapidly; and cannot be
trusted for safe travel even if its thickness is still near the maximum value. This is corroborated by
the Elders and CBM-team experiences on the ice.

 15
The ITD metric allows comparison between locations, winter seasons and over time. The graphical
interpretation of ice thickness duration for a season can be seen in Figure 7. The results across
winter seasons are shown in Figure 9. There is a very slight decrease in ice-travel duration over
the years, but this is not significant.

 Figure 9. Regional ice-travel duration (blue circles) calculated by using a model that uses daily
 temperatures across an ice season to describe ice growth. The period of travel duration is
 calculated from the day the ice reaches 30 cm until maximum ice thickness is reached. Mean
 predicted maximum ice thickness is displayed (dashed line) and upper and lower triggers
 representing ± 2 ∗ _ (solid lines), calculated over the period of
 record.

This index is furthermore useful for exploration as one potential way to track the combined impacts
of hydro-electric development, industrial water withdrawals and climate change on the function of
Section 35 Aboriginal and Treaty rights. Harvest activities and other traditional rights are
predicated on the ability to safely access traditional areas.

The MCFN and ACFN CBM programs are designed to track environmental changes against
management triggers, or rights-based triggers (Sec 35 triggers).The Nations already formally
employ one Section 35 Rights policy to track open-water navigation. They have established an
‘Aboriginal E(x)treme Flow’ (AXF) policy/trigger which links flow rates on the Athabasca River
to safe navigational depths at known pinch points (known shallower locations which are the first
to become impassable as water depths decline). By monitoring changes to water depth in the PAD,
the ACFN and MCFN are able to point explicitly to the oil sands water withdrawals as having
negative impacts to their navigation rights below 500 m3/s. Now, long-term monitoring of an Ice-
Travel Duration (ITD) index will allow the communities to show how rights-based activities are
compromised by the cumulative loss of ice quantity.

Additionally, access to a safe, functional winter road in a remote, fly-in community is critical for
the safety, food security, family connections and a myriad of other reasons. Erosion of this critical
resource may be tracked against the index and may lead to useful management considerations for

 16
hydro-electric flow regulation and potential adaptations to climate variations. CBM can therefore
track how changing conditions impede the ability to safely access traditional territory.

3.7 Historical Retrospective on Ice Thickness and Travel Safety
Using the models for regional maximum ice thickness and ice-travel duration as tools, estimates
for historical ice conditions were investigated. Historical weather station data was collated from
Fort Chipewyan Station ID 3072657 (1920 – 1940 and 1962 - 1967), Fort Smith Station ID
2202200 (1940-1962), Fort Chipewyan A Station ID 3072658 (1967 – 2005), Fort Chipewyan
AWOS A Station ID 3072662 (2006 – 2011), Fort Chipewyan Station ID 3072655 (2011 – 2012)
and Fort Chipewyan RCS Station ID 3072659 daily (2012 – 2020). Using weather station
information as input, ice thickness and ice-travel duration were estimated for the past 100 years.
The results for regional maximum ice thickness are shown in Figure 10.

 Figure 10. Regional maximum ice thickness calculated for the last 100 years using daily
 temperatures across an ice season to describe ice growth. The period of CBM data indicates the
 period which was used to build the model. The decreasing trend in thickness is statistically
 significant (p
duration metric than in maximum ice thickness. This is to be expected, since this metric involves
more uncertainty in the timing of reaching 30 cm and peak thickness.

 Figure 11. Regional ice thickness duration calculated for the last 100 years using daily
 temperatures across an ice season to describe ice growth. The period of CBM data indicates the
 period which was used to build the model. The period of travel duration is calculated from the
 day the ice reaches 30 cm until maximum ice thickness is reached.

There are some assumptions and limitations to this method. There are gaps in temperature data for
the Fort Chipewyan weather station for some periods. To fill these gaps, the Fort Smith station
was used a proxy. Both stations show very high correlation for mean daily temperatures (with
R2>0.94). There are model uncertainties based on parameterizing the model using 9 seasons of
data (although the R2 is high at 0.88). It should also be noted that the estimates are for the PAD as
a region and not for a specific location.

4. Discussion and Conclusion
The Mikisew Cree and Athabasca Chipewyan are concerned about the changing health of the Peace
Athabasca Delta as well as travel safety, access to traditional territories, exercising traditional
rights, impacts of hydro-electric regulation, industrial water uses by oil sands development and
climate change. Due to these concerns, a Winter Monitoring Program was established in 2012.
This has evolved over the past 9 winter seasons, and collects ice thickness, snow depth and climate
information as well as water-quality parameters at several sites throughout the PAD.

The program now has sufficient information to guide robust program design and development of
triggers to watch for changes to winter conditions. The triggers can be used to give context to
future observations and support monitoring for change.

Individual sites across the PAD show variability in observed maximum ice thickness and observed
maximum snow depth with no consistent trends across the period of data collection. The majority

 18
of observations fall within the expected ranges. When the timing of ice thickness and snow depth
within an ice season is considered, the average monthly ice thickness in January has decreased
while the March thickness has increased. This may indicate the period of ice cover is shifting later
in the winter season which has implications for travel safety towards the end of the winter as
warmer temperatures impact break-up. Snow depth has increased in February which has
implications for insulating the ice.

A model has been developed to predict ice thickness, growth and thawing using climate
information from the Fort Chipewyan weather station. This can be used if sites cannot be visited
due to logistics and also towards the end of the winter season as break-up occurs and travel safety
is a concern. The model can be used to predict maximum ice thickness, ice-travel duration (length
of the safe-travel season) and ice-on and ice-off dates. Predicted maximum ice thickness integrates
weather data (accumulated temperatures and snowfall) across the entire season and is not
dependent on crew visits to a site. A regional estimate can then be compared across seasons. This
has shown a slight decrease as has ice-travel duration (safe-travel days). If this trend becomes
significant and continues it may have implications on traditional rights.

A historical retrospective to estimate ice thickness and safe winter navigation has shown
decreasing trends over the last 100 years. This is a co-validation of Traditional Knowledge, where
Elders’ reflections have shown accuracy in noting environmental change. Future projections of
climate change and their impacts on ice formation indicate that ice thickness is likely to decrease
by between 18 to 28 cm by the 2080s (Beltaos and Bonsal 2021), indicating more change is to
come in the region with corresponding impacts on traditional use and activities.

5. Acknowledgments
The Mikisew Cree First Nation – GIR and Athabasca Chipewyan First Nation – DLRM’s
Community-Based Monitoring programs wish to thank the ACFN and Mikisew Elders,
Community-Based Monitoring program staff, Government of Canada, IISD – Experimental Lakes
Area, and University of Alaska Fairbanks for feedback and involvement in this project.

6. References
AECOM. 2010. Synthesis of Ecological Information Related to the Peace-Athabasca Delta.
 Prepared for Public Works and Government Services Canada. Bracebridge, ON, Canada:
 Project Number: 60144637.

ACFN. 2018. Workshop on the development of the SEA with representatives of Athabasca
 Chipewyan First Nation, Independent Environmental Consultants (IEC), and Parks
 Canada. Fort Chipewyan, Alberta, 31pp.

Arp, C.D., Cherry, J.E., Brown, D.R.N., Bondurant, A.C. and Endres, K.L. 2020. Observation-
 derived ice growth curves show patterns and trends in maximum ice thickness and safe
 travel duration of Alaskan lakes and rivers, The Cryosphere, 14, 3595–3609.

 19
Beltaos, S. 2016. Comments on BC Hydro presentations, Sept 2016 Prepared by S. Beltaos, ECCC,
 at the request of S. Macmillan, Parks Canada. As part of the Reactive Monitoring Mission
 of Wood Buffalo National Park by UNESCO in 2016.

Beltaos, S., and Bonsal, B. 2021. Climate change impacts on Peace River ice thickness and
 implications to ice-jam flooding of Peace-Athabasca Delta, Canada, Cold Regions Science
 and Technology, 186, 103279.

Beltaos, S., Prowse, T.D. and Carter, T. 2006. Ice regime of the lower Peace River and ice-jam
 flooding of the Peace-Athabasca Delta. Hydrological Processes, 20, 4009–4029.

Beltaos, S., Prowse, T., Bonsal, B., Carter, T., MacKay, R., Romolo, L., Pietroniro, A., and Toth,
 B. 2008. Climate impacts on ice-jam floods in a regulated northern river. Cold region
 atmospheric and hydrologic studies. Hydrologic Processes, 2, 345–362

Bilello, M.A. 1980. Maximum thickness and subsequent decay of lake, river, and fast sea ice in
 Canada and Alaska. U.S. Army. 160 pages.

Candler, C. 2013. Athabasca Chipewyan First Nation and Mikisew Cree First Nation Initial Report
 on Peace River Knowledge and Use for BC Hydro’s Proposed Site C Project.

Carver, M. 2013. Impacts of the Proposed Site C Dam on the Hydrologic Recharge of the Peace-
 Athabasca Delta Submission to the Site C Joint Review Panel Prepared for: Athabasca
 Chipewyan First Nation Industry Relations Corporation Fort McMurray, Alberta Mikisew
 Cree First Nation Government and Industry Relations Fort McMurray, Alberta, Project
 #501-06.

Carver, M. 2016. How the Regulatory Regime is Bringing about Declining Water levels in the
 Peace-Athabasca Delta and Degrading the Outstanding Universal Value of Wood Buffalo
 National Park (Prepared by Aqua Environmental Associates) (p. 32). Mikisew Cree First
 Nation.

Courtoreille, K. 2016. Personal communication.

Davidson, D.J. and Hurley, A.M. 2007. Running Out of Steam? Oil Sands Development and Water
 Use in the Athabasca River-Watershed: Science and Market Based Solutions.
 Environmental Research and Studies Centre, University of Alberta and the Munk Centre
 for International Studies, University of Toronto.

Dubé, M.G. and Wilson, J.E. 2013. Accumulated State Assessment of the Peace‐Athabasca‐Slave
River System. Integrated Environmental Assessment and Management, 9, 405–425.

Finnish Environment Institute. 2018. Measurement of the ice-freezing of water bodies. Available
 from https://www.ymparisto.fi/en-US [Accessed September 2020].

 20
Government of Canada. Environment and Climate Change Canada. 2005. Manual of Ice. Available
 from https://www.canada.ca/en/environment-climate-change/services/ice-forecasts-
 observations.html [Accessed May 2021].

Independent Environmental Consultants. 2018. Strategic Environmental Assessment of Wood
 Buffalo National Park World Heritage Site.

Liu, Y., Li, Y., Li, L. and Chen, C. 2019. Spatiotemporal variability of monthly and annual snow
 depths in Xinjiang, China over 1961–2015 and the potential effects, Water, 11, 1666.

Michel, B. 1971. Winter regime of rivers and lakes. Cold Regions Science and Engineering
 Monograph III-Bla, Cold Regions Research and Engineering Laboratory, US Army:
 Hanover, New Hampshire, USA.

MCFN. 2017. Workshop on the development of the SEA with representatives of Mikisew Cree
 First Nation, Independent Environmental Consultants (IEC), and Parks Canada, August
 2017.

MCFN. 2018a. Workshop on the development of the SEA with representatives of Mikisew Cree
 First Nation, Independent Environmental Consultants (IEC), and Parks Canada, February
 2018.

MCFN. 2018b. Workshop on the development of the SEA with representatives of Mikisew Cree
 First Nation, Independent Environmental Consultants (IEC), and Parks Canada, March
 2018.

Peace Athabasca Delta (PAD) Project Group, The. 1972. The Peace Athabasca Delta: A Canadian
 Resource, Summary Report. A report on the low water levels in Lake Athabasca and their
 effects on the Peace-Athabasca Delta. A cooperative intergovernmental study established
 by the Environmental Ministers of Canada, Alberta, and Saskatchewan. Queen’s Printer,
 Province of Alberta, 11510 Kingsway Ave, Edmonton, AB.

Peters, D.L. and Buttle, J.M. 2010. The effects of flow regulation and climatic variability on
 obstructed drainage and reverse flow contribution in a Northern river–lake–Delta complex,
 Mackenzie basin headwaters. River Research and Applications, 26, 1065–1089.

Peterson, M. and Courtorielle, W. 1992. Flood History Study Peace-Athabasca Delta Wood
 Buffalo National Park. Data Report 92-14/WB.

Prowse, T.D. and Conly, F.M. 1998. Effects of climatic variability and flow regulation on ice-jam
 flooding of a northern delta. Hydrological Processes, 12, 1589–1610.

Prowse, T.D. and Conly, F.M. 2002. A review of hydroecological results of the Northern River
 Basins Study, Canada. Part 2. Peace–Athabasca Delta. River Research and Applications,
 18, 447-460.

 21
Prowse, T.D., Beltaos, S., Gardner, J.T., Gibson, J.J., Granger, R.J., Leconte, R., Peters, D.L.,
 Pietroniro, A., Romolo, L.A. and Toth, B. 2006. Climate change, flow regulation and land-
 use effects on the hydrology of the Peace-Athabasca-Slave system; Findings from the
 Northern Rivers Ecosystem Initiative. Environmental Monitoring and Assessment, 113,
 167–197.

Stefan, J. 1891. Über die Theorie der Eisbildung, insbesondere über die Eisbildung im Polarmee.
 Annals of Physics and Chemistry, 42, 269–286.

Ward, E.M. and Gorelick, S.M. 2018. Drying drives decline in muskrat population in the Peace-
 Athabasca Delta, Canada. Environmental Research Letters, 13, 124026.

Wrona, F.J., Gummer, W.D., Cash, K.J. and Crutchfield, K. 1996. Northern River Basins Study
 synthesis report no. 11 Cumulative impacts within the northern river basins. Northern
 River Basins Study Edmonton, Alberta, May, 1996.

 22
You can also read