A fair chance for all - Breaking the disadvantage cycle Scoping the Terms of Reference for an inquiry
←
→
Page content transcription
If your browser does not render page correctly, please read the page content below

1   New Zealand firms: Reaching for the frontier

    A fair chance for all
    Breaking the disadvantage cycle
    Scoping the Terms of Reference for an inquiry
    19 July 2021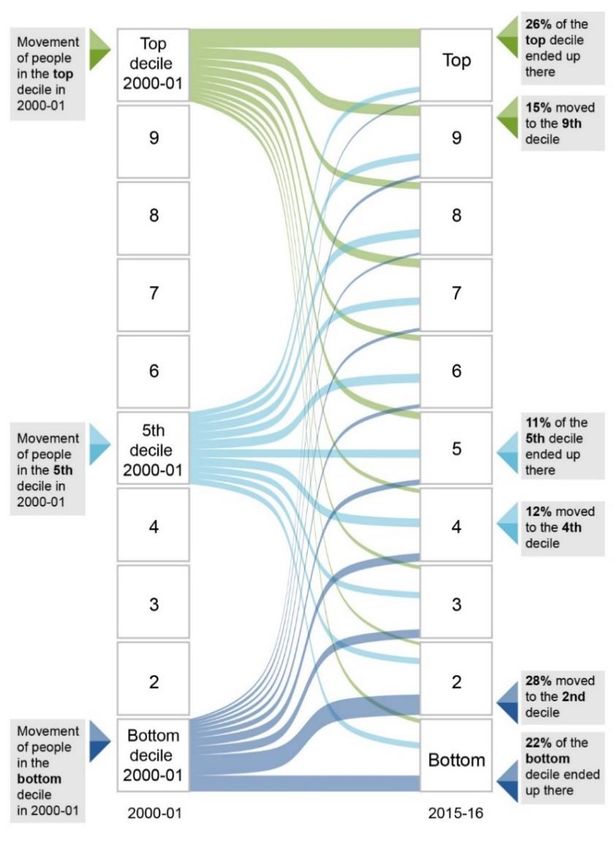
The New Zealand Productivity Commission
Te Kōmihana Whai Hua o Aotearoa1

The Commission – an independent Crown Entity – completes in-depth inquiry reports on topics selected by the
Government, carries out productivity-related research, and promotes understanding of productivity issues. The
Commission aims to provide insightful, well-informed and accessible advice that leads to the best possible
improvement in the wellbeing of New Zealanders. The New Zealand Productivity Commission Act 2010 guides
and binds the Commission. You can find information on the Commission at www.productivity.govt.nz or by calling
+64 4 903 5150.
How to cite this document: New Zealand Productivity Commission (2021) A fair chance for all: Breaking the
disadvantage cycle. Scoping the Terms of Reference for an inquiry. Available from www.productivity.govt.nz

Date: 19 July 2021

ISBN: 978-1-98-851968-5 (online)
Copyright: This copyright work is licensed under the Creative Commons Attribution 4.0 International License. In
essence you are free to copy, distribute and adapt the work, as long as you attribute the source of the work to the
New Zealand Productivity Commission (the Commission) and abide by the other license terms. To view a copy of
this license, visit www.creativecommons.org/licenses/by/4.0/. Please note that this license does not apply to any
logos, emblems, and/or trademarks that may be placed on the Commission’s website or publications. Those
specific items may not be reused without express permission.

Inquiry contacts
Administration          T: (04) 903 5167                              Website www.productivity.govt.nz
                        E: info@productivity.govt.nz
                                                                      Twitter @nzprocom
Other matters           Jo Smith
                        Inquiry Director (Acting)                     Linkedin NZ Productivity Commission
                        T: (04) 903 5168
                        E: jo.smith@productivity.govt.nz

     Disclaimer
     The contents of this report must not be construed as legal advice. The Commission does not accept any
     responsibility or liability for an action taken as a result of reading, or reliance placed because of having read
     any part, or all, of the information in this report. The Commission does not accept any responsibility or
     liability for any error, inadequacy, deficiency, flaw in or omission from this report.

1
    The Commission that pursues abundance for New Zealand.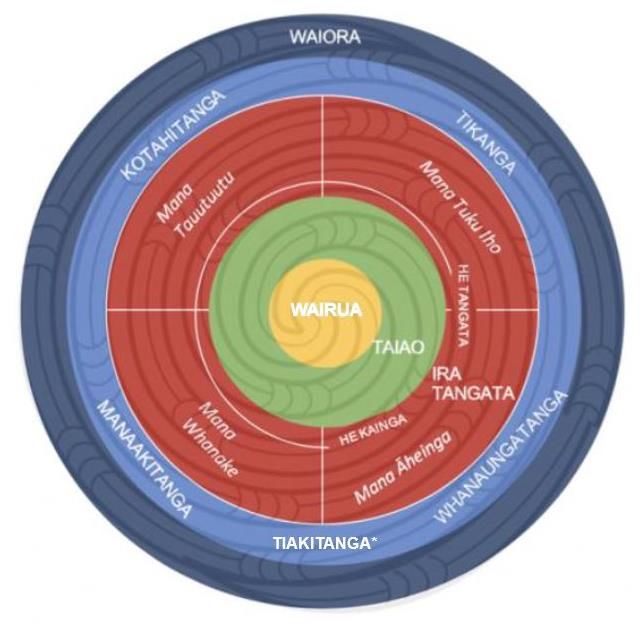
1 A fair chance for all: Breaking the disadvantage cycle
1 About this inquiry
Purpose of this paper
The Government has asked the New Zealand Productivity Commission to prepare the Terms of
Reference (ToR) for a new inquiry into breaking the cycle of persistent disadvantage.
We at the Productivity Commission recognise that persistent disadvantage is a big problem. A lot
of people are working hard on finding solutions, both in government and communities. We want
our inquiry to add value, and not duplicate existing efforts. That is why we want your feedback on
where we should focus this inquiry.
This paper aims to get your feedback to help shape the ToR. It is not the inquiry itself. The
consultative process of developing the ToR signals a significant innovation in how Commission is
approaching this inquiry, compared to its previous inquiries.
The paper briefly maps out what we mean by persistent disadvantage and what we currently
know about the topic in New Zealand. It does not aim to be a comprehensive or detailed
summary of the evidence. The paper then moves to what we don’t know, distinguishing between
areas of possible research and areas where there simply aren’t the data to analyse. It finishes with
questions about where the Commission’s work could most usefully focus in this inquiry.
Cabinet will consider the proposed ToR around November 2021. Subject to receiving Cabinet
approval in November, the Commission will spend 12 months on the inquiry and report back to
Government with findings and recommendations by November 2022.
How you can provide your feedback
The Commission is seeking views on the proposed scope and focus of the inquiry, to inform the
development of the ToR. We welcome responses to the questions in Section 5 of this paper by
27 August 2021. You can respond to the questions directly via the form on our website
(www.productivity.govt.nz/inquiries/a-fair-start-for-all) or by uploading a document
(www.productivity.govt.nz/have-your-say/make-a-submission). The Commission is also looking to
meet with a range of stakeholder groups.
A summary of feedback received through this process will be published on our website after the
ToR is approved. There will be further opportunities to engage once the inquiry commences.
How the Commission can best add value
The Commission believes it can add value through undertaking this inquiry in several ways:
the capability and mandate to undertake systems-level analysis of policy options – looking
across policy silos to assess the effectiveness of current policy settings;
quantitative and qualitative research to generate new insights;
linking wellbeing and productivity – exploring how reducing persistent disadvantage
translates into better economic performance as well as direct increases in wellbeing; and
informing the public debate – bringing a clear and accessible narrative about what we already
know and what we’ve learnt through the inquiry.2 | What do we mean by persistent disadvantage? 2
2 What do we mean by
persistent disadvantage?
This section sets out how the Commission is proposing to define persistent disadvantage. In
developed societies not all aspects of disadvantage are absolute, some are relative. This means
that in some ways, disadvantage is linked to the concept of inequality. Society cannot guarantee
equality of outcomes for people, as these are partly dependent on people’s choices and innate
characteristics (eg, personality). Instead, the goal is equality of opportunity, by helping people
access the resources and capabilities they need to thrive.
What is “disadvantage?”
Disadvantage is complex and multi-dimensional. Different frameworks exist for thinking about
and defining persistent disadvantage. An alternative approach is to apply a framework that
describes an end state of wellbeing. Comparing this to the current state allows us to identify the
size and nature of the shift that must be achieved. For this inquiry, we propose drawing on He Ara
Waiora, which is a waiora framework built on te ao Māori knowledge and perspectives of
wellbeing. While it is a Māori framework, it is based on evidence about wellbeing that applies to
everyone.
He Ara Waiora
He Ara Waiora presents a holistic, intergenerational approach to wellbeing. It centres on the key
concept of Wairua (spirit) as the foundation or source of wellbeing. We suggest that non-Māori
can also relate to the idea that an individual or group of people have an overall and essential
sense of their wellbeing, which is affected by life events and other factors.3 A fair chance for all: Breaking the disadvantage cycle
When framing a discussion about persistent disadvantage, and the pathway out of it, it is useful
to focus on the Te Ira Tangata (the human domain) which sets out the four mana that people
(tangata) and collectives2 (kainga) need to thrive. One of the key concepts here is that people and
collectives have mana (power, authority or agency). People thrive when they have the resources
they need, are empowered to grow and develop, and can connect with others. Individuals are
shaped by their social experiences and circumstances, and their culture.
He Ara Waiora includes four aspects of mana. In our view, each of these is relevant in helping
people to thrive.
1. A strong sense of identity and belonging (mana tuku iho). This factor is essential, particularly
for children to develop good mental health, resilience and emotional intelligence (so-called
“soft” skills) which are in turn integral to wellbeing throughout life.
2. People’s participation and connection within their communities, including fulfilment of their
rights and obligations (mana tautuutu). This includes both social and economic participation,
such as paid or unpaid employment, and membership of clubs and societies. The strength of
relationships and personal safety/absence of crime is fundamental to wellbeing for people
and collectives. Lack of participation and connection leads to social exclusion. People can
feel excluded if they cannot participate in the same activities as those around them (so is a
relative concept).
3. The capability to decide on their aspirations and realise them in the context of their own
circumstances (mana āheinga) – this is closely related to Amartya Sen’s concept of
“freedom”. Having the basic resources that are essential to create opportunities is known as
material wellbeing. It includes resources like quality housing, transport, healthcare and
education. A lack of these basic resources for an acceptable standard of living is known as
material hardship. This is an absolute measure, although even here what is considered
“essential” in contemporary Aotearoa is relative (for example, digital inclusion was not an
issue in the 1980s, but is today). Some people may need more resources than others to
realise their aspirations, because they have different abilities to convert those resources into
opportunities (eg, those with disabilities).
4. The power to grow sustainable, intergenerational prosperity (mana whanake) – this includes
but is not restricted to financial resources including income and wealth. A lack of financial
resources is poverty, although most measures focus on income poverty. There are a variety of
definitions of income poverty, but in developed societies all of these definitions are relative
to the average level of incomes.
These four factors are fundamental to people or collectives having the opportunity to thrive at
every other level, giving them the best chance to feel included in the economy and society. If any
one of these factors is missing, people or collectives can experience damage to their wairua. This
is similar to the western concept of disadvantage; people not having access to what is needed to
achieve their aspirations. It is important to note that this is a holistic approach and there are other
ways to enhance or damage wairua including means (how we live) and Te Taiao (the natural
world).
The impacts of disadvantage can have complex, dynamic and interactive effects. People and
collectives trapped in persistent disadvantage often experience multiple, inter-related challenges
2
Collectives include families, whānau, hapū, iwi and communities.2 | What do we mean by persistent disadvantage? 4 (eg, unemployment, insecure and poor-quality housing, chronic illness, family violence, drug or alcohol dependence), which have a cumulative impact on their life opportunities, and overall wellbeing. The cumulative impact of multiple disadvantages makes it even harder to overcome these challenges. The Commission is proposing that the inquiry focuses on deep disadvantage – where people or collectives are experiencing multiple facets of disadvantage across one or more mana. What is “persistent” disadvantage? It is fairly common for people to experience temporary disadvantage at some point in their lifetime – where they are lacking one or more of the factors needed to thrive for a short period. In many cases people and collectives can cope with temporary disadvantage, particularly if they have access to the other factors they need to thrive. For example, about half of all individuals experience a period of income poverty at some point (Carter & Gunasekara, 2012). Many of these people don’t suffer from material hardship because they have access to resources from their wealth or their family and social networks. It is far more concerning when people and collectives remain trapped in persistent disadvantage. The persistent loss of one factor necessary to thrive can erode other factors, trapping people and collectives in a cycle of disadvantage. For example, if people or collectives are without paid employment for a long time, it becomes harder to afford suitable housing, which can impact on the health of the collective, and as a result impact their ability to find work in the future. The Commission proposes focusing on those who are stuck in persistent disadvantage over many years or even their lifetime. People may become stuck in disadvantage at some point during their life, perhaps due to life events such as job loss or illness (life course) or because they are born into disadvantaged circumstances (intergenerational). The Commission proposes investigating both of these routes in to (and out of) persistent disadvantage (ie, both life course and intergenerational mobility). Whenever people or collectives don’t thrive all of society loses out. On a simple financial level, the costs to government rise through lower tax revenues and higher welfare costs. The impact of lost productivity from working age people is even greater, especially at a time where the nation faces an ageing population (and increasing economic dependence on its working age population). There can also be wider negative impacts, such as increased crime and victimisation. Children in particular are affected by persistent disadvantage. Early influences (both during pregnancy and children’s first 1 000 days) have a significant impact on their ability to thrive throughout their life. Subsequent life experiences and events also play an important role but it is hard to make up for early disadvantage. This demonstrates the importance of looking through the lens of collective wellbeing which He Ara Wairoa allows. For example, without the time to develop a strong loving bond with a parent, the development of children’s emotional intelligence, health and ability to learn will likely suffer. Even if a disadvantaged child works hard and makes the best possible choices, they are less likely to have as good outcomes as a child from a less disadvantaged background. To give these children the same life opportunities will take far greater resource than for those from less disadvantaged backgrounds.
5 A fair chance for all: Breaking the disadvantage cycle
3 What we know already
Information on persistent disadvantage is patchy
As yet. there are no formal measures established to track trends in the four mana set out in
Section 2. However, the work of Stats NZ, the Ministry of Social Development and the Office of
Children’s Commissioner can give some insight. More recently the Government passed the Child
Poverty Reduction Act 2018, and in 2019 published a Child and Youth Wellbeing Strategy. These
initiatives mandate more relevant reporting.
Despite this work, there is no clear picture of who faces persistent disadvantage. There are five
main methodological challenges.
The unit of analysis varies. For some, disadvantage occurs at an individual level, for others it
may be the household unit, wider whānau unit, or even their community. Current data cannot
capture this richness.
Not all the four mana have clear, agreed definitions yet, but some initial work has mapped
the facets of each mana against existing measures (McMeeking, 2019). There are various
definitions of income poverty and material hardship (the lack of certain “essentials” needed
to participate in modern society). However, there is no clear line below which a sense of
identity is considered “insufficient”. Instead, there is a spectrum, and strengths in some mana
can buffer against weaknesses in others.
Information comes from different surveys, so there are data on how people rate in each of the
four mana but there are not data on how the different mana interact. For example, a person
might have low income but a strong sense of identity and strong whānau connections, and so
not consider themselves disadvantaged overall.
The same people are not surveyed over time, so there is no information on how persistent
disadvantage is (ie, we lack longitudinal data). This makes it difficult to know which people
move out of disadvantage versus those that remain stuck, and why.
To meet the requirements of the Child Poverty Reduction Act, Stats NZ is making changes to the
way it collects some information on disadvantage. The Living in Aotearoa survey will run a
rotating six-year panel, giving some information on the persistence of income poverty and
material hardship. First results will be reported in 2025.
New Zealand historical context
This section describes some broad trends on persistent disadvantage for New Zealand. It mostly
focuses on income because that is where the best data exist. This section does not aim to
provide a comprehensive picture of the evidence. As part of this inquiry, the Commission will
produce a summary of the evidence and welcomes input on what issues to include in that
narrative.
Colonisation dislocated Māori
From the second part of the 19th century, including the New Zealand Wars and continuing into
the 20th century, Māori were systematically dispossessed of their land and other resources, and3 | What we know already 6 suffered significant losses to their population, language, culture, authority, wealth and wellbeing. This loss of resources has led to intergenerational cycles of disadvantage for many whānau. Past governments have been unable to break these cycles, in part because services have been designed and delivered from a western perspective. Poverty and inequality rose sharply in the late 80s and early 90s Most of the historical data we have is on incomes. The big shift in income inequality happened in the reform period of the late 1980s and early 1990s. During this period, those on the lowest incomes saw their incomes fall (especially through higher unemployment, benefit cuts and downward pressure on wages) while higher incomes held stable. Poverty and child poverty rates also increased, although by how much depends on the measure (as median incomes also fell during this period). Since then, income growth has been relatively evenly spread Since the mid-1990s, income growth in New Zealand appears to have been relatively evenly spread (Perry, 2019). As a result of this, the level of income inequality and poverty has persisted at the level reached in the 1990s. This sets the recent New Zealand experience apart Much of the public debate around trends in disadvantage draws on the experience from overseas, particularly the United States and the United Kingdom. In the United States incomes of middle-class families have stagnated while those at the top continue to grow. The United Kingdom has faced a similar trend, though not as stark. As discussed above, since the mid-1990s the New Zealand experience has differed in some ways from the United States and United Kingdom. This highlights the need to develop a clear, cohesive narrative about inequality and persistent disadvantage in New Zealand, distinct from those overseas. New Zealand is an outlier when it comes to housing The major caveat to this story on poverty and inequality is the cost of housing. When housing costs are taken into account, poverty levels have continued to creep up in recent decades. The numbers of working age households spending more than 30% of their income on housing (the level that is generally considered “affordable”) has trebled since the late 1980s. The impact has been the most stark for those on low incomes, living alone and in private rentals (Perry, 2019). New Zealand today As noted above there are no official measures for He Ara Wairoa as yet. Work is underway to identify the best existing sources of data and what new indicators and measures may be required. It is worth noting this framework is strengths-based, while most data we have is on the absence of those strengths (ie, deficits). This section pieces together some of what we know based on existing data. Mana tuku iho (identity and belonging) More than one in 14 people suffer psychological distress in a given four-week period. This figure is much higher for Māori, at one in seven. Rates of loneliness are higher for sole parents, people not in the labour force for health reasons and recent migrants (New Zealand Government, 2021). Perhaps the most extreme measure of a lack of identity and belonging is suicide. In New Zealand suicide rates are below the OECD average for most groups (OECD Better Life Initiative, 2020a).
7   A fair chance for all: Breaking the disadvantage cycle

    But one group that stands out is young people. New Zealand’s youth suicide rate is the second
    worst in the OECD at 14.9 deaths per 100 000 adolescents (UNICEF Innocenti, 2020). Māori youth
    are particularly at risk.

    Mana tautuutu (rights, obligations and participation in strong
    communities)
    Over 5% of people report they have no friends or relatives they can count on in times of trouble.
    This is lower than the OECD average (8.6%) (OECD Better Life Initiative, 2020b). Māori, Pasifika,
    females, sole parents and the unemployed all report they are more likely to suffer discrimination
    (New Zealand Government, 2021).

    New Zealand has the highest rates of volunteering in the OECD, with almost a third of the
    working age population volunteering at least once a month. The country is also regularly among
    the countries with the lowest rates of perceived corruption. Trust in the police and government is
    relatively high, with New Zealand ranking in the top quarter of OECD countries (OECD Better Life
    Initiative, 2020a).

    Mana āheinga (opportunity and capability)
    Material wellbeing statistics track whether people have access to the basics needed to
    participate in society, such as adequate food and clothing, warm housing and the ability to pay
    unexpected bills. Based on the latest statistics around 7.5% of people live in households facing
    material hardship (Stats NZ, 2021a).

    Around 11% of households with children aged 0-17 face material hardship (Stats NZ, 2021b). This
    is close to the EU average, but significantly higher than Nordic countries (4-6%) (Perry, 2019).
    Rates are higher for Māori (20%), Pasifika (26%), and children living in a household with a disability
    present (20%). Historically, rates have also been high in households with a sole parent or jobless
    parents.

    Rates of material hardship are higher for households with younger people because they are less
    likely to own their own home. As noted, housing is a major driver of rising disadvantage in New
    Zealand. This is particularly the case among younger age groups. Average housing costs are
    25.9% of income, the highest in the OECD. This is despite housing in New Zealand often being of
    poor quality (OECD Better Life Initiative, 2020b).

    New Zealand’s rates relatively well on education and health, but these averages gloss over some
    large pockets of disadvantage. New Zealand has some of the largest variations in achievement in
    reading and science associated with disadvantage compared with other countries (May et al.,
    2019). The Ministry of Education’s work on the Equity Index shows that some socio-economic
    indicators are strongly correlated with education performance. On average Māori live more than
    seven years less than non-Māori. UNICEF (2020) ranked New Zealand 35th out of 41 rich countries
    for child wellbeing. The rankings were particularly low for mental health and physical health, due
    to high rates of suicide and obesity.

    In all, opportunity is the domain where New Zealand rates most poorly compared with other
    nations. High housing costs increase the pressure on households, especially those with lower
    incomes. Some children growing up in persistent disadvantage are not getting the health and
    education they need to thrive. This may limit their lifetime potential, contributing to their
    persistent disadvantage. The system is failing the most disadvantaged families and communities.
3 | What we know already 8 Mana whanake (income, wealth and sustainable growth) New Zealand’s poverty and inequality rates are around the middle of international rankings, slightly above the average for OECD countries. Incomes are below average, despite working hours being above average. The main issue here is New Zealand’s poor productivity record, which may be in part due to people not being able to reach their potential. New Zealand’s tax and welfare system is less redistributive than many other OECD countries (though this assessment doesn’t include the impact of in-kind transfers such as health and education). New Zealand has higher rates of poverty among households without work, although this may change with recent benefit increases. Wairua (holistic wellbeing vs persistent disadvantage) As noted earlier, wairua is at the centre of this model of wellbeing. This means that achieving holistic wellbeing requires strength or resilience in each of the other aspects of the model. The antithesis of this is the persistent disadvantage that we aim to investigate through the inquiry. On average, New Zealanders rate their satisfaction with their own lives 8 out of 10 (Stats NZ, 2021c). This is a measure of “self-reported subjective wellbeing” and is higher than the OECD average (OECD Better Life Initiative, 2020b). The groups that rate their lives the lowest are sole parents, the unemployed, and those not in the labour force due to injury, sickness or disability. For working-age people, life satisfaction appears to be closely tied to employment, probably because it offers income and a sense of purpose (which is linked to mana tuku iho – identity). However, a sense of purpose doesn’t necessarily need to be tied to paid employment. Overall, employment is relatively high (and unemployment low) in New Zealand. But just over 13% of young people (aged 15-24) are not in education, employment or training. There isn’t much information about who faces persistent disadvantage across one or more mana. As an indicator, according to the latest statistics (2019-20) up to 28% of children are in households facing income poverty (after housing costs) and 11% face material hardship. About 7% (around 75 000) children are in households facing both income poverty and material hardship (Stats NZ, 2021b). These data illustrate there are many different groups facing different types of disadvantage, as well as groups facing multiple disadvantages. These statistics are based on static (ie, point-in-time) measures of poverty. Due to the lack of data that surveys the same people and households over time, little is known about how much disadvantage persists in New Zealand. We know that some of those experiencing low incomes at any one time will move out of that situation over time (eg, students that go on to have high earnings after study). As would be expected, local and overseas evidence has shown that estimates of poverty and inequality are lower when it is based on longer time frames. Previous New Zealand studies illustrate this point, although their data are now over a decade old. About one in four respondents lived in households with low incomes (less than 60% of the median), while 13% faced material hardship (9% were in both groups). When tracking people over time (ie, longitudinally from 2002-09), those numbers were 15-20% lower, with 21% being on “chronic” low incomes, and 11% in chronic material hardship (about 7% were in both groups). Disadvantage rates were higher for Māori and households with children (Carter & Gunasekara, 2012).
9 A fair chance for all: Breaking the disadvantage cycle
4 What we don’t know
Some research isn’t possible because the data don’t exist
As noted above, there are some gaps in the understanding of disadvantage. Some gaps are
currently in the process of being filled with Living in Aotearoa (the new Stats NZ rotating
longitudinal panel survey). This work will create a richer picture of how many people are in
persistent disadvantage. Knowledge gained from this study will be a big step forward. However,
this data source is not strictly longitudinal (because the people on the panel will each rotate out
after six years). It will also take some years for these data to be processed and become readily
accessible.
Even data that are collected relatively regularly take time to be made publicly available. Covid-19
has exacerbated this process even further, with Stats NZ reporting disruptions to data collection
due to lockdowns. The full impact of this disruption to the national data collection efforts won’t
be understood for some time. For the inquiry, the Commission will do its best to use leading
indicators to give an up-to-date picture. It will also draw on qualitative information gleaned
through research and engagement, to shed light on the current realities for people and their
communities.
There are also gaps in existing data used to measure wellbeing. While there are a range of
frameworks for measuring wellbeing, such as the Living Standards Framework and the Child and
Youth Wellbeing Strategy, we do not have measures or data to fully capture some elements of
wellbeing. As part of the consultation to develop the ToR for this inquiry, the Commission is
interested to hear from different groups about what outcomes they want for their tamariki,
whānau and communities, and in particular what they see as the main benefits from reducing
persistent disadvantage (see Section 5).
There are clear gaps in our knowledge this inquiry could help fill
Some aspects of the research agenda for this inquiry are clear.
As noted in Section 3 above, some of the public narrative on disadvantage, poverty and
inequality over the past two decades has been imported from overseas. A need exists for a
clear, coherent and accessible summary of the trends, and whether they are peculiar to New
Zealand or consistent with international experience. This narrative will consider the links
between reducing persistent disadvantage and higher productivity, economic performance
and wellbeing.
Quantitative research to describe who gets trapped in persistent disadvantage in
New Zealand, compared to who exits. Different approaches are possible, including studying
how disadvantage changes over a person’s lifetime or is transmitted between generations.
These are explored in the next section.
Qualitative research to get a better understanding of the lived experience of people, whānau
and communities facing persistent disadvantage, and what they find works or would work to
help them move out.4 | What we don’t know 10
Assessing what works to reduce life-course and intergenerational disadvantage – bringing
together what’s known about the range of possible policies, programmes and interventions
and evidence of their effectiveness in the New Zealand context (drawing on evaluations and
other studies that have been done, as well as qualitative input from experts, practitioners, and
communities).
The Commission aims for its qualitative and quantitative work to be complementary so that the
insights from each inform the other. It will synthesise the findings of this work with the existing
evidence base, to develop policy recommendations.
The following sections explore in more detail what each of these research streams could include.
Not all of these projects will be possible given limited resources. The Commission welcomes
feedback on the most important areas, which should be included in the ToR (Section 5).
Options for research with longitudinal data
As noted, the evidence base has clear gaps and requires more quantitative research on who is
stuck in persistent disadvantage (both how many people and their characteristics; as well as the
characteristics of those who move out of disadvantage). There is a critical gap in terms of
“longitudinal” data which tracks people or households over time. New Zealand has no
consistently mandated longitudinal studies that are conducted by Stats NZ, so each of the three
options below have their strengths and weaknesses based on the data available:
The Integrated Data Infrastructure (IDI) brings together data on individuals from across
government and other organisations. These data are primarily administrative data, such as
Inland Revenue information and health records, but also link in survey data such as the
Census and, for those selected to participate, the Household Labour Force Survey (HLFS) and
General Social Survey (among others). In this way, the IDI is a unique resource. It can track
things at the population level that the government measures for administrative purposes,
such as income and taxes, across time. And it merges that information with more in-depth
survey information, such as material hardship, at a point-in-time for a subsample of the
population that is included in national surveys. It is possible to use these data to track
patterns of disadvantage across the lifetime of individuals. This approach would provide a
large and robust set of data but would struggle to provide insights on households or families
(upon which New Zealand’s welfare system is based).
The HLFS samples 15 000 households every three months over two years. These data on
households could be matched with the IDI to allow for a more accurate estimate of
family/household income. This would provide estimates of changes in household incomes
similar to those in the Australian Productivity Commission (APC) chart (see Box 2 below), as
well as describe who escapes periods of disadvantage and who ends up trapped in persistent
disadvantage. A downside is that the size of the sample means examining some subgroups
may lack statistical power.
Even when use of the HLFS enables families/households to be identified, measuring
intergenerational mobility could still prove difficult as families and households change over
time. A true longitudinal data set is needed for this. The Dunedin Multidisciplinary Health &
Development Study and Christchurch Health and Development Study both follow adults born
before the reforms of the 1980s and 1990s. The Growing Up in New Zealand (GUiNZ) Study is
more recent and reflects the diversity of the New Zealand population, including Māori and
Pacific families. Although the children followed are not yet adults, the data are rich and could11 A fair chance for all: Breaking the disadvantage cycle
tell us more holistically than the IDI what factors most advantage and disadvantage children
over time.
Another option for investigating intergenerational mobility would be to use the IDI to track
the children that are now adults but were in families included in the longitudinal Survey of
Family, Income and Employment (SoFIE) that ran from 2002-2010. This data set is not as rich
as GUiNZ in terms of information on family process or child development, but some of the
children will now be in the workforce so their outcomes will be observable.
Additional research is possible with other data
There are many quantitative research projects that are possible with existing data. A few of the
most promising possible projects are listed below. The Commission is interested in your views of
which projects should be a priority for this inquiry:
What are the fiscal benefits to disrupting the persistence of disadvantage? For example,
reduced tax revenue and increased welfare, health and justice/corrections costs, over
people’s lifetimes. This would give some idea of the size of the problem, and the fiscal
benefits from reducing persistent disadvantage. It might be possible to extend this analysis to
wider economic costs for some aspects – for example the impact of lower skill levels on
productivity and national income, as well the social costs of crime.
Exploring how particular life events and experiences, and the cumulative impact of multiple
events, can trigger disadvantage (eg, major or chronic illness, injury or disability, redundancy,
being a victim of violence/crime or other trauma), that persists.
Take-up of entitlements – the welfare system is complex and previous studies in New Zealand
and overseas have shown that not everyone gets their entitlements. Better information on
uptake may help identify some of the barriers faced by people suffering persistent
disadvantage.
Qualitative research and “what works”
The Commission will enrich the quantitative analysis with qualitative research about people’s and
collectives’ lived experience of persistent disadvantage. This will help provide insights into the
underlying drivers and determinants of persistent disadvantage, and how to tackle them. We will
marry this with the evidence on what works, for whom and under what conditions. This will
include drawing together the existing analysis and findings behind other major reviews and
inquiries such as the Welfare Expert Advisory Group, as well as evaluations and other studies.
The Commission’s added value here is investigating systemic issues across funding streams and
delivery silos (rather than at the level of individual programmes and policies). This includes
identifying structural or institutional barriers, as well as gaps or deficiencies in current policy
settings or the way government services are delivered. Given the multifaceted nature of
persistent disadvantage, we expect to draw on frameworks and expertise across a range of
disciplines, to tease out the causal factors, and understand how government can influence them.
We may do “deep dives” into particular topics where there is potential to help shift the dial on
reducing persistent disadvantage. The areas for work would be partly guided by what is revealed
in the data, but we also welcome feedback on where to focus our investigations for maximum
impact. Potential areas of focus are:4 | What we don’t know 12
The cost of housing is relatively high and is clearly driving rising poverty. The Commission has
already done a lot of work in this area (focusing on housing supply) but it could be brought
together along with additional recommendations focused on reducing persistent
disadvantage.
Mental health (and related issues such as addictions) are strongly related to wellbeing.
Early childhood and primary education are possible ladders out of the intergenerational cycle
of disadvantage, but the New Zealand education system is not achieving the same potential
seen in some overseas countries.
Families with working parents tend to have far better outcomes than those without work.
Interventions to support pregnancy, parenting and childcare can also be effective, although
there can be trade-offs between what is best for the child and what is best for the labour
market outcomes of the parents.13 A fair chance for all: Breaking the disadvantage cycle
Box 1 Australian Productivity Commission on life-course mobility
Research by the Australian Productivity Commission showed significant “stickiness” in both
the top and bottom income deciles. Figure 4-1 illustrates life-course mobility across the
income distribution in Australia, between 2000-01 and 2015-16. Around half of the people in
the bottom decile are still there (or in the 2nd bottom decile) 15 years later. Similarly, 40% of
those in the top decile were still there (or in the 2nd highest decile) 15 years later.
The APC study found that those who experience entrenched economic disadvantage (which
was defined as being stuck in one of the two bottom deciles) are more likely to be in single-
parent families, unemployed, people with disabilities, and Indigenous Australians. Children
living in jobless households are at particular risk. The study also found a small and sustained
rise in deep social exclusion after 2012.
Figure 4-1 Life-course mobility in Australia
Proportion of people in the top, 5th and bottom income deciles in 2000-01, by income decile in 2015-16
Source: Australian Productivity Commission (2018) p. 97. Analysis used data from the Household, Income
and Labour Dynamics in Australia (HILDA). Highlighting added to chart.4 | What we don’t know 14
5 Where should the
Commission focus?
The Commission is seeking feedback from you on where you think this inquiry should focus.
Persistent disadvantage is a complex, multi-faceted issue. While we will want to cover all relevant
aspects of the issue to some degree, we will inevitably need to prioritise our efforts so as to add
the most value and avoid duplication of existing effort.
We welcome responses to the following questions by 27 August 2021. You can respond directly
via the form on our website (www.productivity.govt.nz/inquiries/a-fair-start-for-all) or by
uploading a document (www.productivity.govt.nz/have-your-say/make-a-submission). We look
forward to your feedback.
1. What are the main dimensions of persistent disadvantage that should be included in the
Terms of Reference as areas to be investigated? For example, because they have a stronger
direct impact on wellbeing, or because they have a knock-on impact in relation to other
dimensions.
2. Where should the Commission focus its research effort?
What do you see as the biggest gaps in our collective knowledge?
What areas would you encourage us to undertake further research into, and why?
3. Where should government focus its effort on finding solutions?
What are the key barriers preventing New Zealanders from reaching their potential?
What are the key triggers or circumstances that can result in people becoming stuck in
persistent disadvantage?
Are there key windows of opportunity in a person’s life course where positive changes are
easier to secure, or where they are more likely to endure?
Which aspects of government policy are most important to focus on? For example, secure
housing, mental health treatment and supporting new parents.
Are changes needed in the ways that government services are provided? For example,
devolving responsibility for services, joining up service provision and helping those most in
need navigate the system.
4. Is there anything else that you would like to see in the Terms of Reference for this inquiry?15 A fair chance for all: Breaking the disadvantage cycle
References
Australian Productivity Commission. (2018). Rising inequality? A stocktake of the evidence.
Australian Productivity Commission. https://www.pc.gov.au/research/completed/rising-inequality
Carter, K., & Gunasekara, F. (2012). Dynamics of Income and Deprivation in New Zealand, 2002‐
2009: A descriptive analysis of the Survey of Family, Income and Employment (SoFIE). University
of Otago Public Health Monograph Series, 24.
McMeeking, S. (2019). He Ara Wairoa: Background paper on the development and content of He
Ara Wairoa. University of Canterbury.
https://ir.canterbury.ac.nz/bitstream/handle/10092/17576/FNL%20%20He%20Ara%20Waiora%20
Background%20Paper.pdf?sequence=2&isAllowed=y
New Zealand Government. (2021). Wellbeing budget 2021: Securing our recovery. New Zealand
Government. https://www.treasury.govt.nz/sites/default/files/2021-05/b21-wellbeing-budget.pdf
OECD Better Life Initiative. (2020a). How’s life? 2020: Measuring wellbeing. OECD.
https://doi.org/10.1787/9870c393-en
OECD Better Life Initiative. (2020b). How’s life in New Zealand? OECD.
https://www.oecd.org/statistics/Better-Life-Initiative-country-note-New-Zealand.pdf
Stats NZ. (2021a). Household income and housing-cost statistics: Year ended June 2020 –
corrected. Stats NZ. https://www.stats.govt.nz/information-releases/household-income-and-
housing-cost-statistics-year-ended-june-2020
Stats NZ. (2021b, February 22). Child poverty statistics: Year ended June 2020 – corrected.
https://www.stats.govt.nz/information-releases/child-poverty-statistics-year-ended-june-2020
Stats NZ. (2021c). Wellbeing statistics: March 2021 quarter. Stats NZ.
https://www.stats.govt.nz/information-releases/wellbeing-statistics-march-2021-quarter
UNICEF Innocenti. (2020). Worlds of influence: Understanding what shapes child well-being in
rich countries (No. 16; Innocenti Report Card).
https://assets.ctfassets.net/7khjx3c731kq/lYSqwHAIX4yN7gOIpnueS/c9c1005642c66e69c54b93a0
5cc3bdc0/Report-Card-16-Worlds-of-Influence-child-wellbeing.pdfYou can also read