ACCESSIBLE RETAIL: DEFINING THE EMPLOYMENT VALUE OF THE SECTOR - An evaluation of the employment value of the accessible retail sector
←
→
Page content transcription
If your browser does not render page correctly, please read the page content below

ACCESSIBLE RETAIL: DEFINING THE EMPLOYMENT
VALUE OF THE SECTOR

An evaluation of the employment value of the accessible retail
sector

Prepared on behalf of Accessible Retail

October 2015

CBRE
Henrietta House
London
W1G 0NB
CONTENTS
       Executive Summary .................................................................... 3!
1.! Introduction ................................................................ ………….. 4
2.! Defining the scope of the out-of-town retail sector ......................... 5!
3.! Calculating Employment Numbers ............................................. 10!
4.! Results and Findings ................................................................. 15
5.! Pure Play ................................................................................. 16!

!

.

                                                                                                      !

Accessible Retail: Defining the employment value of the Accessible Retail Sector
CBRE
Executive Summary
EXECUTIVE SUMMARY
This report aims to quantify the number of people employed in the
accessible retail sector. CBRE have done this by splitting the research
into pre-retail jobs i.e. planning and construction, retail jobs when
the parks are fully operational, head office and operations jobs for
occupiers and landlords, and professional jobs within third party
organisations.
•! CBRE have undertaken research which indicates that on a
typical working day, the out-of-town retail sector directly
employs almost 725,000 people.
•! It is estimated that this number increases at seasonal peaks
throughout the year, reaching around 800,000 people at the
peak before Christmas.
•! This compares to the Big Four banks, which employ only
597,300 people in total worldwide.
•! If a multiplier effect were applied to account for those whose
jobs are related to, but aren’t directly dependent on, out-of-
town retail, this number would significantly increase.
Page 3
•! The industry employs people in a wide range of employment
types, catering to people of all skill levels, from manual
EXECUTIVE SUMMARY
employment in construction and fit-out, in retail, maintenance
and cleaning positions within the retail parks, as well as
white collar jobs in occupier and landlord head offices and
third party professional service firms.
•! Unlike many other sectors, such as financial services,
employment opportunities are offered throughout the UK.
This is particularly important where retailer and landlord
head offices and professional service firms are located within
peripheral towns that traditionally depend on heavy
industry.
•! Key out-of-town players offer apprenticeships and training
schemes in roles such as hospitality, management,
engineering and joinery, allowing people unable to
complete higher education to work towards professional
qualifications.
•! CBRE have calculated that Pure Play retail directly employs
61,000 people. This equates to one person for £693,000 of
revenue – much lower than out-of-town which employs one
person for £1.8 million of revenue.
•! As the sector continues to flourish, accessible retail will
become an increasingly important source of employment in
!
Accessible Retail: Defining the employment value of the Accessible Retail SectorCBRE
the UK and make a greater contribution to the country’s
economy.
Page 4
EXECUTIVE SUMMARY
!
Accessible Retail: Defining the employment value of the Accessible Retail SectorCBRE
1.0!Introduction
Retail parks are a key component of the UK retail landscape, with revenue in 2014 estimated at £94.7bn, second
only to high streets at £107.2bn (Conlumino, 2015). Though the sector has somewhat suffered throughout the past
decade with the demise of traditional retail park staples such as MFI and Comet, recent years have seen a
rejuvenation in accessible retail, as the DIY and homewares sectors have recovered and retailers across the fashion
and discount sectors increasingly look to take space in out-of-town retail locations. Retailer demand, attracted by
large conforming units, affordable rents, high levels of accessibility and the availability of car parking close to store
entrances, is driving down vacancy rates, currently at 8.0%, the lowest of all retail sectors (Source: LDC, 2015)*. As
apparel and discount retailers increasingly look to take space on retail parks, retail parks are becoming more diverse
and strengthening their competitive position within the retail sector. Any concerns over the ongoing troubles of
grocery retailers and their impact on accessible retail are likely to be offset by the growth in demand from non-
traditional retail park occupiers.
While the growth in online retail has been a source of much concern in the retail sector as a whole, it can be argued
that e-retail has in fact contributed to the revitalisation of the retail park sector. Though the proliferation of online
shopping has indeed been detrimental to some local retail centres, the suitability of retail parks for click-and-collect
fulfilment has driven a surge in demand for units from occupiers wishing to develop their multichannel offer.
Convenient locations and free car-parking make retail parks highly accessible, and the ability to park close to the
Page 5
store entrance is particularly important when collecting bulky goods given the high delivery costs associated with
ordering such goods online. By offering the option for cost effective exchanges or returns in-store for online
INTRODUCTION
purchases, having a physical store in a location such as a retail park can boost the growth in online trade for a
retailer. This synergy with multichannel retail encourages visits to the retail park, increasing footfall and benefitting not
only the target retailer but neighbouring occupiers, increasing demand for these locations. The growth of click-and-
collect has additionally helped to boost employment in out-of-town retail which may have otherwise been lost to pure
play retail.
As retailers increasingly look to develop their multichannel offer and the out-of-town tenant mix diversifies, the future is
extremely bright for out-of-town retail. It is forecast that the sector will see 3.3% growth in total sales by 2019, further
cementing its position as a key retail destination.
Retail is a key cornerstone of the UK economy, employing almost 3 million people across the country. As the out-of-
town retail sector continues to grow, it is becoming an increasingly important source of employment within the retail
industry. In addition to jobs within the stores themselves, many other roles are dependent on the out-of-town retail
sector, for example construction and planning, head office and operations jobs for occupiers and landlords, as well
as within property agencies who support and manage retail parks. This report will attempt to estimate the number of
people employed within the industry, looking at the various roles available at different parts of the retail park life-
cycle. We will first detail the scope of the out-of-town retail sector, and use this to estimate those employed in the pre-
retail phase i.e. planning, construction and development, those employed when the retail parks are operational, those
employed in occupier and landlord head office functions, and those employed by third party organisations, such as
property agencies, who work directly in the out-of-town sector.
!
Accessible Retail: Defining the employment value of the Accessible Retail SectorCBRE
*Compared to shopping centres and high streets at 15.2% and 11.8% respectively (LDC, 2015).
Page 6
INTRODUCTION
!
Accessible Retail: Defining the employment value of the Accessible Retail SectorCBRE
2.0! Defining the scope of the out-of-town retail sector
The first step in quantifying the number of people employed in the accessible retail industry was defining the scope of
the sector. Using Trevor Woods data CBRE have detailed a universe of the UK out of town retail sector, including
retail parks, leisure parks, outlet centres and solus units, including occupiers and floor space data.
The occupiers are segmented by the retail category they trade within in order to understand the proportion of out-of-
town floor space occupied by each product category, allowing us to more accurately account for differences in
employment density between different product categories and individual retailers.
TYPE OF SCHEME
The database of accessible retail locations throughout the UK covers a total of 2,890 retail locations, at c.184 million
sq ft of space. The table below outlines the spread of retail space across various accessible retail categories.
Schem e Type Count Total GLA (sq ft) Average GLA (sq ft)
Retail Park 885 92,810,865 104,871
Retail Warehousing developm ent 1,862 67,845,476 36,437
Shopping Park 85 15,510,375 182,475
Retail and Leisure Park 31 6,860,666 221,312
Trade Park 27 655,799 24,289
T otal 2,890 183,683,181 63,558
Page 7
Figure 1: Breakdown of out-of-town retail universe by scheme type (Trevor Woods, 2015).
OUT-OF-TOWN RETAIL SECTOR
DEFINING THE SCOPE OF THE
Only stores which are located within these scheme types are included i.e. only supermarkets within retail parks or
shopping parks. Retail warehousing developments include solus units and dominate the UK accessible retail landscape
in terms of the number of schemes. However, in terms of floor space, accessible retail is largely concentrated within
retail parks, with over 92 million sq ft of retail space. Trade parks account for the smallest proportion of retail space
and are the smallest formats. Retail and leisure parks and shopping parks are the largest formats, at average sizes of
c.220,000 sq ft and c.180,000 sq ft respectively.
RETAIL CATEGORY
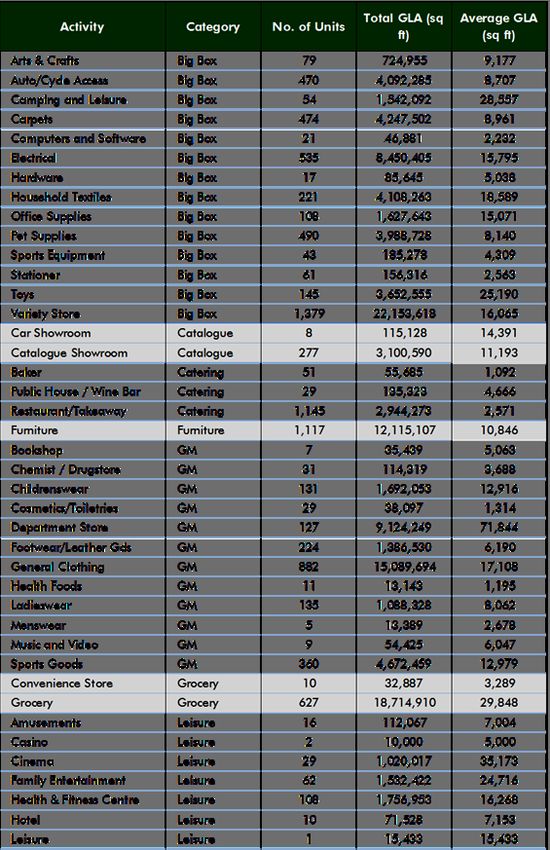
The table on the following page (Figure 2) shows the distribution of retail space across the accessible retail sector by
product category. As one would expect, the sector is dominated by bulky goods retailers, with DIY, Variety Stores
and Furniture amongst the product categories with the highest number of units. Grocery and Clothing, while
accounting for a smaller number of units, still make up a sizeable proportion of the total floor space and employment
in the sector. It is evident that Restaurant/Takeaway is a key retail type for accessible retail – while only accounting
for a small proportion of floor space; they have the second highest number of units and as such play a key role as an
employer in the accessible retail landscape.
!
Accessible Retail: Defining the employment value of the Accessible Retail SectorCBRE
Activity No. of Units Total GLA (sq ft) Average GLA (sq ft)
DIY 1,085 39,621,909 36,518
Variety Store 1,379 22,153,618 16,065
Grocery 627 18,714,910 29,848
General Clothing 882 15,089,694 17,108
Furniture 1,117 12,115,107 10,846
Departm ent Store 127 9,124,249 71,844
Electrical 535 8,450,405 15,795
Sports Goods 360 4,672,459 12,979
Carpets 474 4,247,502 8,961
Household Textiles 221 4,108,263 18,589
Auto/Cycle Access 470 4,092,285 8,707
Pet Supplies 490 3,988,728 8,140
Toys 145 3,652,555 25,190
Catalogue Showroom 277 3,100,590 11,193
Restaurant/Takeaway 1,145 2,944,273 2,571
Other 3,233 27,606,634 8,539
T ota l 12,567 183,683,181 14,616
Figure 2: Breakdown of out-of-town retail universe by product category (Trevor Woods,
2015)
Page 8
PROMINENT OCCUPIERS
The table below shows the top fifteen occupiers in terms of total GLA, excluding vacant units.
OUT-OF-TOWN RETAIL SECTOR
DEFINING THE SCOPE OF THE
Average GLA % Total Floorspace
Fascia Product Category No. of Units Total GLA (sq ft)
(sq ft) (m inus vacant)
B & Q (all form ats) DIY 350 21,530,297 61,515 12.5%
Hom ebase (all form ats) DIY 283 10,062,920 35,558 5.9%
Currys / PC World Electrical 378 7,665,600 20,279 4.5%
Matalan General Clothing 199 6,395,336 32,137 3.7%
Wickes DIY 213 6,375,265 29,931 3.7%
B & M (all form ats) Variety Store 258 5,330,527 20,661 3.1%
Sainsbury's (all form ats) Grocery 67 5,133,146 76,614 3.0%
IKEA Departm ent Store 18 4,320,665 240,037 2.5%
Halfords Auto / Cycle Access 414 3,809,974 9,203 2.2%
Asda (all form ats) Grocery 86 3,600,832 41,870 2.1%
Tesco (all form ats) Grocery 54 3,583,841 66,367 2.1%
Dunelm Mill Household Textiles 143 3,574,864 24,999 2.1%
Marks & Spencer Departm ent Store 60 3,428,792 57,147 2.0%
Carpetright Carpets 365 3,402,772 9,323 2.0%
Next (Fashion, Hom e & General Clothing/
255 3,378,958 13,251 2.0%
Garden) Variety Store
Other N/A 8,632 83,769,833 9,705 48.8%
T ota l N /A 11,317 171,562,201 15,160 100.0%
Figure 3: Breakdown of out-of-town retail universe by occupier (Trevor Woods, 2015)
B&Q are the sector’s most prominent occupier, in terms of both number of stores and total GLA. Though Homebase
have the second highest total GLA, this is less than half of that occupied by B&Q. The supermarkets also feature
prominently in the top fifteen, with Sainsbury’s, Asda and Tesco all present.
!
Accessible Retail: Defining the employment value of the Accessible Retail SectorCBRE
The top fifteen occupiers are generally larger format stores; however Carpetright and Halfords are noticeably smaller
than the other key retailers. Though IKEA has far fewer units than the other occupiers, the size of stores mean that it
accounts for one of the largest proportions of floor space.
Owners Total OOT GLA (sq ft)
PROMINENT LANDLORDS British Land 4,661,131
Ham m erson 4,533,033
The table to the right shows the
IKEA Properties Investm ents 4,226,808
top fifteen landlords in terms of
The Crown Estate 3,093,503
total out-of-town GLA. Sainsbury's 2,998,401
Land Securities Properties 2,942,153
Where assets are owned by
B & Q Properties 2,857,210
multiple stakeholders and Hercules Unit Trust 2,752,153
proportional ownership details Wm Morrison 2,724,693
Prudential Life Fund 2,636,065
were not available, CBRE have
Tesco Stores 2,512,220
applied an equal split of floor Henderson UK Retail Warehouse Fund 2,351,438
space among each party. Peel Holdings 2,135,569
M & G Property Fund 1,741,262
Though a large proportion of retail BlackRock UK Property Fund 1,730,411
park space is owned by private Other 139,787,131
Page 9
T ota l 183,683,181
investors, large institutional
landlords such as British Land, Hammerson and IKEA Properties Investments are responsible for the greatest
OUT-OF-TOWN RETAIL SECTOR
DEFINING THE SCOPE OF THE
Figure 4: Breakdown of out-of-town retail universe by landlord (Trevor Woods, 2015)
proportion of space. These floor spaces have therefore been used to calculate average employment densities amongst
investors and owners across the accessible retail landscape.
GEOGRAPHIC DISTRIBUTION
The table below shows the spread of accessible retail space across the different regions.
Region No. of Units Total GLA (sq ft) Average GLA (sq ft)
South East 765 46,663,989 60,999
North West 342 23,956,091 70,047
Scotland 245 18,348,704 74,893
West Midlands 283 17,019,980 60,141
Yorkshire & Hum berside 265 16,519,353 62,337
South West 257 14,777,193 57,499
East Midlands 204 11,854,554 58,111
Wales 176 11,244,612 63,890
North 141 9,659,509 68,507
Northern Ireland 102 6,985,011 68,481
East Anglia 106 6,508,067 61,397
Channel Islands 2 86,509 43,255
Isle of Man 2 59,609 29,805
T ota l 2,890 183,683,181 63,558
Figure 5: Breakdown of out-of-town retail universe by region (Trevor Woods,
2015)
!
Accessible Retail: Defining the employment value of the Accessible Retail SectorCBRE
A large proportion of accessible retail space is concentrated in the South East. The North West has the second largest
amount of floor space, though this is almost half of that which is present in the South East. Average GLA is relatively
consistent across regions; however Channel Islands and Isle of Man have notably smaller developments.
Page 10
OUT-OF-TOWN RETAIL SECTOR
DEFINING THE SCOPE OF THE
!
Accessible Retail: Defining the employment value of the Accessible Retail SectorCBRE
3.0! Calculating Employment Numbers
With the aim of defining clearly ‘who’ is employed by the sector, CBRE felt it was important to differentiate between
those employed directly within the centre and those employed ‘one step removed’ from the centre. The calculation of
employment numbers was therefore split into four categories as detailed below.
PRE-RETAIL EMPLOYMENT
The first category of employment concerns jobs within the ‘pre-retail’ phase. This refers to those employed before the
retail park is operational, and includes those employed in construction and development of the retail park.
This section has been split into three categories:
PLANNING AND DESIGN
To estimate the number of people employed in the planning phase of retail parks, CBRE looked at membership of
Accessible Retail. As an official body for the industry CBRE felt that this would give an accurate indication of the
number of people employed in planning and technical jobs.
There are c.300 people employed in total (not FTE) in this C o mp a n y N o . E mp lo yees
part of the pre-retail phase. This refers to those who are CgMs 19
employed exclusively in out-of-town retail. The table to the Chase & Partners 18
GL Hearn 11
Page 11
right shows the top 10 employers in this phase. Generally,
Nathaniel Lichfield & Partners 11
this is made up of specialist planning consultancies, rather
Vectos (South) 11
CALCULATING EMPLOYMENT
NUMBERS
than the larger property agencies which tend to have smaller
WYG Planning & Design 11
teams dedicated to out-of-town planning. For instance, only Peacock & Smith 10
two people are employed in this phase at CBRE, as opposed RPS 10
to almost 20 in some more niche firms. The vast majority of Urban Edge Architecture Limited 10
GKA Limited 9
these jobs are in London and surrounds, though there are a
Figure 6: Top 10 employers in out-of-town planning.
number of jobs in smaller towns and cities throughout the UK.
(Accessible Retail, 2015)
CONSTRUCTION
To calculate the number of people employed during the construction phase, CBRE have analysed planning
applications of a number of case studies of out-of-town developments. These included schemes of a variety of sizes
and development types, including new schemes, extensions and redevelopments. The average number of construction
jobs per square foot of space under development was collected, as well as the length of the construction period which
varied significantly by scheme. The number of jobs per year for each 1,000 sq ft of development was then calculated,
and this figure is used as the key unit of measurement. Historical retail park data was then analysed for years 2012 to
2015, a period when retail park construction had begun to pick-up post-recession. This was used to derive an average
value for the amount of floor space developed each year. The number of jobs per year for each 1,000sq ft of
development was then applied to this yearly figure to calculate the average number of construction jobs in out-of-town
retail each year.
!
Accessible Retail: Defining the employment value of the Accessible Retail SectorCBRE
The value calculated was 1.94 jobs per year for each 1,000 sq ft of out-of-town development. On average from 2012
to 2015, 1,113,000 sq ft of out-of-town floor space is under construction each year, with variations in construction
volumes between spring and the latter half of the year. CBRE therefore calculated that the accessible retail sector
sustained 2,200 jobs per year in total in the construction phase of retail parks. While these jobs are often temporary,
the average length of development within the case studies used was twelve months, and therefore these opportunities
tend to offer secure employment for at least one year.
The chart below shows the proportion of retail park floor space under construction in H1 2015 in each region.
All regions, with the
exception of the north east,
have seen a significant
amount of out-of-town space
under the construction in the
first half of 2015. Both the
East and South West of
England are currently
witnessing a particularly
Page 12
large volume of construction.
This demonstrates the ability
CALCULATING EMPLOYMENT
NUMBERS
of the construction phase to
Figure 7: Proportion of retail park floor space under construction in H1 2015 (CBRE,
provide employment opportunities throughout the UK.
2015).
FIT-OUT/REFURBISHMENT
In order to calculate the number of people employed in the fit-out and refurbishment aspect of out-of-town retail, CBRE
disaggregated the retail universe by product category. An assumption was made around the frequency of
refurbishment in each product category, with DIY and bulky goods retailers assumed to undergo refurbishment less
frequently, and fashion and leisure operators expected to be refurbished most frequently. These values ranged from
once every decade among DIY retailers to once every four years for bars and restaurants. The assumed refit rate
takes into account both new fit outs from new retailers moving into a unit and refurbishment of existing shops. A table
outlining these assumptions can be found in the appendix. This re-fit rate was applied to each product category to
estimate the amount of floor space which is re-fit every year.
CBRE then spoke to several companies specialising in fit-outs, to understand how the number of people required to fit-
out a unit varies between types of occupier. Leisure and grocery operators were thought to require more people for
fit-out and refurbishment, with warehouse and DIY retailers requiring a far smaller number of people. CBRE used this
insight to estimate the area of floor space which one person would be able to fit out in one week. The amount of floor
space fit out by one person in one year was then calculated, assuming two weeks for holiday. This was then applied
!
Accessible Retail: Defining the employment value of the Accessible Retail SectorCBRE
Average
Category Em ployees/1,000
sq ft
to the total amount of floor-space re-fit each year in Big Box 2.1 order to
Catering 8.0
estimate the number of people required to fit out all floor space
Fast Food 30.4
in one year. These assumptions are also included in the
Furniture 0.9
appendix. General Merchandise 4.6
Grocery 3.6
CBRE estimated that, 1,100 people are employed in total in the
Leisure 1.0
fit-out/refurbishment stage of development. Showroom 4.2
Warehouse 1.4
This equates to a total of over 3,500 people employed in total in
Other N/A
the pre-retail phase.
Figure 8: Average employment density in-store in out-
of-town locations by product category (CBRE, 2015)
WORKERS DIRECTLY EMPLOYED WITHIN RETAIL PARKS
IN-STORE
Page 13
Those employed within the retail parks themselves make up the greatest proportion of employment in the industry. This
includes those working within the retail outlets as well as those employed to manage, clean, maintain and secure the
CALCULATING EMPLOYMENT
NUMBERS
parks. We also considered those working in office and administration positions within the centre.
To quantify the number of people employed within the retail outlets we used a bottom-up approach employing
primary research. CBRE visited a large number of retail park and trade park developments, surveying managers
within hundreds of stores to understand the total number of people employed in that individual store and how
employment was split between full-time and part-time colleagues.
Each product category from the out-of-town retail universe was then aggregated to one of ten broader categories
based on type of goods sold and typical size of unit. A table outlining the product categories in each broader group
can be found in the appendix. Average employment densities were then calculated for each category. This approach
was used to account for the variation in the density of retail employment among different retail types. For instance,
fashion retailers employ a far higher number of people than DIY/homewares retailers within a store of the same size,
due to the greater need for customer service and stock replenishment. The table to the right shows the average
employment densities calculated in each product category based on the gross leasable area of each store.
For the ‘Other’ category which includes occupiers such as opticians, telecom services and hairdressers, a number of
assumptions were made, because the individual retail types were too varied for an average employment density to be
relevant. For example, it was assumed that ‘Medical Services’ or ‘Optician’ would employ a significantly greater
number of people given that they require medical, administrative and customer facing employees. A table showing
the assumptions made around employment in each of these occupier types can be found in the appendix.
!
Accessible Retail: Defining the employment value of the Accessible Retail SectorAverage
CBRE Grouping No. Em ployees No. Units Em ployee
per Unit
Big BoxCBRE 81,136 4,097 20
Catering 12,755 799 16
General Merchandise 264,704 1,933 137
Fast Food 41,858 426 98
Furniture 13,624 1,117 12
Grocery 90,804 637 143 These employment densities were then applied to the
Leisure 4,815 228 21 universe of out-of-town locations. Using a regression
Showroom 20,631 285 72
model, an equation was created in order to accurately
Warehouse 67,593 1,109 61
Other 6,845 685 10 predict the number of workers employed at each
T ota l Reta il E mp loyees 604,766 11,316 53 location. A minimum number of workers were set for
Figure 9: Total number of people employed in-store in each product category
each outlet. The number of employees working in each category is shown in the table on the left.
in out-of-town locations (CBRE, 2015)
This gives 605,000 employees in total (not FTE) within stores.
WORKING PATTERNS WITHIN
100%
STORES 14% 17%
80%
CBRE also undertook research to 51% 52% 52% 56%
64% 69%
60%
understand how in-store workers
were split between part-time and 40% 86% 83%
full-time, and how this varies by 49% 48% 48%
20% 44%
36% 31%
product category.
0%
Page 14
Of our aggregate groups, both
Furniture and Leisure were markedly
CALCULATING EMPLOYMENT
NUMBERS
dominated by full-time employees.
All other product categories have a
Full Tim e Part Tim e
greater proportion of part-time than
full-time staff. Grocery and general merchandise stores in particular have a huge number of part-time employees. This
can be largely attributed to the way these type of stores operate – a furniture store selling bulky goods from a
showroom environment generally require much less stock replenishment than a grocery or fast-fashion store, which
turns over a far higher volume of goods and consequently needs constant stock checking and replacement.
Additionally, many of these retailers, in particular grocery and retail warehouse occupiers, often require shift work
and these working patterns lend themselves much more easily to part-time roles and flexible working patterns.
Notably, when interviewing store managers, a large number of people commented that high numbers of part-time
employees were largely due to the high number of students employed. A number of managers, in stores such as Next,
H&M and Outfit in particular, stressed that there was not a straightforward split of full-time and part-time staff, and
highlighted the importance to their operating model of having a range of contracts and flexible working hours.
Again, this demonstrates the ability of out-of-town retail to provide flexible employment terms to suit the needs of
people from different walks of life. The option for flexible working contracts which can be fit around personal
commitments allows students, working parents and foreign workers, among others, to earn a wage which fits in with
their lifestyle.
!
Accessible Retail: Defining the employment value of the Accessible Retail SectorFigure 10: Number of employees working
on retail parks but not in-store
CBRE Role No. Em ployees
Maintenance 343
Cleaner 343
Centre Manager 172
T ota l 858
SUPPORT STAFF
A different approach was taken to calculate employees working within the parks but not in the shops, i.e. cleaning,
maintenance and centre managers. Following discussions with operators this indicates that on average one
maintenance employee and one cleaning employee (employed to clean public areas of the park not within stores)
would each cover 500,000 sq ft of space, with one centre manager covering 1 million sq ft of space. Vacant space
was excluded from the total retail universe. CBRE calculated that over 850 people are employed in total in the retail
parks but not within the stores.
This means that in the ‘Retail’ phase, almost 606,000 jobs in total are dependent on out-out-town retail.
Again, as our analysis of the out-of-town universe shows, all regions benefit from a significant proportion of out-of-
town floor space. While many schemes such as Colliers Wood are located on the fringe of affluent towns and cities,
out-of-town developments within more economically sensitive catchments, such as Teeside Retail Park, can be key
sources of employment in an area. Where educational attainment is low, retail and administration jobs within retail
parks can offer an excellent source of reasonably low-skilled employment, while providing excellent opportunities for
career progression into managerial positions.
Page 15
NON-PARK EMPLOYEES
Another key category of employment for the out-of-town retail sector are those employed ‘one step removed’ from the
CALCULATING EMPLOYMENT
NUMBERS
retail parks themselves. This category includes head office positions on both the landlord and occupier sides.
LANDLORDS
Using the out-of-town retail universe, key retail park landlords managing significant proportions of floor space were
identified, including landlords such as La Salle Investment Management and TIAA Henderson. These landlords were
surveyed, to establish if the organisation had a dedicated out-of-town team and, if so, the number of people employed
in various employment categories. If the landlord did not have a dedicated out-of-town team, information was
collected about the overall level of employment and this was apportioned based on the proportion of the floor space
within the landlord’s portfolio which is out-of-town.
An average head office employment density was calculated at one employee per 199,222 sq ft of floor space. These
figures were then extrapolated out to our out-of-town universe.
A significant number of out-of-town retail properties are owned by private investors and, while these investors have a
different employment structure to the largest institutional landlords, CBRE maintained a similar approach to calculating
employment densities for these properties.
Over 6,200 jobs on the landlord owner and investor sides in total were estimated for the accessible retail sector.
RETAILERS
!
Accessible Retail: Defining the employment value of the Accessible Retail SectorCBRE
Using our out-of-town retail universe, several of the top retail park
Average
occupiers in terms of floor space were identified as targets for data Category Em ployees/1,000
sq ft
collection. Information about employment within head office, Big Box 0.20
operations, warehousing and call centres was collected using a Catering* 0.55
combination of primary research methods. This included surveying Furniture 0.41
General Merchandise 0.70
property directors, liaising with investor relations and corporate
Grocery 1.24
media teams, and looking at company’s annual reports and Leisure 0.02
accounts. A number of jobs were then apportioned to out-of-town Showroom 0.46
Warehouse 0.25
retail based on the proportion of floor space in each occupier’s
Other N/A
portfolio which is out-of-town. Using the product category of each
Figure 11: Average employment density in out-of-
retailer, these numbers were then aggregated to the same ten groups used
towntohead
estimate
office in-store employment.
and operations jobs by product
category (CBRE, 2015) *Includes both restaurants
and
Average employment densities for non-retail jobs were calculated, which arefast-food
shown in the table above.
Head office densities seemed to be a lot more varied within product categories than the in-store employees, however
it remains clear that grocery and ‘general merchandise’ retailers have the most dense non-retail employment.
Employment densities were then applied to the universe of out-of-town locations. Using a regression model, an
equation was created in order to accurately predict the number of head office workers employed for each occupier
Page 16
present in out-of-town retail locations.
CALCULATING EMPLOYMENT
NUMBERS
Again, a different approach was taken to calculate non-retail employees in the ‘Other’ category. Looking at individual
use classes, CBRE identified which operators were likely to have a head office function. For example, occupiers such
as Hairdressers and Off-licenses were most likely to be independents and, as such, unlikely to have head office
functions, whereas occupiers such as Travel Agents and Financial Services were identified as most likely to have head
office functions. A table outlining the assumptions around head-office can be found in the appendix. For those thought
to have a head office/operations function, 0.5 of a non-retail employee was allocated per unit and this was used to
calculate total number of employees in this category.
A table of the number of
Average
No. Non- retail
non-retail jobs per product CBRE Grouping No. Units Em ployee per
Em ployees
Unit
category can be seen to the Big Box 16,613 4,097 4
right. In total CBRE Catering 1,852 1,225 2
Furniture 6,206 1,117 6
calculated that occupiers
General Merchandise 8,792 1,933 5
have almost 107,000 jobs in Grocery 66,776 637 105
total in non-retail roles which Leisure 228 228 1
Showroom 1,503 285 5
are dependent on the out-of-
Warehouses 4,628 1,109 4
town retail sector. Other 262 685 0
T ota l N on - reta il E mp loyees 106,859 11,316 131
While this number alone
represents an excellent source of employment throughout the UK, when considering the
Figure 12: Total number of people employed in out-of-town head office and operations jobs
in each product category (CBRE, 2015)
!
Accessible Retail: Defining the employment value of the Accessible Retail SectorCBRE
location of these jobs, this figure becomes even more significant. Retailer head office operations are generally
geographically dispersed throughout the UK, often dependent on the historic origins of the retailer. For instance,
Morrisons’ head office functions are located in Bradford, and one of Sainsbury’s head offices is located in Coventry.
Furthermore, operations and logistics hubs in particular tend to be located in more provincial locations. This
demonstrates that, unlike many other industries, accessible retail provides high-skilled jobs throughout the UK, rather
than concentrated in few key cities. This means that areas such as Bradford and Coventry, which see limited
investment by large private institutions, are still able to offer opportunities ranging from buying and merchandising
roles to jobs in property, statistical modelling and research.
APPRENTICESHIPS AND TRAINING
As well as offering manual labour, customer service and head office employment, a number of key retail park players
also offer apprenticeships and training schemes. In particular, the trade-focused DIY and building materials retailers
and food and beverage operators offer excellent opportunities to gain professional qualifications.
The City and Guilds Top 100 Apprenticeship Employers is a list of employers who have been recognised for having
the highest standards in employing apprentices. The 2014 list features a number of employers working at all stages of
the retail park lifecycle, namely retailers such as Topps Tiles, KFC and Mitchells & Butlers.
Page 17
TOPPS TILES: Topps Tiles’ 2014 apprenticeship scheme offered 33 retail apprenticeships across the country, with
employees working in-store, being mentored by senior members of staff and taking part in group training days,
CALCULATING EMPLOYMENT
NUMBERS
helping employees to develop skills in sales and store operations. In addition, 119 store employees are currently
involved in the Retail and Team Leading Apprenticeship programme, as well as apprenticeship opportunities in head
office positions. Topps Tiles boast that 700 current employees have already completed such qualifications (Annual
Reports and Accounts, 2015).
KFC: One of the key food and beverage retailers operating out-of-town, KFC offer numerous opportunities for training
and apprenticeships. The brand created an Advanced NVQ Apprentice scheme in conjunction with City and Guilds,
which gives team leaders the opportunity to train for a qualification in hospitality management, the equivalent of two
A-Levels. On the back of the success of this scheme, the retailer began operating another level two apprenticeship
scheme, equivalent to 5 GCSE’s. In addition, KFC operate a bespoke Business Management course in partnership
with De Montfort University, which offers a combination of KFC training and lectures from the university. For recent
university leavers, the brand also operates a graduate scheme, involving rotations within head office. The brand
therefore offers opportunities for training and development in roles, with a wide range of skill levels.
MITCHELLS & BUTLERS: Retail chain Mitchells & Butlers operate a number of key out-of-town food and beverage
operators such as Harvester, Toby Carvery and Sizzling Pubs. In addition to a range of graduate schemes, including
HR, Marketing and Finance schemes, the company offers a Hospitality Management Development Apprenticeship
throughout each of their UK brands. It is a three year programme designed specifically for recent school leavers with
little or no educational attainment, and allows employees to obtain a Hospitality Level 2 Apprenticeship qualification.
!
Accessible Retail: Defining the employment value of the Accessible Retail SectorCBRE
Currently, 1,500 people are enrolled on their apprenticeship programme, with the aim to create another 1,000
apprenticeships in the next two years.
OTHERS: In addition, many key occupiers who do not feature in the top 100 list offer training schemes for their
workforce. This ranges from Home Retail Group’s year-long university placements, e-learning and secondments
offered by New Look, to Finance Apprenticeships at B&Q and M&S’s Management Scheme for School Leavers. A
notable example is the opportunity offered by Costa and Premier Inn owners Whitbread. The company has recently
launched its new Costa apprenticeship scheme which will allow employees to work towards an Intermediate
Apprenticeship in Customer Service and Barista Skills. In addition, the Premier Inn fascia offers apprenticeships at
intermediate, advanced and higher level. In total, Whitbread have pledged to take on 6,000 apprentices by 2020.
As well as training and development programmes offered in the retail and hospitality sectors, several out-of-town
players offer opportunities in manufacturing and construction. For instance, Howdens Joinery Group, the retail arm of
which trades from several out-of-town units in the UK, offers a number of training opportunities in technical roles as
well as their courses in subjects such as HR and environmental awareness. Along with the Construction Industry
Training Board, they offer a Howden Joinery Bursary which supports 40 apprentice joiners. Howdens also offer
apprenticeships in engineering, as well as manufacturing operations.
Page 18
The participation of the out-of-town retail industry in a wide range of training and apprenticeship schemes further
reinforces the valuable contribution it makes to the UK economy. The benefits of apprenticeships are widely
CALCULATING EMPLOYMENT
NUMBERS
acknowledged; they offer the opportunity for those unable to enter into higher education to gain practical skills and
obtain recognised qualifications, while simultaneously earning a wage. Aside from official qualifications, many key
out-of-town players offer continuous training and development within normal roles. It is often recognised that offering
apprenticeships and training programmes helps to retain employees, encouraging them to consider their role within
that organisation as a career, rather than ‘just a job’. This reflects the opportunities within the out-of-town retail sector
for longevity and progression towards meaningful careers.
ASSET MANAGEMENT
The final category of employment studied were those employed by third firms to carry out leasing, investment and
legal services.
While not directly employed by retail parks, there are several employees within third party property agencies whose
jobs depend solely on the out-of-town industry; for instance, surveyors on both the leasing and investment sides who
work purely within the accessible retail sector. Additionally, T otal No. OOT
Com pany
employees working in supermarket teams are largely dependent on Em ployees
JLL 31
the out-of-town sector.
Savills 28
To collect this data CBRE looked at membership of Accessible Retail. CBRE 21
GL Hearn 19
As an official body for the industry CBRE felt that this would give an
Colliers International 18
accurate indication of the number of people employed on the agency Mason Partners 15
DTZ 14
Wilkinson William s 13
Eric Young & Co 12
Edgerley Sim pson Howe 12
!
Accessible Retail: Defining the employment value of the Accessible Retail Sector Figure 13: Top ten employers in out-of-town asset
management (Accessible Retail. 2015)CBRE
side of out-of-town retail, including those employed in supermarket teams.
CBRE calculated the number of employees in third-party organisations across the UK to be 560 in total.
There are several key organisations with a significant numbers of employees in the accessible retail sector. The top ten
agencies in terms of number of employees in out-of-town are shown in the table on the right.
While many of these agencies are headquartered in London,
Total No. OOT % of
Location several of the largest firms have offices throughout the UK.
Em ployees Em ployees
Additionally, several of the smaller surveying firms are located in
London 297 52.8%
Edinburgh 32 5.7% smaller regional towns.
Manchester 27 4.8%
Birm ingham 25 4.4%
The table to the left shows the top ten locations in terms of number
Leeds 22 3.9% of employees in out-of-town retail agency.
Bristol 17 3.0%
Glasgow 17 3.0% While, the majority of agency jobs can be found in and around
Liverpool 16 2.8% London, the sector is increasingly successful at employing people
Surrey 13 2.3%
in regions such as West Midlands and the North West. In these
Chester 8 1.4%
Figure 14: Top ten locations of employees in out-of- areas, where employment has traditionally been in heavy
town asset management (Accessible Retail, 2015) industries and manufacturing, the proliferation of surveying jobs
Page 19
helps to diversify the regions’ economies, offering opportunities
for highly paid, high skilled jobs to local residents.
CALCULATING EMPLOYMENT
NUMBERS
!
Accessible Retail: Defining the employment value of the Accessible Retail SectorCBRE
4.0 Results and Findings
TOTAL NUMBER OF EMPLOYEES
Compiling findings from each category of employment, CBRE have calculated that the total number of employees
dependent on the UK accessible retail sector is as follows:
Phase of Em ploym ent Sub- sector No. Jobs
Construction
Figure 15: Number of employees in each Jobs
phase of the retail park 2,159
lifecycle
Planning & Technical Jobs 277
Pre Reta il
Fit- out jobs 1,146
All 3,582
In- store employees 604,766
Reta il Facilities 858
All 605,624
O c c u p ier H ea d O ffic e All 106,859
La n d lord H ea d O ffic e All 6,239
A sset Ma n a g emen t All 562
T ota l 722,867
Page 20
In total, the sector employs almost 723,000 people in total every year. It is clear that jobs within the stores themselves
make up the majority of the overall employment; however head office jobs among both occupiers and landlords still
supply a significant number of jobs.
4.0 RESULTS AND FINDINGS
WHAT DOES THIS MEAN FOR THE UK ECONOMY?
One of the key findings from this study is the diversity of the Accessible Retail sector and the employment
opportunities that it offers. Firstly, it is worth nothing that at over 700,000 employees, the sector accounts for almost a
fifth of all people employed in UK retail (4.41 million; Commons Library, 2015) and 2.3% of all people employed in
the UK (31.1 million; ONS, 2015). This compares with the big four banks – Lloyds Banking Group, HSBC, Barclays
and Royal Bank of Scotland who, in total, employ almost 598,000 people worldwide. The number of people
employed in UK out-of-town retail also exceeds the global workforce of eleven FTSE 100 listed companies, including
Royal Mail, Associated British Foods and GlaxoSmithKline.
Secondly, the sector offers jobs at all skill levels – manual labour in the construction and fit-out phases, low-skilled
retail jobs in customer service and hospitality, white collar administrative jobs, a variety of head office roles including
HR, PR, operations and logistics, as well as highly skilled jobs in surveying and consultancy. Consequently, out-of-
town retail is a key component of the UK economy. Providing employment for a vast range of people, including
students, working parents, and those nearing retirement, from people with little to no educational attainment to those
with university degrees and professional qualifications, the industry provides one of the broadest sources of
employment in the UK. Through offering employment in sectors such as property, marketing and merchandising, a
wide range of educational disciplines can be applied to jobs in out-of-town retail.
!
Accessible Retail: Defining the employment value of the Accessible Retail SectorCBRE
Additionally, the spread of accessible retail throughout the UK mean that the sector employs people from all stretches
of the country. The industry is not elitist – it does not solely offer jobs in London and the south-east, as many industries
do. Planning, construction and retail jobs in particular are evenly spread across the county. Through many occupiers
and landlords locating head offices in provincial towns, the sector is able to bring high-skilled jobs with good career
progression to areas which generally see limited interest from large multi-nationals. This is particularly significant when
we consider the opportunities for training and apprenticeship schemes offered by a number of key retail park players.
As demand for retail park space grows among both consumers and occupiers, vacancy rates are likely to continue to
plummet in the coming years. With more units actively trading, employment opportunities will be ever greater.
Page 21
4.0 RESULTS AND FINDINGS
!
Accessible Retail: Defining the employment value of the Accessible Retail SectorCBRE
5.0 Pure Play
In order to understand the relative employment benefits created by different retail channels, CBRE have also
undertaken research in order to estimate the number of people employed by pure play retailers.
We have collated data on several of the UK’s largest online retailers in terms of sales, including Amazon, Shopdirect,
Ocado and Asos, on the number of people employed. As with the ‘one-step removed’ occupier staff in the out-of-town
sector, only the delivery and logistics staff employed directly by the retailers have been included, rather than
including contractors who are not wholly focussed on the delivery of online orders from these retailers.
CBRE have examined the relationship between the revenue of each retailer and the number of employees. While the
employment densities inevitably vary depending on the type of good sold, due to the volume of sales, the number of
people needed to handle each item and the number of items which can be delivered in one journey, it was found that
annual revenue had a very strong positive relationship with the number of employees, with an RSQ value of 0.861.
This has been used to create a regression equation to estimate the total number of people employed in pure play
retail. Using an annual sales figure of £41.9 billion (Conlumino, 2015), CBRE have calculated that the pure play
sector employs around 61,000 people. This compares with out-of-town sales of £94.7 billion (Conlumino, 2015) and
a workforce of 723,000. This means that out-of-town employs a significantly greater number of people for each pound
of revenue generated. CBRE have calculated that pure play employs one person for every £1.8 million generated,
whereas out-of-town retail employs one person for every £131,000 generated.
Page 22
While for pure-play we have only calculated those employed directly by the retailer, this still compares with over
5.0 PURE PLAY
600,000 people in out-of-town retail when looking at those that are employed solely within the shops.
In terms of contribution to the economy, pure play clearly offers far fewer employment opportunities. Aside from
offering a smaller number of jobs, the range of roles on offer is also markedly more limited. While these retailers
undeniably offer a significant number of manual jobs and some white collar head office roles in departments such as
merchandising and marketing, the range of sectors covered is much narrower. For instance, there is not a significant
opportunity to find employment in planning and construction, nor is there great reliance on third party professional
services firms such as leasing and investment agents, further reducing the range of employment on offer. In addition,
the nature of the jobs on offer greatly restricts the type of people who are suitable for the roles. A large proportion of
work within the pure play sector is manual labour, for example ‘pickers’ within distribution centres and those who
work in delivery. As these jobs are often physically demanding, they tend to be more suitable for particular
demographics rather than appealing to workers from all walks of life . Consequently, where the out-of-town retail
sector offers flexible working which can support older generations and ‘nearly retirees’, these people are often less
suitable for a number of roles within pure play retail.
In addition, while there has been much debate surrounding technology, and in particular e-commerce, infiltrating
traditional bricks-and-mortar retail, we believe that the out-of-town retail sector as a whole is well-placed to take
advantage of these developments, rather than falling victim of changing shopping habits. Consequently, we believe
the employment opportunities offered by out-of-town retail will be defensive against growth in online retail and jobs
will be sustained going forwards. In contrast, many of the country’s largest online retailers are constantly driving
!
Accessible Retail: Defining the employment value of the Accessible Retail SectorCBRE
towards further technological advancements, for example Amazon and Google’s attempts to develop self-driving
vehicles and delivery drones have been well-documented in recent years. While these technologies seem years away
from fruition, the impact on jobs if and when they are implemented would be substantial.
This could be considered in contrast to the impact of technology on out-of-town brick-and-mortar stores; whilst carrying
out primary research at an Argos store in a prominent north London location, it was highlighted that that store was
the home delivery hub for all of north London. In addition to the staff employed in customer-facing and back-of-house
roles, an extra twenty people were employed at that location purely to handle deliveries. Furthermore, the customer
service offer, lacked by pure play retailer, is the key differentiator for bricks-and-mortar as it increasingly competes
with e-commerce for consumers. Amazon and Google have recently ventured into bricks-and-mortar stores in Indiana
and London respectively, reflecting the importance of customer service, the need to provide consumers with an
‘experience’, rather than just a marketplace and to create a strong brand. As stores seek to strengthen their position
against e-commerce, in-store roles will be crucial to ensuring that retailers drive footfall into their stores.
In conclusion, both the number and type of employment opportunities offered by the pure play sector are much more
limited than in out-of-town retail. Out-of-town accounts for almost a quarter of all retail employees, offering work
across a huge swathe of sectors, employing a range of demographics and skill levels. In contrast, pure play employs
far fewer people, in a narrow range of sectors, with a more limited skill set. Compounding our findings is the notion
Page 23
that jobs within pure play are at high risk of automation. While the pressure of technology makes the in-store
experience ever more significant and actually helps to cement the need for in-store employees, the threat of new
5.0 PURE PLAY
developments means that jobs within the pure play sector could become incredibly vulnerable.
!
Accessible Retail: Defining the employment value of the Accessible Retail SectorCBRE
6.0 Disclaimer & Contact Details
Information herein has been obtained from sources believed to be reliable. While we do not doubt its
accuracy, we have not verified it and make no guarantee, warranty or representation about it. The
material provided by us is intended for the sole use of the person or firm to whom it is provided. Any
projections, opinions, assumptions or estimates used are for example only and are our best estimate of the
future performance of the market.
Page 24
For more information regarding this report, please contact:
6.0 DISCLAIMER & CONTACT
DETAILS
Martin Summerscales Amy Bell
Head of Retail Consultancy, CBRE Junior Retail Consultant, CBRE
T: 020 7182 2041 T: 0207182 2493
M: 07771 897 875
E: Martin.Summerscaleso@cbre.com E: Amy.Bell@cbre.com
!
Accessible Retail: Defining the employment value of the Accessible Retail SectorDO NOT DELETE
CBRE
A. Table showing calculation of fit-out and refurbishment
employees
APPENDICE
NUMBER OF EMPLOYEES SET
FOR EACH CATEGORY
D. TABLE SHOWING MINIMUM
S
!
Accessible Retail: Defining the employment value of the Accessible Retail SectorCBRE
A. Table showing calculation of fit-out and refurbishment
employees
NUMBER OF EMPLOYEES SET
FOR EACH CATEGORY
D. TABLE SHOWING MINIMUM
!
Accessible Retail: Defining the employment value of the Accessible Retail SectorCBRE
A. Table showing calculation of fit-out and refurbishment
employees
NUMBER OF EMPLOYEES SET
FOR EACH CATEGORY
D. TABLE SHOWING MINIMUM
!
Accessible Retail: Defining the employment value of the Accessible Retail SectorCBRE
B. Table showing classification of product categories
NUMBER OF EMPLOYEES SET
FOR EACH CATEGORY
D. TABLE SHOWING MINIMUM
!
Accessible Retail: Defining the employment value of the Accessible Retail SectorCBRE
B. Table showing classification of product categories
NUMBER OF EMPLOYEES SET
FOR EACH CATEGORY
D. TABLE SHOWING MINIMUM
!
Accessible Retail: Defining the employment value of the Accessible Retail SectorCBRE
C. Table showing calculation of employees in-store within
the ‘Other’ category
NUMBER OF EMPLOYEES SET
FOR EACH CATEGORY
D. TABLE SHOWING MINIMUM
!
Accessible Retail: Defining the employment value of the Accessible Retail SectorCBRE
D. Table showing calculation
C. minimum number of employees
of employees in-storeset for each
within
category
the ‘Other’ category
Minim um No.
Category
Em ployees Used
Big Box 5
Catering 5
Fast Food 9
Furniture 3
General Merchandise 4
Grocery 5
Leisure 4
Showroom 10
Warehouse 5
Other N/A
NUMBER OF EMPLOYEES SET
FOR EACH CATEGORY
D. TABLE SHOWING MINIMUM
!
Accessible Retail: Defining the employment value of the Accessible Retail SectorCBRE
E. Table showing estimation
C. calculationofofhead office staff
employees among
in-store within
occupiers
the ‘Other’incategory
the ‘Other’ category
E. TABLE SHOWING
ESTIMATION OF HEAD OFFICE
STAFF AMONG OCCUPIERS IN
THE ‘OTHER’ CATEGORY
!
Accessible Retail: Defining the employment value of the Accessible Retail SectorYou can also read