Myxomycetes within ecotones in temperate and tropical forests
←
→
Page content transcription
If your browser does not render page correctly, please read the page content below
Uniciencia Vol. 35(1), pp. 299-311, January-June, 2021         DOI: http://dx.doi.org/10.15359/ru.35-1.18
  www.revistas.una.ac.cr/uniciencia                                                    E-ISSN: 2215-3470
   revistauniciencia@una.cr                                                               CC: BY-NC-ND

                       Myxomycetes within ecotones in
                       temperate and tropical forests
                Mixomicetes en ecotonos forestales de bosques templados y tropicales
               Mixomicetos em ecótonos florestais de bosques temperados e tropicais
           Carlos Rojas Alvarado1, 2 • Randall Valverde González1 • Stephanie Somerville1 • Adam W. Rollins3 •
                                                  Steven L. Stephenson4

                              Received: May/27/2020 • Accepted: Aug/6/2020 • Published: Jan/31/2021

        Abstract
        Ecotones are interesting portions of forests where microorganisms can be studied for monitoring and
        diversity purposes. Given the faster life cycle of these organisms, their study in such a context is important
        to develop models that allow us to understand adaptive microbial dynamics. The main objective of this
        study was to evaluate the dynamics of myxomycetes present in the leaf litter layer in different geographical
        locations representing both temperate and tropical systems, using an experimental approach within the
        ecotones produced by sharp forest edges. Employing the moist chamber technique and three ecological
        indicators (species richness, diversity, and number of records, as a proxy for abundance) associated with
        the reproductive phase of the life cycle of myxomycetes, the present study summarized the potential effect
        of both temperate and tropical ecotones on the distribution of these organisms. Data from 26 locations
        in six countries showed that all indicators were higher in temperate than in tropical forests and that most
        differences could be explained by ecological effects. The overall influence of the ecotone on myxomycetes
        was opposite in temperate and tropical forests, but the data collected for both types of forests showed
        similarities that could be explained by comparable mathematical models. These results suggested that,
        with the methods used herein, ecotones do affect ecological patterns of myxomycetes, but the intensity and
        directionality of such an effect differ depending on the forest type involved.
        Keywords: border effect; microbial ecology; microclimate; myxogastrids; slime molds
        Resumen
        Los ecotonos son porciones interesantes del bosque donde los microorganismos pueden ser estudiados
        para efectos de monitoreo de la diversidad. Debido a su ciclo de vida rápido, estos organismos pueden ser
        importantes modelos para comprender la dinámica adaptativa microbiana. El objetivo principal de esta
        investigación fue evaluar la dinámica de los mixomicetes presentes en la capa de hojarasca en diferentes

        Carlos Rojas-Alvarado     carlos.rojasalvarado@ucr.ac.cr, https://orcid.org/0000-0002-7968-4833
        Randall Valverde-González      nototriton@hotmail.com, https://orcid.org/0000-0002-4041-5476
        Stephanie Somerville    stephanie1389@gmail.com, https://orcid.org/0000-0002-5772-9244
        Adam W. Rollins     Adam.Rollins@lmunet.edu, https://orcid.org/0000-0003-4620-4968
        Steven L. Stephenson    slsteph@uark.edu, https://orcid.org/0000-0002-9207-8037
        1 Instituto de Investigaciones en Ingeniería, Universidad de Costa Rica, San José, Costa Rica.
        2 Escuela de Ingeniería de Biosistemas, Universidad de Costa Rica, San José, Costa Rica.
        3 Department of Biology and Cumberland Mountain Research Center, Lincoln Memorial University, Tennessee, United States
        4 Department of Biological Sciences, University of Arkansas, Arkansas, United States

                                                                                                                                 299
DOI: http://dx.doi.org/10.15359/ru.35-1.18
E-ISSN: 2215-3470
CC: BY-NC-ND
sitios asociados con sistemas templados y tropicales, por medio de una estrategia experimental, dentro de
los ecotonos producidos por los bordes boscosos marcados. Con el uso de la técnica de cámara húmeda y
con base en tres indicadores ecológicos (riqueza de especies, diversidad y número de registros, como una
UNICIENCIA Vol. 35, N°. 1, pp. 299-311. January-June, 2021 •
aproximación de abundancia) asociados con la fase reproductiva del ciclo de vida de los mixomicetes, el
presente estudio resume el efecto potencial de ecotonos templados y tropicales en la distribución de estos
organismos. Los datos de 26 sitios en seis países mostraron que todos los indicadores fueron más altos en
ecotonos templados y que la mayoría de las diferencias pueden ser explicadas por efectos ecológicos. La
influencia de estos sobre los mixomicetes fue opuesta en bosques templados y tropicales, pero los datos
acumulados para ambos tipos de bosque mostraron similitudes que pueden ser explicadas por modelos
matemáticos comparables. Estos resultados sugieren que, con los métodos usados acá, los ecotonos afectan
los patrones ecológicos de los mixomicetes, pero la intensidad y la direccionalidad de tal efecto depende
del tipo de bosque.
Palabras clave: efecto de borde; ecología microbiana; microclima; mixogástridos; mohos deslizantes
Resumo
Os ecótonos são parcelas interessantes da floreta em que os micro-organismos podem ser estudados com
o objetivo de monitoramento da diversidade. Devido ao seu rápido ciclo de vida, estes organismos podem
ser importantes modelos para a compreensão da dinâmica adaptativa microbiana. O principal objetivo
www.revistas.una.ac.cr/uniciencia •
desta pesquisa foi avaliar a dinâmica dos mixomicetos presentes na camada de folhagem em diferentes
lugares associados aos sistemas temperados e tropicais, mediante uma estratégia experimental, dentro dos
ecótonos produzidos pelas margens arborizadas marcadas. Com a utilização da técnica de câmara úmida e
com base em três indicadores ecológicos (riqueza de espécies, diversidade e número de registros, como uma
aproximação de abundância) associados à fase reprodutiva do ciclo de vida dos mixomicetos, o presente
estudo resume o efeito potencial de ecótonos temperados e tropicais na distribuição destes organismos.
Os dados de 26 locais em seis países mostraram que todos os indicadores foram mais altos em ecótonos
temperados e que a maioria das diferenças podem ser explicadas por efeitos ecológicos. A influência destes
revistauniciencia@una.cr
sobre os mixomicetos foi oposta em florestas temperados e tropicais, porém os dados acumulados para
ambos os tipos de florestas mostraram semelhanças que podem ser explicadas por modelos matemáticos
comparáveis. Tais resultados sugerem que, com os métodos usados aqui, os ecótonos afetam os padrões
ecológicos dos mixomicetos, mas a intensidade e a direcionalidade de tal efeito depende do tipo de floresta.
Palavras-chave: ecologia microbiana; efeito de margem; microclima; mixogastrídeos; micetozoários
INTRODUCTION percentage of the available ecological in-
formation was not obtained until relatively
Myxomycetes (plasmodial slime recently. In most cases, distributional (e.g.,
molds or myxogastrids) are amoeboid mi- Alexopoulos & Sáenz, 1975; Stephenson et
croorganisms recorded from most ecosys- al., 1993) and taxonomic (e.g., Farr, 1976;
tems and under most ecological conditions Stephenson, 2003) studies were designed
on the planet (Rollins & Stephenson, 2011). and successfully carried out, but only indi-
Although they have been documented since rect ecological data were generated as a by-
the 17th Century (Stephenson, 2011), a large product of the original investigations. More
Carlos Rojas Alvarado • Randall Valverde González • Stephanie Somerville • Adam W. Rollins • 300
Steven L. StephensonDOI: http://dx.doi.org/10.15359/ru.35-1.18
E-ISSN: 2215-3470
CC: BY-NC-ND
recently, despite a similar approach, import- forests and concluded that nutrient avail-
ant contributions using molecular techniques ability and soil conditions influenced the
for detection have increased the resolution of myxomycetes recorded in the different litter
the analyses (i.e., Shchepin et al., 2019). layers. In the tropics, Rojas & Doss (2014)
UNICIENCIA Vol. 35, N°. 1, pp. 299-311. January-June, 2021 •
Consequently, the ecology associated recorded different myxomycete species in
with the formation of reproductive struc- the first 100 m from the forest edge and
tures, an important aspect of the myxomy- concluded that habitat heterogeneity was
cete life cycle in nature, has been moderate- responsible for the results they obtained.
ly, but not completely documented. Fruiting Given these premises and the inter-
bodies are essential for long-distance dis- esting ecological influence of ecotones and
persal and due to inter-phyla interactions, forest edges on macroorganisms (see Kark,
they can provide information on coevolu- 2013), the idea of studying their effect on
tionary processes. Fruiting bodies are the myxomycetes is relevant to understanding
most conspicuous structures in the life cy- the ecology of their reproductive stage.
cle of myxomycetes and a fundamental ex- Since the existence of ecotones is inde-
pression of evolutionary pressures that have pendent of geographical location but not
generated changes at the molecular lev- the level of their effect on organisms, it is
el and expressed them at the reproductive also relevant to include such factors in the
one. In this sense, basic studies generating design of studies. Based on previous stud-
www.revistas.una.ac.cr/uniciencia •
data to understand the dynamics of myxo- ies (e.g., Stephenson, 2011), the contrast
mycetes at higher levels of organization are of myxomycete assemblages between tem-
essential for a more complete interpretation perate and tropical forests has been docu-
of their biology. mented but not necessarily with a common
In most ecological studies of myxo- experimental design. In the case of these or-
mycetes, the idea of ecosystem partitioning ganisms, the occurrence of fruiting bodies
is applied at few levels (i.e., mostly just is likely affected by environmental condi-
substrates), and it is assumed that the dis- tions, which are different between ecotones
tribution of fruiting bodies is probabilisti- or forest edges and the forest core, but the
revistauniciencia@una.cr
cally equivalent for different subsections influence of the ecotone on biodiversity
of the entire ecosystem. In this manner, an parameters has been poorly documented,
ecosystem is conceptualized, at least for particularly within the scope of considering
experimental designs, as a continuum of different geographical areas.
homogeneously distributed myxomycete For those reasons, the main objective
niches, where fruiting bodies may occur at a of this study was to evaluate, using an ex-
given time due to the existence of favorable perimental approach within the ecotones
conditions. However, available data do not produced by sharp forest edges, three eco-
support such an idea. For example, in a tem- logical indicators associated with the myx-
perate forest, Rollins & Stephenson (2012) omycetes present in the leaf litter layer for
separated the leaf litter microhabitat on the different geographical locations represent-
forest floor into four categories and found ing both temperate and tropical forests. This
differences in species richness among these. strategy was designed to provide data at
Stephenson & Landolt (1996) carried out different levels of ecological structure such
a similar study in two different temperate as ecosystem and community, but all within
Carlos Rojas Alvarado • Randall Valverde González • Stephanie Somerville • Adam W. Rollins • 301
Steven L. StephensonDOI: http://dx.doi.org/10.15359/ru.35-1.18
E-ISSN: 2215-3470
CC: BY-NC-ND
the framework of generating information approach for sampling leaf litter on the for-
on the relationships between microorgan- est ground, the only substrate considered in
isms and ecotones for monitoring purposes. this study, took place accordingly, but hab-
According to Smith et al., (1997) and Senft itat partitioning was applied to the study in
UNICIENCIA Vol. 35, N°. 1, pp. 299-311. January-June, 2021 •
(2009), ecotones are dynamic areas of bi- order to test the hypothesis of homogeneity
ological importance, given the underlying in results within the ecotone independent of
mechanisms providing balance in them and geographical locality or spatial placement
thus could be interesting monitoring units (a type of null model) versus the idea of
for climate change in long-term studies. heterogeneity (mechanistic model), as ex-
plained earlier, supported by empirical data.
METHODOLOGY Habitat partitioning took place at
both the horizontal and vertical levels of
The present study was carried out be- sampling. For the first one of these, three
tween 2012 and 2016 in six countries, two conceptual spaces within the ecotone at
characterized by temperate forests and four each location were predetermined and
containing tropical ones. In each country, corresponded with the most external zone
a series of localities was selected based (abbreviated as EXT hereafter, depicting
on geographical position and forest type. the most external ~10 m), an internal zone
Based on Rojas & Stephenson (2007), all (INT, between ~11-21 m ) and a parallel one
www.revistas.una.ac.cr/uniciencia •
localities in tropical countries were situat- to the forest edge (PAR, exactly at 21 m).
ed on mountains, to maximize the proba- The latter was included to test homogeneity
bility of recording similar myxomycetes to at the same distance from the forest edge.
the selected areas in temperate regions. In For the vertical sampling, two types of leaf
all cases, sampled forests were dominated litter were predetermined and corresponded
by trees in the oak family (i.e. Quercus and with top leaf litter (in direct contact with the
Castanopsis) and/or conifers (i.e. Pinus, atmosphere, abbreviated as top) and bottom
Abies and Cupressus), which despite being leaf litter (in contact with soil, abbreviated
as bottom). In each locality, one sample of
revistauniciencia@una.cr
present in different densities, maximized
the probability of recording “temperate” each type of leaf litter was collected at the
myxomycetes. In this manner, all selected forest edge, and following a perpendicular
locations were considered temperate-like path into the forest, seven more double sam-
in terms of forest type. ples (upper and lower litter) were collected
In each locality, a clearly defined edge every 3 m (see Fig. 1, top). In this manner,
separating a forested patch from a non-for- the innermost samples were collected at 21
ested area was used as the main criterion m from the forest edge. At this point, a 90°
for selection. Based on the calculated mag- turn to either right or left, determined ran-
nitude of the edge effect by Zhen & Chen domly, established the direction of a parallel
(2000) and previous results obtained by Ro- path to the forest edge, where seven more
jas & Doss (2014), the edge effect on myx- double samples were collected at the same
omycetes was determined to take place in spatial intervals. The complete collecting
the first 50 m into the forest. In this manner, path resembled the letter L. The external
the ecotone concept, as applied in this study, zone of the ecotone was represented by the
occurred within this zone. The experimental first four double samples, and the internal
Carlos Rojas Alvarado • Randall Valverde González • Stephanie Somerville • Adam W. Rollins • 302
Steven L. StephensonDOI: http://dx.doi.org/10.15359/ru.35-1.18
E-ISSN: 2215-3470
CC: BY-NC-ND
zone by the second four. The parallel zone 10.6013 N, 85.2509 N, 161 m, (5) Costa
was divided into two subzones, the first Rica, Barba Volcano, Porrosatí (BP), a lower
one was represented by the first four dou- montane conifer forest, 10.0852 N 84.1084
ble samples from the turning point, includ- W, 1920 m, (6) Costa Rica, Barba Volcano,
UNICIENCIA Vol. 35, N°. 1, pp. 299-311. January-June, 2021 •
ing the corner (abbreviated as PAR) and the Paso Llano (BL), a lower montane oak for-
second one by the last four double samples est, 10.0920 N, 84.1077 W, 1980 m, (7) Cos-
(CON). The latter positions were included ta Rica, Jardín de Dota (JD), a lower montane
in the design, for normalization of posterior oak forest, 9.7123 N 83.9764 W, 2120 m, (8)
analyses. All temperate forests were visited El Salvador, Montecristo #1 (ES1), a lower
during the spring (March to June), whereas montane pine/oak forest, 14.3866 N 89.3911
tropical ones were sampled in the summer W, 1463 m, (9) El Salvador, Montecristo
(June to August). #2 (ES2), a lower montane pine/oak forest,
14.3935 N 89.3857 W, 1615 m, (10) Hon-
Localities duras, La Tigra #1 (HN1), a lower montane
A total of 26 in-
dividual localities were
surveyed for this study
(Figure 1, bottom). The
www.revistas.una.ac.cr/uniciencia •
13 tropical localities were
selected in Costa Rica, El
Salvador, Honduras, and
Thailand, whereas the
13 temperate ones were
in Switzerland and the
United States. Localities
in tropical mountains in-
cluded: (1) Costa Rica,
revistauniciencia@una.cr
Talamanca, Las Tablas
#1 (LT1), a lower mon-
tane oak forest, 8.9237 N
82.7228 W, 1550 m, (2)
Costa Rica, Talamanca,
Las Tablas #2 (LT2), a
lower montane oak for-
est, 8.9298 N 82.7612
W, 1780 m, (3) Costa
Rica, Miravalles Volca-
no (MV), a premontane Figure 1. Sampling scheme used in the present investigation
wet oak forest, 10.7172 (top) in relation in relation to the forest edge showing relative
N 85.1502 W, 1063 m, distances between sampling points and zones within the
(4) Costa Rica, Salitral ecotone and general map of locations studied (bottom) showing
de Bagaces (SB), a low the tropical and temperate areas.
elevation dry oak forest, Source: own data.
Carlos Rojas Alvarado • Randall Valverde González • Stephanie Somerville • Adam W. Rollins • 303
Steven L. StephensonDOI: http://dx.doi.org/10.15359/ru.35-1.18
E-ISSN: 2215-3470
CC: BY-NC-ND
pine forest, 14.1755 N 87.1334 W, 1490 m, Data collection and analyses
(11) Honduras, La Tigra #2 (HN2), a lower
A total of 780 samples of leaf litter,
montane pine forest, 14.1736 N 87.1330 W,
corresponding to 390 from temperate and
1442 m, (12) Thailand, Doi Suthep (DS), a
UNICIENCIA Vol. 35, N°. 1, pp. 299-311. January-June, 2021 •
390 from tropical localities, were collected
premontane Castanopsis forest, 18.8066 N
during this study. For each sampling point,
98.9103 E, 1136 m and (13) Thailand, New
the leaf litter layer depth was measured with
Waterfall (NW), a premontane Castanopsis
a ruler and the canopy cover was determined
forest, 19.1548 N 98.6918 E, 780 m.
on a 20-100% scale, where 20% correspond-
Temperate localities included: (1)
ed with an open space and 100% with a ful-
Switzerland, Zäziwil (SW), a premontane
ly covered one in a similar manner to Ro-
temperate fir forest, 48.8951 N 7.6729 E, 714
jas & Stephenson (2007). All samples were
m, (2) The USA, Michigan, Edmore (ED),
placed in paper bags and transported to the
a low elevation temperate oak/pine forest,
Engineering Research Institute of the Uni-
43.3943 N 84.9973 W, 308 m, (3) USA,
versity of Costa Rica where they were used
Michigan, Winn (WI), a low elevation tem-
to prepare moist chamber cultures accord-
perate pine forest, 43.5267 N 84.8980 W, 258
ing to the method described by Stephenson
m, (4) USA, Wisconsin, Prairie du Chien #1,
& Stempen (1994). The measurement of pH
(PC1), a low elevation temperate mixed for-
values took place at this point. Climate con-
est, 42.9906 N 91.1176 W, 370 m. 5) USA,
www.revistas.una.ac.cr/uniciencia •
ditions in the designated laboratory area for
Wisconsin, Prairie du Chien #2 (PC2), a low
the myxomycete fruiting bodies to devel-
elevation temperate mixed forest, 42.9864
op in the moist chambers were measured.
N 91.1293 W, 350 m, (6) USA, Tennessee,
These were determined for future studies to
Cumberland Gap #1 (CG1), a low elevation
have a parameter of comparison of condi-
temperate mixed forest, 36.6081 N, 83.6740
tions within the laboratory and correspond-
W, 570 m, (7) USA, Tennessee, Cumberland
ed with an average temperature of 23.6 °C ±
Gap #1 (CG2), Tennessee, a premontane tem-
2.1, air humidity of 73.7% ± 5.4, barometric
perate mixed forest, 36.6065 N, 83.6687 W,
pressure of 879 ± 1.5 hPa and light intensity
710 m, (8) USA, Arkansas, Eureka Springs
revistauniciencia@una.cr
of 162 ± 231 lux. Cultures were maintained
(EU), a low elevation temperate oak forest,
for up to 12 weeks, checked regularly for
36.3926 N 93.7487 W, 390 m, (9) USA,
myxomycetes and water was added to them
Arkansas, Pea Ridge (PR), a low elevation
when necessary to maintain a moist inter-
temperate oak forest, 36.4527 N 94.0009 W,
nal environment. When myxomycetes were
450 m, (10) USA, Florida, Grayton Beach
found in the cultures, fruiting bodies were
#1 (GB1), a low elevation temperate pine
extracted and glued to pasteboard boxes,
forest, 30.3534 N 86.1887 W, 10 m, (11)
identified to morphospecies and deposited
USA, Florida, Grayton Beach #2 (GB2), a
in the Myxogastrid Biorepository of the En-
low elevation temperate pine forest, 30.3523
gineering Research Institute at the Univer-
N 86.1794 W, 12 m, (12) USA, Louisiana,
sity of Costa Rica. Nomenclature followed
Maringouin (MA), a low elevation temperate
Lado (2005-2020).
mixed forest, 30.4211 N 91.5308 W, 5 m and
For analyses, four basic approach-
(13) USA, Louisiana, Alexandria (AL), a low
es were taken using the number of records,
elevation temperate mixed forest, 31.2602 N
species richness and diversity as response
92.6325 W, 80 m.
variables. First, a geographical approach
Carlos Rojas Alvarado • Randall Valverde González • Stephanie Somerville • Adam W. Rollins • 304
Steven L. StephensonDOI: http://dx.doi.org/10.15359/ru.35-1.18
E-ISSN: 2215-3470
CC: BY-NC-ND
was used to test for differences in response using the Shapiro Wilk test, and statistical
variables between temperate and tropical tests were selected as appropriate. Two sam-
regions. With the results from the United ple t-student or Mann-Whitney tests were
States, a second set of geographical analyses carried out to evaluate differences between
UNICIENCIA Vol. 35, N°. 1, pp. 299-311. January-June, 2021 •
considering latitude and longitude were car- temperate and tropical datasets as well as
ried out. The localities surveyed in this case between leaf litter layers, while analyses of
outlined two latitudinal north-south transects variance were conducted to evaluate differ-
in the eastern portion of that country. The ences among results according to the relative
second approach was based on the vertical position within the ecotone. Two and three-
partitioning of the leaf litter microhabitat. In way analyses of variance were used to test
this case, differences in response variables the interaction among region, ecotone zone
were tested between the two types of litter and litter position for each ecological esti-
considered herein. The third approach stud- mator. For all analyses of variance, posterior
ied the relative position of sampling points Tukey tests were carried out to analyze the
within the ecotone using the zones explained differences that existed between two factors.
earlier. The fourth approach evaluated differ- In all cases, the cutoff value for the rejection
ences relative to the sample’s position with- of the null hypothesis was 0.05.
in the ecotone, and only EXT, INT and PAR
were used. The records associated with CON ANALYSIS AND RESULTS
www.revistas.una.ac.cr/uniciencia •
were included later in several post-hoc analy-
ses to test mathematical models of accumula- The three main external variables de-
tion of response variables based on effort and termined during this study were the depth of
normalized deviation within ecotone zones. the leaf litter layer, an estimation of canopy
Models were selected based on high correla- cover, and pH. Differences were found for
tion values (>0.98) and intended for linear or these three variables when temperate and
exponential relationships and deviation was tropical regions were compared, but differ-
evaluated using averages for each dataset. ences were not found among positions with-
For all analyses, statistical tests were
revistauniciencia@una.cr
in the ecotone or litter types within an area.
carried out on JMP v.10 (SAS Institute, Leaf litter depth had an average of 4.9 cm
2007). The number of records and species for temperate forests and 3.7 cm for trop-
richness were obtained directly from the re- ical ones (t=-4.5, d.f.=623, P˂0.0001) and
sults after generating summary tables and canopy cover values were 47% and 51%
the Simpson Diversity Index (reported as (U=1.34, P=0.17). The value of pH was
1-D in this case) was calculated according higher in tropical than in temperate forests
to Magurran (2004). This diversity index with averages of 5.9 and 5.8, respectively
was selected over the more common Shan- (t=2.3, d.f.= 623, P=0.01).
non-Wiener Index because it is much less A total of 519 samples yielded myx-
sensitive to species richness and it is based omycetes in the laboratory. Out of the 780
on dominance over evenness, providing a initially collected, that value represented
more appropriate interpretation for data ob- about 66% of all samples. A higher per-
tained with the technique used herein (moist centage of positive samples was found for
chamber cultures). Normality was evaluat- temperate regions, with an average of 72%
ed for all variables included in the analyses (53-93%) in comparison with the average
Carlos Rojas Alvarado • Randall Valverde González • Stephanie Somerville • Adam W. Rollins • 305
Steven L. StephensonDOI: http://dx.doi.org/10.15359/ru.35-1.18
E-ISSN: 2215-3470
CC: BY-NC-ND
of 61% (40-80%) for those from tropical P˂0.0001) with 8.6 records per sample for
regions. In those positive cultures, a to- temperate localities and 5.3 records per
tal of 625 records of myxomycetes were sample for tropical localities. For temperate
made, out of which 393 (63%) appeared areas, lower species richness was found in
UNICIENCIA Vol. 35, N°. 1, pp. 299-311. January-June, 2021 •
in material from temperate areas and 232 the EXT positions within the ecotone only
(37%) from tropical ones. Similarly, of for the bottom litter samples (F2,9=7.1,
the 71 species recorded in the complete P=0.01). For tropical localities, no differ-
study (see supplementary data), 53 of them ences were found in species richness with-
(74%) were recorded in temperate local- in the ecotone, but some differences were
ities and only 40 (56%) in tropical ones. found between litter types (t=3.7, d.f.=29,
Of those, 31 species were only recorded in P˂0.0008), with more morphospecies in the
temperate areas, 18 in tropical ones and 22 top (6.8 spp. in average) than in the bottom
were shared among the two. layer (average of 3.8). These differenc-
With an average of 30 records per lo- es were not observed across regions, eco-
cality surveyed, the material from temperate tone zones and litter position (F3,3=0.66,
regions yielded more myxomycetes than the P=0.66). For the set from the United States,
material from tropical ones (18 records per some differences were found according to
locality, t=3.57, d.f.=25, P=0.001). This re- litter type (t=2.3, d.f.=29, P˂0.02), with an
sult was evident in the significant differenc- average of 3.7 morphospecies recorded per
www.revistas.una.ac.cr/uniciencia •
es found when the analysis was performed sample from the top layer and 4.9 from the
by litter layer and area, due to the lower bottom one. In this case, species such as
number of records associated with the bot- Didymium squamulosum and Comatricha
tom layer in tropical regions (F3,48=15.1, pulchella were appreciably more common
P=0.0003). In these regions, some common- in the bottom layer.
ly recorded species such as Didymium squa- When the Simpson Index of Diversi-
mulosum and Perichaena depressa, were ty was used to evaluate differences a high-
only found in the top litter layer. Similarly, er average value of 0.81 was recorded in
when the results were analyzed by their rel- temperate localities versus a value of 0.70
revistauniciencia@una.cr
ative position within the ecotone and area, for tropical ones (t=2.7, d.f.= 29, P˂0.008).
differences were found in association with Similar to the other response variables,
a lower number of records in the external some differences were found in the value of
zone of temperate localities and the internal the diversity index associated with samples
zone of tropical ones (F5,67=3.48, P=0.02). from the bottom litter layer in tropical for-
For example, species such as Diachaea sub- ests (average of 0.59 vs. 0.88 for all others;
sessilis, Oligonema schweinitzii and Phys- F3,56=8.1, P= 0.0001). In relation to their
arum globuliferum were recorded only in position within the ecotone, the diversity
the internal parts of the temperate forests. index was lower (average of 0.71) in the
When only the set from the United States upper layer of the EXT zone for temperate
was analyzed, no differences in the number forests (F2,9=12.89, P=0.0009). Diversi-
of records at any level were apparent. ty values also showed overall differences
The average number of morphospe- in models considering region and ecotone
cies recorded per sample was significantly zone (F3,3=19.5, P=0.0001). No differ-
different between groups (t=4.6, d.f.=59, ences were found at any level for tropical
Carlos Rojas Alvarado • Randall Valverde González • Stephanie Somerville • Adam W. Rollins • 306
Steven L. StephensonDOI: http://dx.doi.org/10.15359/ru.35-1.18
E-ISSN: 2215-3470
CC: BY-NC-ND
Table 1. Average values of the three external variables used in the present study and some
of the ecological indicators evaluated arranged by region and zone within the ecotone.
Variable Regions and sampling positions
Tropical Temperate
UNICIENCIA Vol. 35, N°. 1, pp. 299-311. January-June, 2021 •
EXT INT PAR EXT INT PAR
Leaf litter depth, cm 3.25 3.38 4.47 5.25 4.74 4.76
Canopy cover, % 52.2 50.3 49.1 49.7 43.3 47.1
Substrate pH 5.9 6.1 5.8 5.8 5.8 5.8
Number of species (top/bottom) 17.2/10.2 25.2/20.2 9.7/4.5 10.2/14.5 23.5/28.5 17.7/18.7
Number of records (top/bottom) 32.2/13.7 72.2/38.5 32.4/21.8 25.7/34.7 74.5/94.7 31.5/37.7
Simpson Index of Diversity (top/bottom) 0.91/0.86 0.93/0.92 0.86/0.66 0.76/0.83 0.86/0.90 0.91/0.90
Note: derived from research.
Table 2. Fit models explaining the average accumulation of response variables using effort as an
independent variable, by geographical area, calculated using the data from the present investigation.
Response Variable Geographical Model Type Cumulative Fit Model Pearson´s r2
Area
Number of records Temperate Linear y=25.19x+5.3929 0.99
Number of records Tropical Linear y=13.869x-6.0357 0.98
Species richness Temperate Exponential y=37.36(1-e-0.21x) 0.99
Species richness Tropical Exponential y=33.31(1-e-0.15x) 0.99
www.revistas.una.ac.cr/uniciencia •
Diversity Temperate Exponential y=89.19(1-e-2.19x) 0.99
Diversity Tropical Exponential y=87.94(1-e-1.79x) 0.99
Note: derived from research.
forests, for the set from the United States or maintained when either species richness or
for the combined model of region, ecotone diversity were analyzed. In these cases, the
zone and litter position. rate of function growth, explained by the
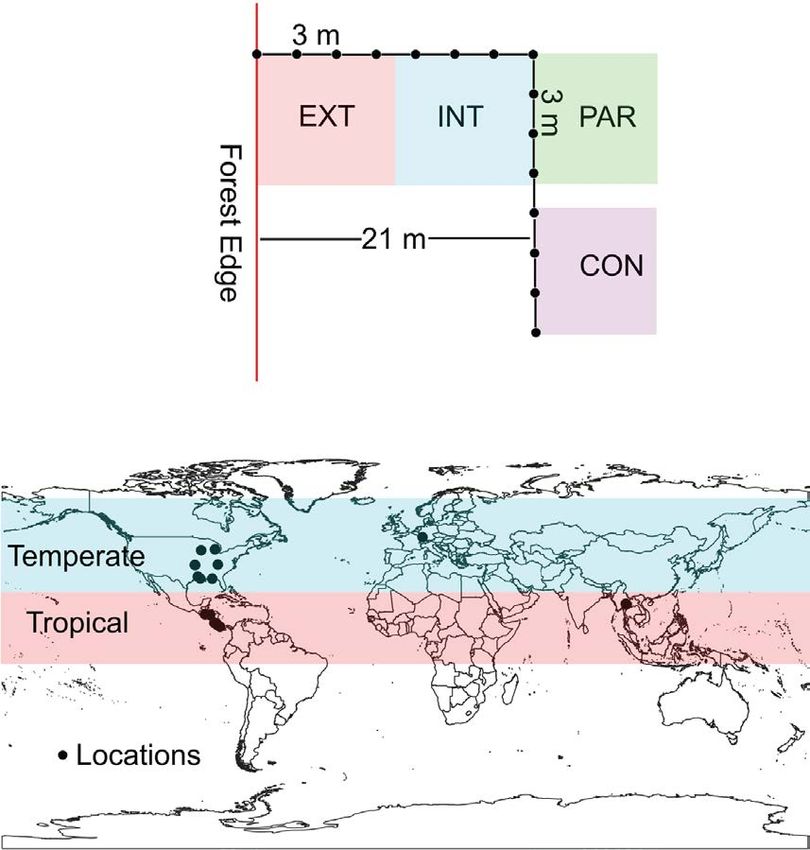
Based on the cumulative models of value multiplying the independent variable
response variables determined with the data (x), was always higher for temperate regions
(Table 2), sampling effort in temperate areas and the values for the temperate/tropical
revistauniciencia@una.cr
could yield 1.7 more records of
myxomycetes using field-based
methods and morphospecies
than the same effort produced
in tropical forests. In the case
of records, such a value repre-
sented the relationship between
slope values of the two equa-
tions determined in the pres-
ent study from averages of the
two paths from the forest edge
(Figure 2), but also matched the
relationship between records Figure 2. Patterns of record accumulation for the
per geographical region. Inter- perpendicular and parallel sampling points in both
estingly, the same pattern was temperate and tropical areas found in this study.
Source: own data.
Carlos Rojas Alvarado • Randall Valverde González • Stephanie Somerville • Adam W. Rollins • 307
Steven L. StephensonDOI: http://dx.doi.org/10.15359/ru.35-1.18
E-ISSN: 2215-3470
CC: BY-NC-ND
relationships were 1.4 and 1.2 for species zones and that for temperate forests, spe-
richness and diversity, respectively. For the cies richness and diversity were higher in
United States dataset, results showed that the outer zones of the forest. For the dataset
the western transect (WY-AR-LA) accumu- from the United States, no differences were
UNICIENCIA Vol. 35, N°. 1, pp. 299-311. January-June, 2021 •
lated records 1.2 times more rapidly than found between the patterns of each transect
the eastern transect (MI-TN-FL). and the general trends for temperate forests.
Using the two significant combina-
tions in the diversity analysis, the model DISCUSSION AND
constructed with the diversity values asso- CONCLUSIONS
ciated with the bottom litter layer in tropi-
cal regions showed a function growth value The results from the research described
of 1.33, which was 0.74 times that of tropi- herein showed that ecotones in temperate and
cal forests and 0.60 times that of temperate tropical forests differed not only in terms of
forests. Similarly, the function growth val- myxomycete species present but also in the
ue associated with the upper litter layer in intensity at which they affect the ecology of
the EXT zone of temperate for-
ests (1.35) was 0.61 times the
value calculated for temperate
forests, 0.70 times the value
www.revistas.una.ac.cr/uniciencia •
obtained for the EXT position
(1.88) and 0.64 times the value
of the PAR position in temper-
ate regions (2.05).
When the deviation of
response variables in each ec-
otone zone was evaluated, re-
sults showed similar patterns
for species richness and diver-
revistauniciencia@una.cr
sity. Both indicators displayed
an increasing trend from the
EXT zone (first 10 m from the
forest edge) to the PAR zone (at
21 m from the forest edge) for
tropical forests (Figure 3). Data
for temperate forests showed
the opposite trend, with de-
creasing trends towards the in-
ternal zones (INT and PAR) of
the forest for both indicators.
Figure 3. Pattern of species richness (top) and species
These results suggested that
diversity (bottom) deviation from the average for the
in tropical forests, there were
EXT-INT-PAR sequence of zones in temperate and tropical
more species and higher diver-
areas. The correlation values for the trends are shown.
sity than average in the internal Source: own data.
Carlos Rojas Alvarado • Randall Valverde González • Stephanie Somerville • Adam W. Rollins • 308
Steven L. StephensonDOI: http://dx.doi.org/10.15359/ru.35-1.18
E-ISSN: 2215-3470
CC: BY-NC-ND
these organisms. Even though this research as well for the determination of ecological
was limited to one substrate type and the iden- patterns in ecotones. For instance, compet-
tification of taxa was morphological, there itive interactions between plasmodia of dif-
seems to be a clear opposite effect pattern ferent species, specific vectors of reproduc-
UNICIENCIA Vol. 35, N°. 1, pp. 299-311. January-June, 2021 •
from the forest edge on the assemblages of tive propagule dispersion and suitability of
myxomycetes present in temperate and trop- plants for the formation of fruiting bodies,
ical forests. Such effect was also observed at could be relevant. All these three examples
the litter layer, demonstrating that ecological have the ability to modify the intensity of
partitioning, as a basis for ecological project spatial mass effects (distribution of repro-
design, has the potential of pointing out some ductive mass for a species within a deter-
undocumented patterns for myxomycetes. mined landscape), commonly occurring in
Even though the three ecological vari- ecotones (see Walker et al., 2003). Such an
ables determined in this study (species rich- effect could be a factor linked to the results
ness, diversity and number of records as a of myxomycete projects using the method-
proxy for abundance) were different between ology of the present study.
geographical regions, which could explain The results from this research seem to
some of the differences in myxomycete as- indicate that data accumulation did not dif-
semblages, they seemed insufficient to explain fer from a basic probabilistic model (since
the differences between litter types or within there was a steady accumulation of records
www.revistas.una.ac.cr/uniciencia •
ecotone zones. Differences between temper- in all cases), which at the same time pro-
ate and tropical regions could be the product vided evidence that the studied forest eco-
of the biogeographical and macroecologi- tones, as part of the forests in which they
cal patterns of myxomycetes (Stephenson et occurred, were suitable habitats for myxo-
al.,1993; Dagamac et al., 2017). However, at mycetes. However, these results were lim-
the substrate and ecotone level, it seems more ited in providing support for hypothetical
likely that other abiotic factors such as soil additive blending or a potential ecotonal
and litter chemistry, topographic or hydrologi- assemblage of myxomycetes in the locali-
cal features and even climate (see Senft, 2009) ties where the present study was carried out.
revistauniciencia@una.cr
could explain some of the results found in the Even though this is a partial result of the
present study. Also, the intrinsic limitations of limited experimental design applied to the
the sampling methodology, where phenology present investigation, it provides an idea for
could also have an effect on recorded patterns, future research. Previous studies may con-
should be considered. However, since there tain data in such a direction (e.g., Rollins
are few studies (at least that we are aware of) & Stephenson, 2012; Rojas & Doss, 2014),
formally and robustly addressing such topic but they are limited in the level of biosystem
on myxomycetes; at this point, the potential variability included in the original design,
confounding effect between sampling time in with one common sampling methodology.
each forest type may actually be unsubstanti- One aspect to carefully consider in these
ated by empirical evidence. analyses, is that the linear or exponential re-
Despite the latter, any type of biotic lationships observed are only valid at low
interactions among species of myxomycetes sampling effort levels (i.e. in the growing
and between myxomycetes and other organ- part of a species accumulation curve), when
isms are valuable and should be considered curves have not flattened yet.
Carlos Rojas Alvarado • Randall Valverde González • Stephanie Somerville • Adam W. Rollins • 309
Steven L. StephensonDOI: http://dx.doi.org/10.15359/ru.35-1.18
E-ISSN: 2215-3470
CC: BY-NC-ND
The observed deviations of both spe- their context. For monitoring purposes in a
cies richness and diversity by ecotone zone rapidly changing world, these types of basic
clearly demonstrated that, on the basis of studies are still imperative.
the hypotheses being tested in this study, a
UNICIENCIA Vol. 35, N°. 1, pp. 299-311. January-June, 2021 •
mechanistic explanation of biological pat- ACKNOWLEDGEMENTS
terns was more appropriate. Within each
forest type, differences in the three response We would like to thank Robin Doss,
variables used in the analyses, as well as in Donna Doss, Viern Snively, Margarita Al-
the species assemblages, were recorded for varado, Martin and Susana Rüegsegger,
the litter layers considered herein, and some Thida Win Ko Ko, Benjamin Longworth,
differences were found for the ecotone zones Ricardo Morales and Pedro Rojas for help
as well. Forest edges have been document- in the field. Funding for laboratory work
ed to affect microorganisms in tropical for- was provided by University of Costa Rica´s
ests by means of increased desiccation and Vicerrectoría de Investigación (Projects
altered nutrient cycling in the soil (Beni- 731-B5-062 and 731-B7-721).
tez-Malvido & Arroyo-Rodríguez, 2008), a
model compatible with the results from the AUTHOR CONTRIBUTION
tropical regions in the present study. How-
STATEMENT
ever, for temperate forests, a different sys-
www.revistas.una.ac.cr/uniciencia •
tem of mechanisms seems more suitable,
The total contribution percentage for
perhaps related to some functional advan-
the conceptualization, preparation, and cor-
tage at the vegetative stage in outer zones
rection of this paper was as follows: C.R.A.
of the forest. In any case, temperate forests
30%, R.V.G. 20%, S.S.Z. 20%, A.W.R.
represent excellent candidates for testing
15%, S.L.S. 15%.
the idea of enhanced ecotone diversity by
means of ecotonal assemblages.
In a similar manner to the results from DATA AVAILABILITY
Dagamac et al., (2017), where the moderate STATEMENT
revistauniciencia@una.cr
endemicity model of protist biogeography
was found to explain large-scale biogeo- The data supporting the results of this
graphical differences, a similar mechanism study is available as “supplementary files”
may be shaping myxomycete assemblag- on the Uniciencia website.
es at smaller scales. Rollins & Stephenson
(2012) had already pointed out that the scale REFERENCES
of analysis for myxomycete studies should
be revisited methodologically, and empirical Alexopoulos, C. J. & Sáenz, J. R. (1975). The Myxomy-
cetes of Costa Rica. Mycotaxon 2, 223–271.
(albeit unpublished) data have been collect-
Benítez-Malvido, J. & Arroyo-Rodríguez, V. (2008).
ed recently showing support for the same Habitat fragmentation, edge effects and biologi-
idea. The present investigation has provided cal corridors in tropical ecosystems. In: K. Del
more data showing that ecological studies Claro, P.S. Oliveira, V. Rico-Gray, A. Ramirez,
on myxomycetes are particularly useful to A.A. Almeida, A. Bonet, F.R. Scarano, F.L.
Consoli, F.J. Morales, J. Naoki, J.A. Costello,
provide information on the group and on the
M.V. Sampaio, M. Quesada, M.R. Morris, M.
interactions between these organisms and Palacios, N. Ramirez, O. Marcal, R.H. Ferraz,
Carlos Rojas Alvarado • Randall Valverde González • Stephanie Somerville • Adam W. Rollins • 310
Steven L. StephensonDOI: http://dx.doi.org/10.15359/ru.35-1.18
E-ISSN: 2215-3470
CC: BY-NC-ND
R.J. Marquis, R. Parentoni, S.C. Rodriguez, Shchepin, O. N., Schnittler, M., Erastova, D. A., Pri-
U. Luttge (Eds.), Encyclopedia of Life Support khodko, I. S., Borg Dahl, M., Azarov, D. V.,
Systems (EOLSS). Eolss Publishers. Chernyaeva, E. N., & Novozhilov, Y. K. (2019).
Dagamac, N. H.; Novozhilov, Y. K.; Stephenson, S. Community of dark-spored myxomycetes
L.; Lado, C.; Rojas, C.; dela Cruz. T. E.; Unter- in ground litter and soil of taiga forest (Nizh-
UNICIENCIA Vol. 35, N°. 1, pp. 299-311. January-June, 2021 •
seher, M. & Schnittler, M. (2017). Biogeogra- ne-Svirskiy Reserve, Russia) revealed by DNA
phical assessment of myxomycete assembla- metabarcoding. Fungal Ecology, 39, 80-93. ht-
ges from Neotropical and Asian Palaeotropical tps://doi.org/10.1016/j.funeco.2018.11.006
forests. Journal of Biogeography, 44, 1524– Smith, T. B.; Wayne, R. K.; Girman, D. J. & Bruford, M.
1536. https://doi.org/10.1111/jbi.12985 W. (1997). A role for ecotones in generating ra-
Farr, M.L. (1976). Flora Neotropica Monograph No. inforest biodiversity. Science, 276, 1855–1857.
16 (Myxomycetes). New York: New York Bo- https://doi.org/10.1126/science.276.5320.1855
tanical Garden. Stephenson, S. L. & Landolt, J. C. (1996). The verti-
Kark, S. (2013). Ecotones and Ecological Gradients. In: cal distribution of dictyostelids and myxomy-
Leemans, R. (Ed.), Ecological Systems. Springer. cetes in the soil/litter microhabitat. Nova
https://doi.org/10.1007/978-1-4614-5755-8_9 Hedwigia, 62, 105–117.
Lado, C. (2005-2020). An on line nomenclatural Stephenson, S. L. & Stempen, H. (1994). Myxomy-
information system of Eumycetozoa. Real cetes: a handbook of slime molds. Portland,
Jardín Botánico, CSIC. Madrid, Spain. http:// Oregon: Timber Press.
www.nomen.eumycetozoa.com Stephenson, S. L. (2003). Myxomycetes of New
Magurran, A.E. (2004). Measuring biological diver- Zealand. Hong Kong: Fungal Diversity Press.
sity. Oxford: Blackwell Publishing. Stephenson, S. L. (2011). From morphological to mo-
www.revistas.una.ac.cr/uniciencia •
Rojas, C. & Doss, R.G. (2014). Does habitat loss affect lecular: studies of myxomycetes since the pu-
tropical myxomycetes? Mycosphere, 5(5), 692– blication of the Martin and Alexopoulos (1969)
700. https://doi.org/10.5943/mycosphere/5/5/11 monograph. Fungal Diversity, 50, 21–34. ht-
Rojas, C. & Stephenson, S.L. (2007). Distribution tps://doi.org/10.1007/s13225-011-0113-1
and ecology of myxomycetes in the high-ele- Stephenson, S. L., Kalyanasundaram, I. & Lakhanpal,
vation oak forests of Cerro Bellavista, Costa T. N. (1993). A comparative biogeographical
Rica. Mycologia, 99, 534–543. https://doi.org study of myxomycetes in the mid-Appala-
/10.1080/15572536.2007.11832547 chians of eastern North America and two re-
Rollins, A.W. & Stephenson, S.L. (2011). Global gions of India. Journal of Biogeography, 20(6),
distribution and ecology of myxomycetes. 645–657. https://doi.org/10.2307/2845520
Current Topics in Plant Biology, 12, 1–14. Walker, S.; Wilson, J. B.; Steel, J.; Rapson, G. L.;
revistauniciencia@una.cr
Rollins, A.W. & Stephenson, S.L. (2012). Myxogas- Smith, B.; King, W. McG.; Cottam, Y. H.
trid distribution within the leaf litter microha- (2003). Properties of ecotones: evidence from
bitat. Mycosphere, 3(5), 543–549. https://doi. five ecotones objectively determined from a
org/10.5943/mycosphere/3/5/2 coastal vegetation gradient. Journal of Vege-
SAS Institute. (2007). JMP version 10 [Internet web- tation Science, 14(4), 579–590. https://doi.
site]. http://www.jmp.com org/10.1111/j.1654-1103.2003.tb02185.x
Senft, A. R. (2009). Species diversity patterns at Zhen, D. & Chen, J. (2000). Edge effects in frag-
ecotones. (M.Sc. Thesis), University of North mented landscapes: a generic model for deli-
Carolina at Chapel Hill, Chapel Hill, North neating area of edge influences (D-AEI). Eco-
Carolina, USA. Retrieved from http://labs. logical Modelling, 132, 175–190. https://doi.
bio.unc.edu/Peet/theses/Senft_MS_2009.pdf org/10.1016/S0304-3800(00)00254-4
Myxomycetes within ecotones in temperate and tropical forests (Carlos Rojas Alvarado •
Randall Valverde González • Stephanie Somerville • Adam W. Rollins • Steven L. Stephen-
son) Uniciencia is protected by Attribution-NonCommercial-NoDerivs 3.0 Unported (CC
BY-NC-ND 3.0)
Carlos Rojas Alvarado • Randall Valverde González • Stephanie Somerville • Adam W. Rollins • 311
Steven L. StephensonYou can also read