Dynamic modelling of weathering rates - the benefit over steady-state modelling - SOIL journal
←
→
Page content transcription
If your browser does not render page correctly, please read the page content below
SOIL, 5, 33–47, 2019

                                                                                                        SOIL
https://doi.org/10.5194/soil-5-33-2019
© Author(s) 2019. This work is distributed under
the Creative Commons Attribution 4.0 License.

       Dynamic modelling of weathering rates – the benefit over
                      steady-state modelling
                               Veronika Kronnäs1 , Cecilia Akselsson1 , and Salim Belyazid2
            1 Department   of Physical Geography and Ecosystem Science, Lund University, 223 62 Lund, Sweden
                   2 Department  of Physical Geography, Stockholm University, 106 91 Stockholm, Sweden
                           Correspondence: Veronika Kronnäs (veronika.kronnas@nateko.lu.se)

                                    Received: 12 July 2018 – Discussion started: 8 August 2018
                       Revised: 27 November 2018 – Accepted: 6 December 2018 – Published: 21 January 2019

       Abstract. Weathering rates are of considerable importance in estimating the acidification sensitivity and recov-
       ery capacity of soil and are thus important in the assessment of the sustainability of forestry in a time of changing
       climate and growing demands for forestry products. In this study, we modelled rates of weathering in mineral
       soil at two forested sites in southern Sweden included in a monitoring network, using two models. The aims were
       to determine whether the dynamic model ForSAFE gives comparable weathering rates to the steady-state model
       PROFILE and whether the ForSAFE model provided believable and useful extra information on the response of
       weathering to changes in acidification load, climate change and land use.
          The average weathering rates calculated with ForSAFE were very similar to those calculated with PROFILE
       for the two modelled sites. The differences between the models regarding the weathering of certain soil layers
       seemed to be due mainly to differences in calculated soil moisture. The weathering rates provided by ForSAFE
       vary seasonally with temperature and soil moisture, as well as on longer timescales, depending on environmental
       changes. Long-term variations due to environmental changes can be seen in the ForSAFE results, for example,
       the weathering of silicate minerals is suppressed under acidified conditions due to elevated aluminium concentra-
       tion in the soil, whereas the weathering of apatite is accelerated by acidification. The weathering of both silicates
       and apatite is predicted to be enhanced by increasing temperature during the 21st century. In this part of southern
       Sweden, yearly precipitation is assumed to be similar to today’s level during the next forest rotation, but with
       more precipitation in winter and spring and less in summer, which leads to somewhat drier soils in summer but
       still with increased weathering. In parts of Sweden with a bigger projected decrease in soil moisture, weathering
       might not increase despite increasing temperature.
          These results show that the dynamic ForSAFE model can be used for weathering rate calculations and that
       it gives average results comparable to those from the PROFILE model. However, dynamic modelling provides
       extra information on the variation in weathering rates with time and offers much better possibilities for scenario
       modelling.

1   Introduction                                                    pine, together with birch and a few other deciduous trees.
                                                                    Forests are one of Sweden’s most important natural resources
Most parts of Sweden are covered with glacial till, com-            and are used for timber (32 million m3 yr−1 in 2013; Chris-
posed largely of slowly weathering minerals of granitic ori-        tiansen, 2014), pulp wood (31 million m3 yr−1 in 2013) and
gin, the type of rugged landscape with mostly very shallow          biomass for energy production (6 million m3 yr−1 in 2013).
soil depth, as described in Krabbendam and Bradwell (2014).         The last is especially important due to the need to replace
This makes both soils and lakes sensitive to acidification.         fossil fuels with renewable sources of energy (Chu and Ma-
Two thirds of Sweden is covered by boreal and northern tem-         jumdar, 2012). Forests and their soil also determine the water
perate forest, mostly consisting of Norway spruce and Scots

Published by Copernicus Publications on behalf of the European Geosciences Union.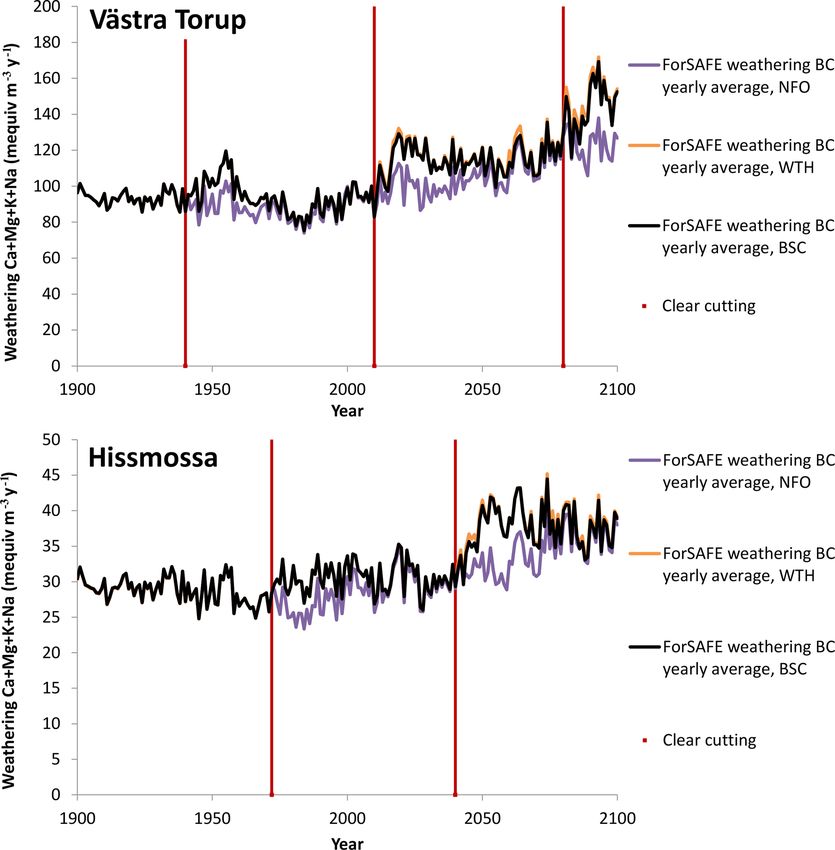
34                                                                 V. Kronnäs et al.: Dynamic modelling of weathering rates

quality of most lakes and streams, since the catchments of        2     Methods
most lakes are forested, and surface water is filtered through
forest soils.                                                     The PROFILE and ForSAFE models were applied to two
   During the 1960s, lakes in Scandinavia became increas-         spruce forest sites in southernmost Sweden, Västra Torup
ingly acidified (Odén, 1968). The cause of this was found to      and Hissmossa, included in the Swedish Throughfall Mon-
be air pollution in the form of atmospheric sulphur and nitro-    itoring Network (SWETHRO; Pihl Karlsson et al., 2011;
gen (Overrein, 1972), much of it from fossil fuel combustion.     IVL, 2019). Different scenarios for the input parameters were
The regions most severely affected were those with high de-       modelled with ForSAFE. ForSAFE-modelled weathering for
position of acidifying substances on shallow soils containing     the base scenario was averaged over the 21st century forest
base-cation-poor minerals with low weathering rates and re-       rotation and compared with PROFILE-modelled weathering.
leases of base cations (i.e. calcium, magnesium, potassium        The weathering rates from the different scenarios from the
and sodium; Galloway et al., 1983). In 1979, the Convention       ForSAFE model were examined in detail.
on Long-Range Transboundary Air Pollution (CLRTAP) was
formulated by the United Nations Economic Commission for          2.1    PROFILE
Europe (UNECE). CLRTAP was extended by the addition of
several protocols for the mitigation of air pollutants, where     The PROFILE model is a steady-state mechanistic biogeo-
participating countries were urged to submit data on emis-        chemistry model, developed at Lund University in the 1990s
sions of pollutants and ecosystem sensitivity. A need thus        (Sverdrup and Warfvinge, 1993; Warfvinge and Sverdrup,
emerged for ways of assessing ecosystem sensitivity, and dif-     1995). It has been widely used for calculations of critical
ferent methods of estimating critical loads of acidity for sul-   loads of acidification, weathering rates and sustainability of
phur and nitrogen for forest and lake ecosystems were devel-      forestry in Europe (including on Iceland with its very differ-
oped (Sverdrup and Warfvinge, 1995). One of these was the         ent mineralogy), North America and East Asia, and has even
PROFILE model, developed by researchers at Lund Univer-           been applied to agricultural land (Akselsson et al., 2016; Er-
sity during the 1990s (Sverdrup and Warfvinge, 1993; Sver-        landsson et al., 2016; Phelan et al., 2014; Fumoto et al., 2001;
drup et al., 2005).                                               Holmqvist et al., 2003; Stendahl et al., 2013). The ecosys-
   CLRTAP led to a considerable reduction in the emission         tem in PROFILE is represented by a soil profile divided into
of acidifying pollution, and lakes and soils in large parts of    layers, each with its own chemical and physical properties,
acidified areas in Europe slowly started to recover (Engardt et   to which water, nutrients and pollutants are added via atmo-
al., 2017; Garmo et al., 2014; Johnson et al., 2018). However,    spheric deposition and litterfall from trees and from which
acidifying pollution is still a large and increasing problem in   water, nutrients and pollutants are removed via uptake by
some parts of the world, for example, in Southeast Asia (Cho      trees and downward leaching. Chemical equilibrium reac-
et al., 2016). Forestry is also a potentially acidifying prac-    tions and weathering take place in the soil profile. Weath-
tice, as buffering base cations are removed during the harvest    ering is modelled using transition state theory, and the pa-
(Farley and Werritty, 1989; Akselsson et al., 2016; Zetterberg    rameters affecting it are soil temperature, soil moisture, min-
et al., 2013). Furthermore, as the demand for forest products     eralogy, soil texture, expressed as the exposed mineral sur-
is growing, while both climate conditions and atmospheric         face area, soil density, and the concentrations of H+ , organic
deposition are changing, there is an increasing need to eval-     ligands and carbon dioxide as well as the concentrations of
uate the sensitivity of forest soils and the weathering of base   inhibitors, namely base cations (Ca, Mg, K and Na), Al3+
cations in greater detail, as an aid in forestry planning and     (products of the weathering reaction) and organic acids.
regulation. The dynamic ecosystem model ForSAFE (Wall-
man et al., 2005; Belyazid et al., 2006), which consists of a     2.2    ForSAFE
dynamic development of the PROFILE model, together with
models for tree growth and decomposition, has the potential       The ForSAFE model consists of a dynamic development,
to do this.                                                       SAFE, of the PROFILE model (Alveteg et al., 1995; Martins-
   The aims of this study were the following:                     son et al., 2005), together with the DECOMP model of the
                                                                  decomposition of soil organic matter (Wallman et al., 2006;
  – to investigate whether ForSAFE gives comparable
                                                                  Walse et al., 1998), the PnET model of tree growth (Aber and
    weathering rates to those estimated with the PROFILE
                                                                  Federer, 1992) and the hydrological PULSE model (Lind-
    model and to explain the results based on differences in
                                                                  ström and Gardelin, 1992). ForSAFE was developed to better
    the formulation of the models; and
                                                                  model the process of recovery from acidification and the ef-
  – to investigate the seasonal, inter-annual and decadal         fects on ecosystems of forestry and climate change, with dy-
    weathering dynamics provided by ForSAFE for differ-           namic feedbacks between soil chemistry and forest growth.
    ent scenarios, representing the important ecological is-      Many parameters used as input data in the PROFILE model
    sues of acidification, climate change and nutrient re-        are modelled by the ForSAFE model. These include runoff,
    moval through land use.                                       soil moisture, decomposition of litter and the uptake of nu-

SOIL, 5, 33–47, 2019                                                                           www.soil-journal.net/5/33/2019/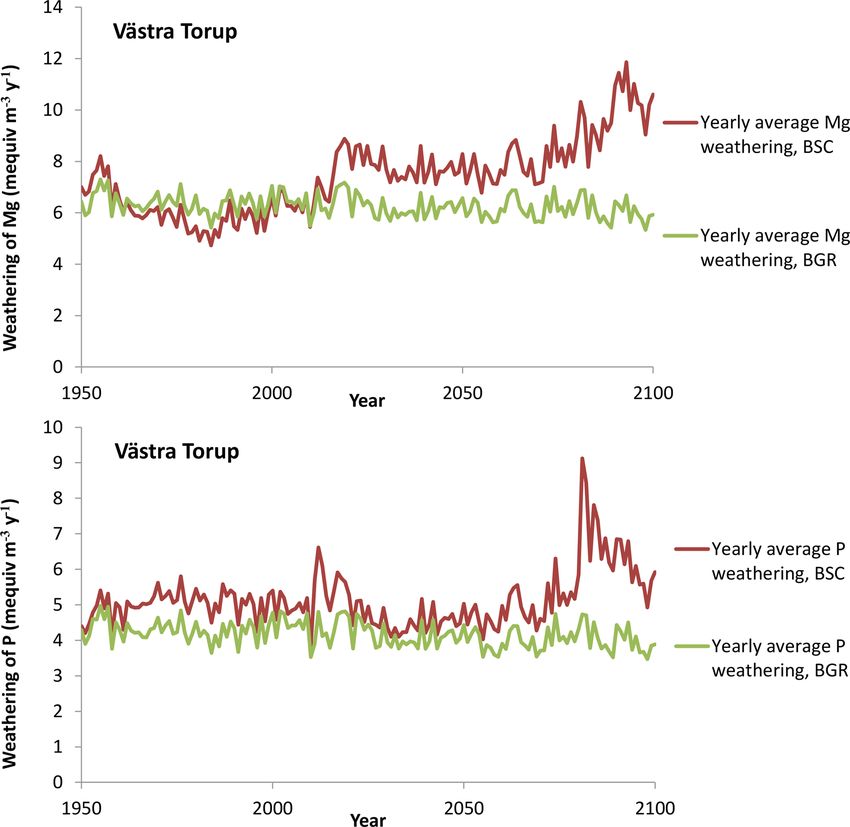
V. Kronnäs et al.: Dynamic modelling of weathering rates                                                                              35

trients by trees. The model is being continuously developed              2.4   Scenarios and time series of driver parameters
(Belyazid et al., 2011; Phelan et al., 2016; Zanchi et al., 2014;
                                                                         ForSAFE uses time series of climate parameters, forest man-
Yu et al., 2016; Rizzetto et al., 2016; Gaudio et al., 2015). In
                                                                         agement, and the deposition of atmospheric pollutants and
this study, a ForSAFE version with monthly time steps was
                                                                         base cations to the site. A set of these time series, from 1900
used.
                                                                         to 2100, is called a scenario here. The purpose of the different
                                                                         scenarios used in this study is to investigate how ForSAFE-
2.3   Site descriptions                                                  modelled weathering rates responded to changes in the driv-
                                                                         ing parameters. Thus, the scenarios used consist of a base
The characteristics of the two SWETHRO sites, at Väs-
                                                                         scenario (BSC); four scenarios in which one aspect of the en-
tra Torup and Hissmossa, are presented in Tables 1 and 2.
                                                                         vironment differs from the BSC scenario; and a background
SWETHRO is a Swedish network started in the 1980s to
                                                                         scenario (BGR) without forestry, acidification and climate
monitor deposition of acidifying substances to Swedish man-
                                                                         change.
aged forest and how the forest and forest soil are affected by
                                                                            The BSC scenario represents the actual drivers at the sites
the deposition. Each site consists of a 30 m × 30 m square
                                                                         from 1900 to today, followed by a reasonably realistic future
plot in a forest stand, where throughfall deposition is mea-
                                                                         scenario to the year 2100 with regards to forestry manage-
sured every month, and soil water chemistry parameters are
                                                                         ment, climate and deposition. This scenario has been used by
measured with lysimeters at a depth of 50 cm three times
                                                                         Zanchi et al. (2014). The future climate is based on a high-
per year, at Västra Torup since 1996 and at Hissmossa since
                                                                         CO2 -emission scenario (SRESA2, modelled with ECHAM5:
2010. Open field deposition is measured near the stands. Soil
                                                                         Nakićenović et al., 2000; Roeckner et al., 2006), with an ap-
chemistry, texture and other properties as well as forest pa-
                                                                         proximately exponentially increasing temperature during the
rameters have been measured previously (Tables 1 and 2).
                                                                         21st century. Annual precipitation is almost unaffected by
   Västra Torup has previously been modelled by Belyazid
                                                                         the climate change in this scenario for this part of Sweden
et al. (2006) with an earlier version of the ForSAFE model,
                                                                         up to 2080, after which it increases, but only by about 8 %.
using less detailed input data. Zanchi et al. (2014) have also
                                                                         The distribution of precipitation during the year changes af-
modelled this site using the same version of ForSAFE as in
                                                                         ter 2050, with more precipitation during winter and spring
the present study, as well as most of the input data, with the
                                                                         and less during summer. Past and future forest management
aim of describing changes in forest ecosystem services in a
                                                                         of the sites in the BSC scenario is based on normally, but
changing climate.
                                                                         not intensively, managed forestry in Sweden today, with two
   The forest at Västra Torup was clear cut in 2010, and the
                                                                         thinnings (at approximately 30 and 45 years after planting)
site at Hissmossa, 5 km to the north, was introduced into
                                                                         and clear cuttings approximately every 70 years, where only
SWETHRO as a replacement site. Hissmossa has previously
                                                                         stem wood is removed. The deposition of pollutants and base
been modelled with ForSAFE, with the aim of explaining
                                                                         cations is based on data from the EMEP programme (Simp-
why this site shows continuously elevated concentrations of
                                                                         son et al., 2012), with SOx deposition peaking in 1970 and
nitrate in soil water while Västra Torup did not, prior to clear
                                                                         decreasing sharply after that and nitrogen deposition peaking
cutting. Hissmossa has courser, very sandy soil. Both soils
                                                                         in 1985, with a smaller decrease after that. Future deposition
are high in quartz and feldspar. Both sites are highly produc-
                                                                         is assumed to be constant after 2020.
tive sites for Norway spruce but were probably grazing lands
                                                                            Five scenarios were compared with the BSC scenario,
up to the beginning of the 20th century. The soils are assessed
                                                                         where climate, deposition or forest management were
as transition types.
                                                                         changed (for the whole or part of the period 1900–2100),
   The soil parameters used in the modelling are given in Ta-
                                                                         while the other input parameters were as in the BSC scenario.
ble 3. Values of the field capacity and wilting point were cal-
                                                                         The scenarios were the following:
culated using the equations given by Balland et al. (2008).
Mineral content was calculated from total soil chemistry data              – BSC is the base scenario, as described above.
using A2M, a mathematical model that uses total chemistry
                                                                           – NFO has neither thinning nor clear cutting between
of the soil samples to come up with possible mineral compo-
                                                                             1900 and 2100. Deposition and climate change are as
sitions (Posch and Kurz, 2007). For the uppermost organic
                                                                             in BSC.
layers, minerals and texture from the second layers were
used, since there are no texture analyses for the organic lay-             – WTH has whole-tree harvest at the clear cutting and
ers, and the total chemistry analyses of the organic layers                  thinning from 2010. Deposition and climate change are
include the ash of the organic matter. The soil moisture input               as in BSC.
value for PROFILE is an estimated site-specific value based
                                                                           – NAC has no increase in acidifying deposition after
on observations at the sites. In this case the soil moisture
                                                                             1900. Forestry and climate change are as in BSC.
value is equal at both sites: 0.2 m3soil water volume m−3
                                                       soil volume for
all layers. The fraction of stones in the soils is also estimated          – NCC has no increase in temperature between 1950 and
at the time of the soil sampling.                                            2100. Forestry and deposition are as in BSC.

www.soil-journal.net/5/33/2019/                                                                                  SOIL, 5, 33–47, 2019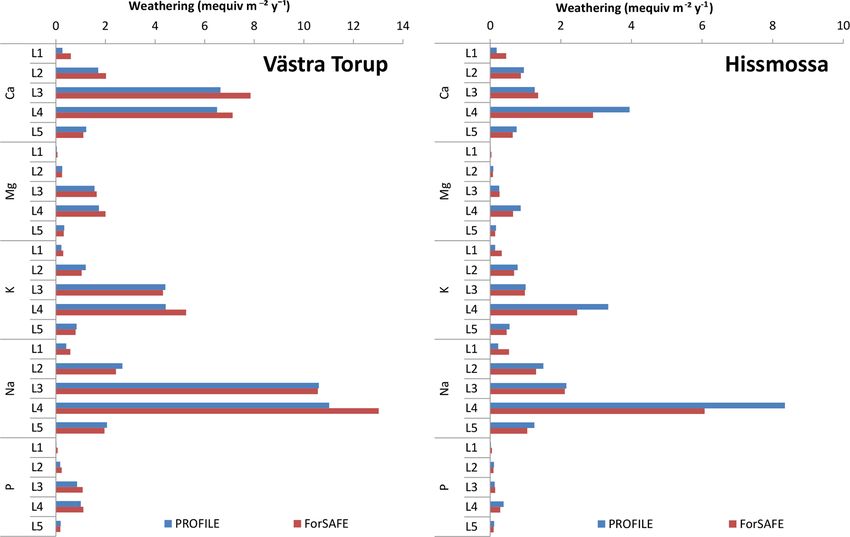
36                                                                     V. Kronnäs et al.: Dynamic modelling of weathering rates

Table 1. Characteristics of the two sites.

                                                                            Västra Torup        Hissmossa
                             Coordinates (◦ N, ◦ E)                        56.135, 13.510   56.181, 13.515
                             Active Years                                     1988–2010        2010–today
                             Year of planting                                        1941             1973
                             Year of clear cutting                                   2010                –
                             Standing stem biomass (g m−2 )                 18 841 (2010)    10 559 (2011)
                             (year in parenthesis)
                             Measured throughfall
                             Precipitation (mm yr−1 )                           430–780           460–730
                             S deposition (kg ha−1 yr−1 )                        4.5–27∗           3.6–6.9
                             N deposition (kg ha−1 yr−1 )                         6.2–12            6.8–11
                             Cl deposition (kg ha−1 yr−1 )                         21–50            33–87
                             Ca + Mg + Na + K deposition (kg ha−1 yr−1 )           31–57            39–80
                             Measured soil water chemistry
                             pH                                                   4.4–4.9          4.2–4.5
                             SO4 -S (mg L−1 )                                     0.8–7.3          2.1–4.4
                             Cl (mg L−1 )                                          3.2–20            17–51
                             NO3 -N (mg L−1 )                                       0–0.1          0.5–3.3
                             NH4 -N (mg L−1 )                                       0–0.2            0–0.1
                             Ca (mg L−1 )                                         0.2–1.0          0.2–1.7
                             Mg (mg L−1 )                                         0.2–1.0          0.6–1.9
                             Na (mg L−1 )                                         2.8–8.4            12–23
                             K (mg L−1 )                                          0.1–1.1          0.2–1.0
                             Inorganic Al (mg L−1 )                               0.2–3.4          0.6–5.3
                             Organic Al (mg L−1 )                                   0–0.4          0.6–1.1
                             Total Al (mg L−1 )                                   0.4–3.7          1.5–6.2
                             Total organic carbon (TOC; mg L−1 )                  3.5–15            8.2–21
                           ∗ Decreasing steeply with time.

    – BGR is a background scenario without clear cutting and          86 mequiv m−3 yr−1 ) and 45 mequiv m−3 yr−1 according to
      thinning, without an increase in acidifying deposition          PROFILE.
      and without climate change.                                        The estimated weathering rate of base cations is lower at
                                                                      Hissmossa than that at Västra Torup according to both mod-
                                                                      els. This is due to the coarser soil texture at Hissmossa, lead-
                                                                      ing to a significantly lower exposed mineral surface area.
3     Results
                                                                      Also, according to field measurements, Hissmossa has a
                                                                      more acid soil solution than Västra Torup, with twice the
3.1    Weathering rates from PROFILE and ForSAFE
                                                                      concentration of inorganic aluminium at Västra Torup. Dis-
The total weathering rates obtained with ForSAFE with the             solved inorganic aluminium, a product of the weathering of
BSC scenario, averaged over a forest rotation, were similar to        silicate minerals, inhibits the weathering of silicate miner-
the weathering rates obtained with PROFILE for all soil lay-          als. The rotation periods at Västra Torup and Hissmossa are
ers and modelled elements and were almost equal for many              not the same, so average rates for the forest rotation are not
of them (Fig. 1). At Västra Torup, the total annual weather-          directly comparable, since climate changes during the pe-
ing rate of the base cations (Ca, Mg, K and Na) in the root           riod. The differences in weathering rates between the sites
zone (organic layer plus the uppermost 50 cm of the min-              are much larger than the changes in rates because of climate
eral soil, L1–L5) was 115 mequiv m−3 yr−1 on average, ac-             change.
cording to ForSAFE (varying for different months between                 Differences in the weathering rates predicted by the two
51 and 260 mequiv m−3 yr−1 ), and 106 mequiv m−3 yr−1 , ac-           models are greater for soil layers where the differences be-
cording to PROFILE. At Hissmossa, the total weathering                tween the values of soil moisture are higher between the
rate of base cations in the root zone (L1–L4) estimated               two models (Fig. 2), i.e. in the organic layers (where weath-
with ForSAFE was 38 mequiv m−3 yr−1 (varying from 16 to               ering is very small, due to very small mineral mass) and

SOIL, 5, 33–47, 2019                                                                               www.soil-journal.net/5/33/2019/
Table 2. Measured soil parameters for the five soil layers (O, A, AB, B and C) at the two sites. Above: thickness of layer, bulk density, percentage organic matter, estimated percentage
stones, measured size fractions, pH, exchangeable ions, cation exchange capacity (CEC), base saturation, and fraction of carbon and nitrogen. Below: total chemistry of all dry soil
matter.
Horizon Thickness Bulk density Organic matter Stoniness Clay Silt Sand pH H2 O Exchangeable ions (µeq g−1 ) CEC Base saturation Total C Total N
(m) (kg m−3 ) (% of DW) (%) (% of mineral soil) Al H Na K Mg Ca (µeq g−1 ) (%) (g (kg DW)−1 )
Västra Torup
www.soil-journal.net/5/33/2019/
O 0.05 181 87 0 4.0 29 84.5 < 0.1 13.0 27.9 50.1 205 43.0 543 20.9
A 0.06 959 6 20 5 27 68 4.1 31 16.5 < 0.1 1.0 0.7 0.8 50 4.9 34 2.0
AB 0.20 1062 5 20 5 31 64 4.6 27 6.1 < 0.1 0.6 0.4 1.2 36 6.4 25 1.7
B 0.20 1279 4 20 3 21 76 4.8 16 1.3 < 0.1 0.4 0.1 0.6 18 6.5 18 1.3
C 0.04 1446 2 20 0 17 83 4.9 13 4.8 < 0.1 0.4 0.1 0.5 19 5.0 8 0.6
Hissmossa
O 0.05 394 65 0 3.5 45 63.5 3.7 8.1 21.4 26.4 164 36.8 391 19.8
A 0.13 909 8 10 0 5 91 3.8 36 15.3 0.6 1.4 3.8 2.9 60 17.6 46 3.0
AB 0.10 1075 8 10 1 8 89 4.6 27 4.6 0.4 0.8 2.5 2.3 37 17.8 38 3.0
V. Kronnäs et al.: Dynamic modelling of weathering rates
B 0.28 1276 3 10 0 9 88 4.5 12 0.3 0.4 0.7 2.3 2.3 17 34.2 17 2.2
C 0.04 1316 3 10 0 8 88 4.7 11 0.7 0.4 0.7 2.4 2.3 17 36.1 14 2.0
Total chemistry of mineral and organic matter (mg (kg DW)−1 )
Horizon Si Al Ca Fe K Mg Mn Na P Ti
Västra Torup
O 33 100 5060 1760 2540 2540 623 167 1440 789 337
A 349 000 50 000 7110 20 000 26 300 1540 386 15 900 253 4280
AB 335 000 56 400 8190 28 600 26 600 2610 469 16 300 401 4510
B 341 000 58 600 8920 22 600 27 700 2950 436 17 100 540 3700
C 348 000 59 500 9820 24 400 28 700 3240 493 17 800 602 4240
Hissmossa
O 77 300 13 500 1970 4370 5710 580 103 3540 787 844
A 322 000 51 500 5040 19 200 28 400 822 277 14 600 166 3540
AB 322 000 65 700 7030 29 100 29 600 2070 459 16 900 217 3340
B 340 000 66 000 7490 27 600 30 700 2140 419 18 900 231 3290
C 329 000 70 500 8840 28 800 33 600 2670 822 19 000 451 3030
SOIL, 5, 33–47, 2019
37V. Kronnäs et al.: Dynamic modelling of weathering rates
www.soil-journal.net/5/33/2019/
Table 3. Soil input data to the models. Partial pressure of CO2 and gibbsite constant are standard values. Mineral area, field capacity, wilting point, field saturation and percentage of
minerals are calculated from measured soil parameters at the two sites. The modelled layers L1–L5 correspond to soil layers O, A, AB, B and C in the two soils. Hissmossa L5 is below
the modelled root zone of 50 cm.
Layer Mineral area pCO2 K gibbsite Field capacity Wilting point Field saturation Quartz K feldspar Albite Anorthite Muscovite Epidote Hornblende Apatite Illite Vermiculite 1 Vermiculite 2 Chlorite 1 Chlorite 2
(106 m2 m−3 ) (m3 m−3 ) SiO2 KAlSi3 O8 NaAlSi3 O8 CaAl2 Si2 O8 a b c d e f g h i
Västra Torup
L1 214 161 10 6.5 0.31 0.11 0.87 50 17 19 2.2 2.4 2.0 0.4 0.2 1.3 0.6 0.2 0.4 0.2
L2 1 131 959 20 7.6 0.21 0.06 0.68 50 17 19 2.2 2.4 2.0 0.4 0.2 1.3 0.6 0.2 0.4 0.2
L3 1 334 007 20 8.6 0.24 0.06 0.64 46 16 19 2.4 4.4 2.1 0.7 0.2 2.3 1.0 0.4 0.6 0.4
L4 1 167 398 20 9.2 0.22 0.06 0.54 45 16 20 2.5 4.1 2.2 0.8 0.3 2.2 1.1 0.5 0.7 0.5
L5 909 226 20 9.2 0.18 0.03 0.47 44 17 20 2.6 3.3 2.3 0.9 0.3 1.9 1.3 0.5 0.8 0.5
Hissmossa
L1 143 372 10 6.5 0.42 0.17 0.80 42 18 17 1.5 1.2 1.4 0.2 0.1 2.9 0.3 0.1 0.2 0.1
L2 330 775 20 7.6 0.18 0.05 0.65 42 18 17 1.5 1.2 1.4 0.2 0.1 2.9 0.3 0.1 0.2 0.1
L3 491 284 20 8.6 0.20 0.06 0.58 39 17 19 2.1 2.9 1.8 0.6 0.1 5.2 0.7 0.3 0.4 0.3
L4 534 872 20 9.2 0.14 0.03 0.51 41 17 21 2.5 4.8 1.7 0.5 0.1 3.5 0.7 0.3 0.4 0.3
L5 538 935 20 9.2 0.15 0.03 0.50 37 18 21 2.7 5.5 2.0 0.7 0.2 3.7 0.9 0.4 0.5 0.4
a K Na Mg Fe Ti Al Si b c d e f g
44 2 8 12 2 96 120 O390 (OH)94 , Ca80 Fe30 Al96 Si124 O495 (OH)44 , K18 Na54 Ca166 Mg210 Fe180 Ti11 Al216 Si606 O2146 (OH)188 , Ca10 (PO4 )6 (OH)2 , K0.6 Al2 (Al0.6 Si3.4 O10 )(OH)2 , Ca20 Mg103 Fe182 Al162 Si293 O832 (OH)804 , Ca10 Mg103 Fe22 Al68 Si123 O249 (OH)490 ,
h Na Ca Mg i
2 3 107 Fe124 TiAl124 Si138 O540 (OH)442 , Mg103 Fe58 TiAl100 Si87 O365 (OH)302 .
SOIL, 5, 33–47, 2019
38V. Kronnäs et al.: Dynamic modelling of weathering rates 39
Figure 1. Weathering rates (mequiv m−2 yr−1 ) calculated with the PROFILE model and the ForSAFE model (averages over a forest rotation,
BSC scenario), for the sites at Västra Torup and Hissmossa and for soil layers from L1 (top layer) to L5 (bottom layer at ∼ 50 cm depth). The
time period is from one clear cut to the next and is different for the two sites: 2011–2080 for Västra Torup and 2041–2100 for Hissmossa.
Note that the rates are shown here per layer so that the bars show directly how much of the total weathering each soil layer contributes. For
Hissmossa, L5 is shown, even though it lies below the root zone and is not included in calculations of weathering rates in the root zone.
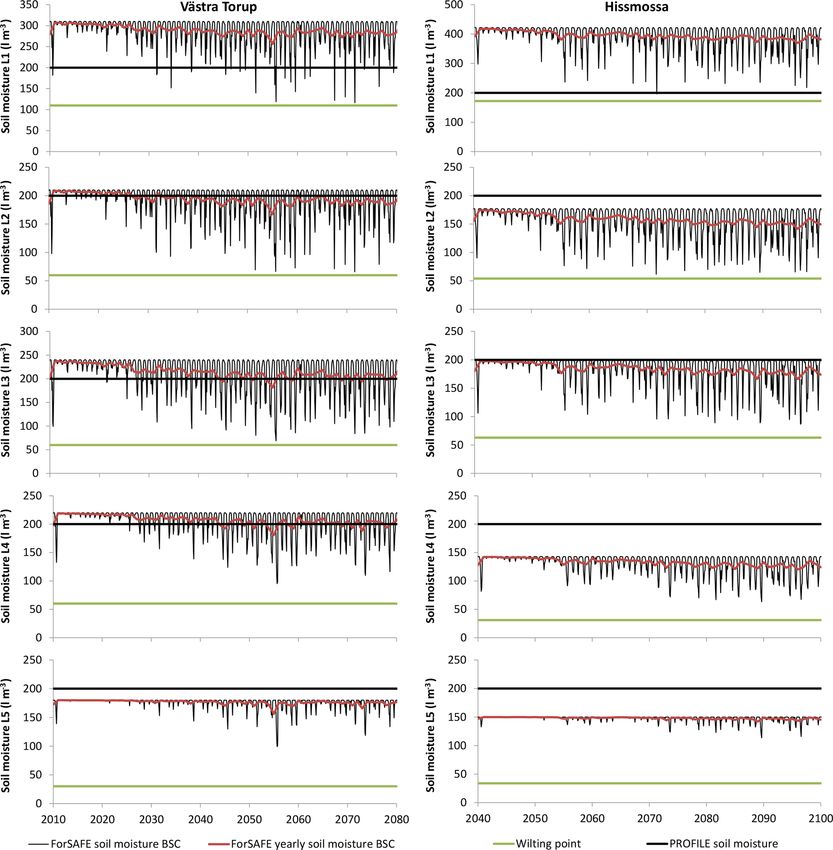
in L4 in Hissmossa. The input value for PROFILE was typically 3 to 4 times higher than during the coldest month,
0.2 m3soil water volume m−3
soil volume for all layers at both these except for Ca and P, where weathering in the warmest month
sites. The soil moisture is dynamically modelled in For- is 5 to 8 times higher than in the coldest month. On longer
SAFE, with average values close to the defined field capacity timescales, the yearly average weathering rates can vary by a
for the respective layers (Table 3). The average soil mois- factor of 2 during a forest rotation.
ture at Västra Torup, for the forest rotation 2011–2080, was
0.18–0.21 in the mineral layers and 0.29 in the thin organic 3.3 Effect of forestry on weathering
upper layer. In the sandy soil at Hissmossa the average soil
moisture in ForSAFE (for the forest rotation 2041–2100) was Thinning and clear cutting at Västra Torup increased the
0.13–0.18 in the mineral soil layers and 0.4 in the organic weathering of base cations by 9 % in the future forest rota-
soil layer. The difference between the value of soil moisture tion (2011–2080) in the BSC scenario, compared to the NFO
used in PROFILE and that calculated by ForSAFE is thus scenario with no clear cutting or thinning (Fig. 4). Whole-
greater at Hissmossa, and the differences in weathering rates tree harvesting in the WTH scenario increased the weather-
between the two models are thus also greater at Hissmossa ing by a further 1 %. At Hissmossa the increase in weathering
than at Västra Torup. between the NFO scenario and the BSC scenario was 14 %
for the forest rotation between 2041 and 2100, with a fur-
ther increase of 2 % for the WTH scenario. The difference in
3.2 Seasonal, yearly and decadal variation in weathering between scenarios occurs during the first half of
weathering rates from ForSAFE the forest rotation.
The weathering rates obtained with ForSAFE vary season-
3.4 Effect of acidification on weathering
ally with temperature and soil moisture, as well as on longer
timescales, depending, for example, on the forest stage, the In ForSAFE, the weathering of silicate minerals is decreased
acidification status of the soil and the climate (Fig. 3). On by the acidified conditions in the soils during the second half
the seasonal scale, weathering is lowest in winter and highest of the 20th century in the BSC scenario, whereas the weath-
in the warmest period of summer, unless the soil is too dry. ering of the only P-containing mineral, apatite, is enhanced
Weathering rates during the warmest month of the year are (Fig. 5). The effect of acidification on weathering is smaller
www.soil-journal.net/5/33/2019/ SOIL, 5, 33–47, 201940 V. Kronnäs et al.: Dynamic modelling of weathering rates
Figure 2. Soil moisture in all soil layers, BSC scenario, forest rotation 2010–2080 in Västra Torup and 2040–2100 in Hissmossa, compared
to wilting-point and PROFILE-input soil moisture.
than the effects of temperature and soil moisture. For the for- an increase in ForSAFE weathering rates of base cations of
est rotation 1941–2010 in Västra Torup, the weathering of 7 % ◦ C−1 . The increase in temperature is greatest in winter
base cations was 11 % lower in the BSC scenario than in the (6 ◦ C difference between 1900–1930 and 2080–2100) and
non-acidification NAC scenario, while the P weathering was smallest in summer (4 ◦ C difference between 1900–1930 and
11 % higher. At Hissmossa, for the forest rotation 1973–2040 2080–2100). In Hissmossa, the weathering rates of Ca in L4
(i.e. mostly after the most acidified period), the weathering are 44 % to 49 % higher in 2080–2100 in the BSC scenario
of base cations was 6 % lower, and the weathering of P was than in the constant-climate scenario, NCC, for all seasons
17 % higher in the BSC scenario than in the NAC scenario. (Fig. 6).
3.5 Effect of climate change on weathering 3.6 Overall effect of forestry, acidification and climate
change
Temperature has a considerable effect on weathering rates. In
the BSC scenario, the yearly average temperature increased The overall effect on weathering rates of human practices
from 7 ◦ C in the 1990s to 11 ◦ C in the 2090s. This leads to (forestry, historical acidification and climate change), as in
SOIL, 5, 33–47, 2019 www.soil-journal.net/5/33/2019/V. Kronnäs et al.: Dynamic modelling of weathering rates 41
Figure 3. Modelled Ca + Mg + K + Na weathering in Västra Torup and Hissmossa from 1950–2100 (note the difference in scale for the
two sites). PROFILE calculates the average weathering rates for the time period represented by the input values, while monthly weathering
values were calculated with ForSAFE, using the BSC scenario.
the BSC scenario, is positive compared to the background 4 Discussion
scenario, BGR. Climate change and forestry have a positive
effect on silicate weathering, while acidification has a neg- 4.1 Implications of model differences
ative effect but not of such a magnitude that it cancels out
the first two. For apatite weathering, the combined effect of The weathering calculations in PROFILE and ForSAFE are
climate change, forestry and decreasing acidification is an based on the same equations, but in ForSAFE they are dy-
increase of the weathering in the future, especially for newly namic, while PROFILE has no time dimension. The models
planted forest. The weathering-enhancing effect of forestry also differ in that several processes are only given as input
is also seen in the first part of a forest rotation for silicate data into PROFILE, while they are modelled dynamically
weathering, whereas an aging forest has slightly decreasing with ForSAFE, and that feedbacks between these processes
weathering rates. Increasing temperatures, combined with affect the system in ForSAFE. In the PROFILE model, a
the forestry-induced weathering dynamic with higher weath- lack of nutrients because of low weathering can never affect
ering in young forest, produces a step-like increase in weath- tree growth, since the uptake of nutrients to trees are input
ering rates of silicates in the BSC scenario (Fig. 7). data. Low soil moisture during summers can also never af-
fect weathering rates in PROFILE, because there are neither
seasons nor modelled soil moisture values. PROFILE was
developed at a time when climate change was usually not
considered. It was developed to answer the question of how
much acidity the ecosystem could tolerate long-term (under
www.soil-journal.net/5/33/2019/ SOIL, 5, 33–47, 201942 V. Kronnäs et al.: Dynamic modelling of weathering rates Figure 4. Yearly average weathering of base cations in the whole soil profile, for the BSC scenario, the whole-tree harvest WTH scenario, and the NFO scenario without any clear cutting or thinning. The years of clear cuts in the BSC and WTH scenarios are marked with vertical lines. In Västra Torup clear cuts are in the years 1940, 2010 and 2080 and in Hissmossa in 1972, 2040 and 2101. Figure 5. Comparison of weathering rates of Mg and P in soil layer L4 in the non-acidification scenario NAC and the base scenario BSC (mequiv m−3 yr−1 ). With the mineralogy of these sites, Mg is only weathered from silicate minerals, and P is only weathered from apatite. One dot represents 1 month. the premise of unchanging forestry and climate), and for this forestry intensity for recovery from acidification increased it was sufficient. As acidification loads decreased, the role of (Iwald et al., 2013), A more complex model was needed, SOIL, 5, 33–47, 2019 www.soil-journal.net/5/33/2019/
V. Kronnäs et al.: Dynamic modelling of weathering rates                                                                               43

Figure 6. The effect of the increased temperature of the BSC scenario on Ca weathering in L4 at Hissmossa, compared to the NCC scenario
with no climate change, shown as averages for seasons over periods of 30 years. Winter – December, January and February; spring – March,
April and May; summer – June, July and August; and autumn – September, October and November.

Figure 7. Weathering of Mg (from silicates) and P (from apatite) at Västra Torup, under the BSC scenario and the BGR scenario with neither
acidification or climate change nor forestry.

and ForSAFE was developed, which includes these processes              the two models produce comparable estimates of weathering
and feedbacks. We have shown that despite their differences,           rates on these two sites.

www.soil-journal.net/5/33/2019/                                                                                  SOIL, 5, 33–47, 2019
44                                                                  V. Kronnäs et al.: Dynamic modelling of weathering rates

   The PROFILE model has often been used for critical load         much as with stem-only harvesting (Ågren et al., 2010). This
assessments and weathering estimates. This study shows that        might be the reason for the very slight increase in weather-
the more advanced model ForSAFE is as reliable as the PRO-         ing following whole-tree harvesting compared to the stem-
FILE model and can be used to gain more information on the         only harvesting found in this study. If base cation concen-
variation in weathering rates due to forestry practices, cli-      trations do not increase as much after whole-tree harvesting
mate changes and temperature change, which could increase          as after stem-only harvesting, this also leads to less leaching
our understanding of the dynamics of ecosystem sensitivity.        of base cations after whole-tree harvest than after stem-only
General conclusions regarding acid sensitivity, critical loads     harvest. The slightly increased weathering rate and the de-
and the sustainability of forestry would not change signifi-       creased leaching may explain the diminishing difference in
cantly, but our ability to make customised or more detailed        soil conditions with time between whole-tree harvesting and
forestry plans with regards to intensity of harvest or to take     stem harvesting that has been seen in field experiments, de-
acidification countermeasures would be improved.                   spite the fact that a large quantity of base cations is removed
                                                                   from the ecosystem by whole-tree harvesting (Zetterberg et
4.2   Weathering dynamics in a changing environment
                                                                   al., 2013).
                                                                      According to ForSAFE, the weathering of silicate minerals
Another parameter that has a significant influence on weath-       is considerably suppressed by the atmospheric deposition of
ering rates is the temperature. The climate is becoming            acidifying substances, whereas the weathering of apatite (P
warmer, and in some regions in Sweden, as elsewhere, it            and some of the Ca) was enhanced. The reason for this is
is possibly also becoming drier in the summer (Kjellström          the combined effects of H+ as a driver of weathering and
et al., 2018). Higher temperatures increase weathering, as         Al3+ as an inhibitor of silicate weathering but not of apatite
shown in our simulations. However, drier conditions inhibit        weathering, since apatite does not contain Al. The solubility
weathering, and dry periods in the summer, when weather-           of Al increases with lower pH, thus inhibiting the weathering
ing otherwise would be much higher than in the rest of the         of silicates as the soil acidifies.
year, might affect the yearly weathering considerably. These
two sites, although having lower soil moisture in the sum-         4.3   Model limitations and development
mer on average (Fig. 2), do not seem to experience really dry
summers more often in these future scenarios than during the       The results of this study demonstrate the importance of soil
20th century for the same forest stand age. Future studies on      moisture to weathering rates. In PROFILE the soil moisture
regions that are believed to become much drier in summer in        is an input, previously known from uncertainty studies to be
the future may help elucidate this.                                of great importance for the weathering rates (Jönsson et al.,
   Akselsson et al. (2016) calculated the increase in the          1995; Barkman and Alveteg, 2001), but often based on obser-
weathering rate due to climate change in the 21st century          vation of the site and rough assumptions, whereas it is mod-
in Sweden using the PROFILE model. They found that the             elled in ForSAFE with soil texture, precipitation and tem-
increase in weathering rates due to temperature increase up        perature as inputs. For these two sites, average soil moisture
to 2050 varied at different locations in Sweden. The me-           modelled by ForSAFE is similar to the rough estimates of
dian increase in the base cation weathering rate was 20 %          moisture used as input for PROFILE for most of the soil lay-
for the ECHAM projection and 33 % for the HADLEY pro-              ers. The soil moisture modelled by ForSAFE is also close to
jection, which are both equivalent to about 10 % ◦ C−1 . This      the calculated field capacity most of the time. Average soil
is slightly higher than our result of an increase of 7 % ◦ C−1 .   moisture that is close to field capacity could partly be an ef-
The difference is due to the fact that ForSAFE is a more com-      fect of the monthly time step, which evens out precipitation
plex model, with dynamic feedbacks between the uptake by           and gives enough time for draining of excess water each time
trees, soil solution chemistry, soil moisture and weathering.      step. A new version of ForSAFE with a daily time step is
   Forestry also affects weathering. After clear cutting, both     under development. A daily time step, with a more realistic
soil moisture and soil temperature increase, leading to an in-     time distribution of precipitation, with rainfall events and dry
crease in weathering rate. As the uptake of nutrients to trees     periods in between, affects the calculations of soil moisture
are halted and as the remaining litter starts to decompose,        in a short-term period, might affect the seasonal average soil
concentrations of base cations start to increase (Piirainen et     moisture values and might thus affect the predicted weather-
al., 2004). Base cations in the soil solution inhibit weather-     ing rates, giving a greater variability in weathering between
ing of base cations in the model (like inorganic aluminium         drier and wetter periods and potentially shifting the average.
inhibiting weathering of aluminium), but the increase in base      A shorter time step would potentially give more accurate re-
cations is not sufficient in reducing the rate of weathering,      sults, given that soil moisture is an important parameter for
since the soil moisture is still high. With whole-tree harvest-    weathering, and soil moisture is highly variable on a shorter
ing, much of the litter is removed so that there are less base     timescale than months.
cations to be released to soil water through decomposing,             In the SWETHRO sites, soil moisture and soil tempera-
and the concentrations of base cations should not increase as      ture are not measured, thus modelled soil moisture cannot

SOIL, 5, 33–47, 2019                                                                            www.soil-journal.net/5/33/2019/
V. Kronnäs et al.: Dynamic modelling of weathering rates 45
be compared to measured values. Another future study could 5 Conclusions
model sites where such measurements are made and investi-
gate how ForSAFE modelled soil moisture and temperature We have shown that despite the differences between PRO-
compare with measured data. FILE and ForSAFE, the two models give comparable esti-
Both the PROFILE model and the ForSAFE model are mates of annual weathering rates.
known to overestimate weathering in the lower soil layers The PROFILE model has often been used for critical load
(Stendahl et al., 2013; Zanchi, 2016). The soil horizon C con- assessments and weathering estimates. This study shows that
sists of the less weathered parent material at the bottom of the more advanced model, ForSAFE, can be used to gain
the soil profile, where weathering rates are low because the much more information on the variation in weathering rates
conditions in the soil inhibits weathering, despite the relative in response to forestry and climate change.
abundance of weatherable minerals. Both PROFILE and For- The results from ForSAFE presented in this paper demon-
SAFE currently calculate rather high weathering rates in the strate that weathering rates vary considerably between sea-
C horizon, if this soil layer is included in the calculations. sons, between years and on longer timescales. This dynamic
In the modelling presented in this paper only a few centime- behaviour can be of importance in nutrient leaching and nu-
tres of the C horizon are included, thus the total contribution trient availability to the trees; during seasons with high nu-
of weathering from horizon C is small, but the rates per soil trient demand there might be risk of nutrient deficiency, even
volume are equivalent to the layers above. Most of the C hori- though there might be higher availability of nutrients than de-
zon is usually located below the root zone, usually defined as mand and nutrient losses through leaching during other sea-
the uppermost 50 cm of mineral soil for spruce forest in Swe- sons.
den, where more than 90 % of the spruce roots can be located
(Rosengren and Stjernquist, 2004) and are therefore not in-
cluded in the modelling. The overestimation of weathering Data availability. Data on the SWETHRO sites are available
in the lower soil layers by these two models is likely to be, from the SWETHRO website at http://krondroppsnatet.ivl.se (IVL,
at least partly, due to the lack of calculation of the concen- 2019).
trations of dissolved silica in the soil water in both models.
The dissolved silica, being a product of weathering of sili-
cate minerals, acts as an inhibitor on the weathering of these Author contributions. VK planned and led the work; performed
minerals, i.e. all the minerals modelled in this study except most of the calculations, modelling and analysis of the results; and
apatite. The concentration of dissolved silica in the soil water wrote and edited the paper. CA and SB were highly involved in the
planning and design of the study from the start and contributed to
is currently being included in the ForSAFE model.
the writing and the editing of the paper. CA was responsible for the
When the PROFILE and ForSAFE weathering profiles at funding acquisitions and project administration. SB modified the
Västra Torup and Hissmossa are compared to weathering model code for the study.
rates at a nearby site, Skånes Värsjö, calculated with the de-
pletion method (Stendahl et al., 2013), PROFILE and For-
SAFE predict substantially higher weathering rates in the Competing interests. The authors declare that they have no con-
lower soil horizons, in line with the above discussion on over- flict of interest.
estimation in the lower layers. The weathering rates modelled
in the upper horizons by PROFILE and ForSAFE are, on the
other hand, lower than the rates obtained with the depletion Special issue statement. This article is part of the special issue
method. However, the depletion method does not calculate “Quantifying weathering rates for sustainable forestry (BG/SOIL
present-day weathering but calculates average weathering in inter-journal SI)”. It is not associated with a conference.
the soil layer since deglaciation. The weathering rates have
varied with time, both because new soils have more eas-
ily weatherable material and weather much faster than older Acknowledgements. The authors wish to thank the funding by
soils (Starr and Lindroos, 2006) and because environmen- the Swedish Research Council Formas within the strong research
tal conditions have varied since the end of the last glacia- environment “Quantifying weathering rates for sustainable forestry
(QWARTS)”. We also thank the regional air quality protection
tion. This means that weathering rates calculated with meth-
associations, county administrative boards and the Swedish Envi-
ods that calculate average weathering since the deglaciation, ronmental Protection Agency funding SWETHRO, which provided
such as the depletion method, should generally be higher data on the two sites. We thank Jörgen Olofsson for help with the
than PROFILE and ForSAFE weathering rates, except for the modelling of the Hissmossa site.
lower soil layers, since the weathering front moves down .
Edited by: Boris Jansen
Reviewed by: two anonymous referees
www.soil-journal.net/5/33/2019/ SOIL, 5, 33–47, 201946 V. Kronnäs et al.: Dynamic modelling of weathering rates
References Galloway, J. N., Norton, S. A., and Robbins Church, M.: Freshwa-
ter acidification from atmospheric deposition of sulfuric acid: A
Aber, J. D. and Federer, C. A.: A Generalized, Lumped-Parameter conceptual model, Environ. Sci. Technol., 17, 541–545, 1983.
Model of Photosynthesis, Evapotranspiration and Net Primary Garmo, Ø. A., Skjelkvåle, B. L., de Wit, H. A., Colombo, L., Curtis,
Production in Temperate and Boreal Forest Ecosystems, OecoIo- C., Fölster, J., Hoffmann, A., Hruška, J., Høgåsen, T., Jeffries, D.
gia, 92, 463–474, 1992. S., Keller, W. B., Krám, P., Majer, V., Monteith, D. T., Paterson,
Akselsson, C., Olsson, J., Belyazid, S., and Capell, R.: Can in- A. M., Rogora, M., Rzychon, D., Steingruber, S., Stoddard, J. L.,
creased weathering rates due to future warming compensate for Vuorenmaa, J., and Worsztynowicz, A.: Trends in Surface Water
base cation losses following whole-tree harvesting in spruce Chemistry in Acidified Areas in Europe and North America from
forests?, Biogeochemistry, 128, 89–105, 2016. 1990 to 2008, Water Air Soil Pollut., 225, 1–14, 2014.
Ågren, A., Buffam, I., Bishop, K., and Laudon, H. Sensitivity of Gaudio, N., Belyazid, S., Gendre, X., Mansat, A., Nicolas, M.,
pH in a boreal stream network to a potential decrease in base Rizzetto, S., Sverdrup, H., and Probst, A.: Combined effect of at-
cations caused by forest harvest, Can. J. Fish. Aquat. Sci., 67, mospheric nitrogen deposition and climate change on temperate
1116–1125, 2010. forest soil biogeochemistry: A modeling approach, Ecol. Model.,
Alveteg, M., Sverdrup, H., and Warfvinge, P.: Regional assessment 306, 24–34, 2015.
of the temporal trends in soil acidification in southern Sweden, Holmqvist, J., Øgaard, A. F., Öborn, I., Edwards, A. C., Mattsson,
using the SAFE model, Water Air Soil Pollut., 85, 2509–2514, L., and Sverdrup, H.: Application of the PROFILE model to es-
1995. timate potassium release from mineral weathering in Northern
Balland, V., Pollacco, J. A. P., and Arp, P. A.: Modeling soil hy- European agricultural soils, Eur. J. Agron., 20, 149–163, 2003.
draulic properties for a wide range of soil conditions, Ecol. IVL: SWETHRO data, available at: http://krondroppsnatet.ivl.se,
Model., 219, 300–316, 2008. last access: 11 January 2019.
Barkman, A. and Alveteg, M.: Identifying potentials for reduc- Iwald, J., Löfgren, S., Stendahl, J., and Karltun, E.: Acidifying ef-
ing uncertainty in critical load calculations using the PROFILE fect of removal of tree stumps and logging residues as com-
model, Water Air Soil Pollut., 125, 33–54, 2001. pared to atmospheric deposition, Forest Ecol. Manag., 290, 49–
Belyazid, S., Westling, O., and Sverdrup, H.: Modelling changes in 58, 2013.
forest soil chemistry at 16 Swedish coniferous forest sites follow- Johnson, J., Graf Pannatier, E., Carnicelli, S., Cecchini, G., Clarke,
ing deposition reduction, Environ. Pollut., 144, 596–609, 2006. N., Cools, N., Hansen, K., Meesenburg, H., Nieminen, T.M.,
Belyazid, S., Sverdrup, H., Kurz, D., and Braun, S.: Exploring Pihl-Karlsson, G., Titeux, H., Vanguelova, E., Verstraeten, A.,
Ground Vegetation Change for Different Deposition Scenarios Vesterdal, L.,Waldner, P., and Jonard, M.: The response of soil
and Methods for Estimating Critical Loads for Biodiversity Us- solution chemistry in European forests to decreasing acid depo-
ing the ForSAFE-VEG Model in Switzerland and Sweden, Water sition, Glob. Change Biol., 24, 3603–3619, 2018.
Air Soil Pollut., 216, 289–317, 2011. Jönsson, C., Warfvinge, P., and Sverdrup, H. Uncertainty in pre-
Cho, Y., Kang, H., and Jeon, E.-C.: The Effects of Reactive Nitrogen dicting weathering rate and environmental stress factors with the
(Nr) Compounds on the Acidification in Soil and Water Environ- PROFILE model, Water Air Soil Pollut., 81, 1–23, 1995.
ment Ecosystems and the Mitigation Strategy, Korean Journal of Kjellström, E., Nikulin, G., Strandberg, G., Christensen, O. B., Ja-
Ecology and Environment, 49, 1–10, 2016 (in Korean). cob, D., Keuler, K., Lenderink, G., van Meijgaard, E., Schär, C.,
Christiansen, L.: Swedish Statistical Yearbook of Forestry 2014, Somot, S., Sørland, S. L., Teichmann, C., and Vautard, R.: Eu-
Swedish Forestry Agency, ISBN 978-91-87535-05-5, 2014. ropean climate change at global mean temperature increases of
Chu, S. and Majumdar, A.: Opportunities and challenges for a sus- 1.5 and 2 ◦ C above pre-industrial conditions as simulated by the
tainable energy future, Nature, 488, 294–303, 2012. EURO-CORDEX regional climate models, Earth Syst. Dynam.,
Engardt, M., Simpson, D., Schwikowski, M., and Granat, L.: De- 9, 459–478, https://doi.org/10.5194/esd-9-459-2018, 2018.
position of sulphur and nitrogen in Europe 1900–2050. Model Krabbendam, M. and Bradwell, T.: Quaternary evolution of
calculations and comparison to historical observations, Tellus B, glaciated gneiss terrains: pre-glacial weathering vs. glacial ero-
69, 1328945, https://doi.org/10.1080/16000889.2017.1328945, sion, Quaternary Sci. Rev., 95, 20–42, 2014.
2017. Lindström, G. and Gardelin, M.: Modelling groundwater response
Erlandsson, M., Oelkers, E. H., Bishop, K., Sverdrup, H., Belyazid, to acidification, Report from the Swedish integrated groundwater
S., Ledesma, J. L. J., and Köhler, S. J.: Spatial and temporal vari- acidification project, 1992.
ations of base cation release from chemical weathering on a hill- Martinsson, L., Alveteg, M., Kronnäs, V., Sverdrup, H., Westling,
slope scale, Chem. Geol., 441, 1–13, 2016. O., and Warfvinge, P.: A regional perspective on present and fu-
Farley, D. A. and Werritty, A.: Hydrochemical budgets for the Loch ture soil chemistry at 16 Swedish forest sites, Water Air Soil Pol-
Dee experimental catchments, southwest Scotland (1981–1985), lut., 162, 89–105, 2005.
J. Hydrol., 109, 351–368, 1989. Nakićenović, N., Alcamo, J., Davis, G., de Vries, B., Fenhann, J.,
Fumoto, T., Shindo, J., Oura, N., and Sverdrup, H.: Adapting the Gaffin, S., Gregory, K., Grubler, A., Jung, T. Y., Kram, T., La
PROFILE model to calculate the critical loads for east Asian Rovere, E. L., Michaelis, L., Mori, S., Morita, T., Pepper, W.,
soils by including volcanic glass weathering and alternative alu- Pitcher, H. M., Price, L., Riahi, K., Roehrl, A., Rogner, H.-H.,
minium solubility system, Water Air Soil Pollut., 130, 1247– Sankovski, A., Schlesinger, M., Shukla, P., Smith, S. J., Swart,
1252, 2001. R., van Rooijen, S., Victor, N., and Dadi, Z. (Eds.): IPCC Spe-
cial Report on Emissions Scenarios: a special report of Working
SOIL, 5, 33–47, 2019 www.soil-journal.net/5/33/2019/V. Kronnäs et al.: Dynamic modelling of weathering rates 47 Group III of the Intergovernmental Panel on Climate Change, Starr, M. and Lindroos, A.-J.: Changes in the rate of release of Ca Cambridge University Press, Cambridge, 2000. and Mg and normative mineralogy due to weathering along a Odén, S.: Nederbördens och luftens försurning: dess orsaker, för- 5300-year chronosequence of boreal forest soils, Geoderma, 133, lopp och verkan i olika miljöer, Ecology Committee Bulletin 269–280, 2006. No.1. Swedish National Science Research Council, Stockholm Stendahl, J., Akselsson, C., Melkerud, P. A., and Belyazid, S.: ISSN: 0375-2208, 1968 (in Swedish with English summary). Pedon-scale silicate weathering: comparison of the PROFILE Overrein, L. N.: Sulphur Pollution Patterns Observed; Leaching of model and the depletion method at 16 forest sites in Sweden, Calcium in Forest Soil Determined, Ambio, 1, 145–147, 1972. Geoderma, 211, 65–74, 2013. Phelan, J., Belyazid, S., Kurz, D., Guthrie, S., Cajka, J., Sverdrup, Sverdrup, H. and Warfvinge, P.: Calculating field weathering H., and Waite, R.: Estimation of soil base cation weathering rates rates using a mechanistic geochemical model PROFILE, Appl. with the PROFILE model to determine critical loads of acidity Geochem., 8, 273–283, 1993. for forested ecosystems in Pennsylvania, USA: Pilot Application Sverdrup, H. and Warfvinge, P.: Critical loads of acidity for Swedish of a Potential National Methodology, Water Air Soil Pollut., 225, forest ecosystems, Ecol. Bull., 44, 75–89, 1995. 1–19, 2014. Sverdrup, H., Martinson, L., Alveteg, M., Moldan, F., Kronnäs, Phelan, J., Belyazid, S., Jones, P., Cajka, J., Buckley, J., and Clark, V., and Munthe, J.: Modeling Recovery of Swedish Ecosystems C.: Assessing the Effects of Climate Change and Air Pollution from Acidification, Ambio, 34, 25–31, 2005. on Soil Properties and Plant Diversity in Northeastern U.S. hard- Wallman, P., Svensson, M. G. E., Sverdrup, H., and Belyazid, S.: wood forests: Model simulations from 1900–2100, Water Air ForSAFE – an integrated process-oriented forest model for long- Soil Pollut., 227, 1–30, 2016. term sustainability assessments, Forest Ecol. Manag., 207, 19– Pihl Karlsson, G., Akselsson, C., Hellsten, S., and Karlsson, P.-E.: 36, 2005. Reduced European emissions of S and N – Effects on air concen- Wallman, P., Belyazid, S., Svensson, M. G. E., and Sverdrup, H.: trations, deposition and soil water chemistry in Swedish forests, DECOMP – a semi-mechanistic model of litter decomposition, Environ. Pollut., 159, 3571–3582, 2011. Environ. Model. Softw., 21, 33–44, 2006. Piirainen, S., Finer, L., Mannerkoski, H., and Starr, M. Effects of Walse, C., Berg, B., and Sverdrup, H.: Review and synthesis of ex- forest clear-cutting on the sulphur, phosphorus and base cations perimental data on organic matter decomposition with respect to fluxes through podzolic soil horizons, Biogeochemistry, 69, 405– the effects of temperature, moisture and acidity, Environ. Rev., 6, 424, 2004. 25–40, 1998. Posch, M. and Kurz, D.: A2M – A program to compute all possible Warfvinge, P. and Sverdrup, H.: Critical loads of acidity to Swedish mineral modes from geochemical analyses, Comput. Geosci., 33, forest soils. Methods, data and results, Reports in ecology and 563–572, 2007. environmental engineering, Vol. 5, Lund University, 1995. Rizzetto, S., Belyazid, S., Gegout, J.C., Nicolas, M., Alard, D., Cor- Yu, L., Belyazid, S., and Akselsson, C.: van der Heijden G., Zanchi cket, E., Gaudio, N., Sverdrup, H., and Probst, A.: Modelling G.: Storm disturbances in a Swedish forest-A case study com- the impact of climate change and atmospheric N deposition on paring monitoring and modelling, Ecol. Model., 320, 102–113, French forests biodiversity, Environ. Pollut., 213, 1016–1027, 2016. 2016. Zanchi, G.: Modelling nutrient transport from forest ecosystems to Roeckner, E., Brokopf, R., Esch, M., Giorgetta, M., Hagemann, S., surface waters: The model ForSAFE2D, Lund, Sweden, Lund Kornblueh, L., Manzini, E., Schlese, U., and Schulzweida, U.: University, Faculty of Science, Department of Physical Geogra- Sensitivity of simulated climate to horizontal and vertical reso- phy and Ecosystem Science, ISBN: 9789185793686, 2016. lution in the ECHAM5 atmosphere model, J. Clim., 19, 3771– Zanchi, G., Belyazid, S., Akselsson, C., and Yu, L.: Modelling the 3791, 2006. effects of management intensification on multiple forest services: Rosengren, U. and Stjernquist, I.: Gå på djupet! Om rotdjup och a Swedish case study, Ecol. Model., 284, 48–59, 2014. rotproduktion i olika skogstyper, Alnarp, SUFOR, ISBN 91-576- Zetterberg, T., Olsson, B. A., Löfgren, S., von Brömssen, C., and 6617-2, 2004. Brandtberg, P.-O.: The effect of harvest intensity on long-term Simpson, D., Benedictow, A., Berge, H., Bergström, R., Em- calcium dynamics in soil and soil solution at three coniferous berson, L. D., Fagerli, H., Flechard, C. R., Hayman, G. D., sites in Sweden, Forest Ecol. Manag., 302, 280–294, 2013. Gauss, M., Jonson, J. E., Jenkin, M. E., Nyíri, A., Richter, C., Semeena, V. S., Tsyro, S., Tuovinen, J.-P., Valdebenito, Á., and Wind, P.: The EMEP MSC-W chemical transport model – technical description, Atmos. Chem. Phys., 12, 7825–7865, https://doi.org/10.5194/acp-12-7825-2012, 2012. www.soil-journal.net/5/33/2019/ SOIL, 5, 33–47, 2019
You can also read