A Possible Role of FZD10 Delivering Exosomes Derived from Colon Cancers Cell Lines in Inducing Activation of Epithelial-Mesenchymal Transition in ...
←
→
Page content transcription
If your browser does not render page correctly, please read the page content below
International Journal of
            Molecular Sciences

Article
A Possible Role of FZD10 Delivering Exosomes
Derived from Colon Cancers Cell Lines in Inducing
Activation of Epithelial–Mesenchymal Transition in
Normal Colon Epithelial Cell Line
Maria Principia Scavo 1, * , Federica Rizzi 2,3 , Nicoletta Depalo 2, * , Elisabetta Fanizza 2,3 ,
Chiara Ingrosso 2 , Maria Lucia Curri 2,3 and Gianluigi Giannelli 4
 1    Personalized Medicine Laboratory, National Institute of Gastroenterology “S. De Bellis” Research Hospital,
      Via Turi 27, Castellana Grotte, 70013 Bari, Italy
 2    Institute for Chemical-Physical Processes (IPCF)-CNR SS Bari, Via Orabona 4, 70125 Bari, Italy;
      federica.rizzi@uniba.it (F.R.); elisabetta.fanizza@uniba.it (E.F.); c.ingrosso@ba.ipcf.cnr.it (C.I.);
      marialucia.curri@uniba.it (M.L.C.)
 3    Dipartimento di Chimica, Università degli Studi di Bari Aldo Moro, Via Orabona 4, 70125 Bari, Italy
 4    Scientific Direction, National Institute of Gastroenterology “S. De Bellis” Research Hospital, Via Turi 27,
      Castellana Grotte, 70013 Bari, Italy; gianluigi.giannelli@irccsdebellis.it
 *    Correspondence: maria.scavo@irccsdebellis.it (M.P.S.); n.depalo@ba.ipcf.cnr.it (N.D.);
      Tel.: +39-080-4994697 (M.P.S.); +39-080-5442027 (N.D.)

 Received: 11 August 2020; Accepted: 11 September 2020; Published: 13 September 2020

 Abstract: Exosomes belong to the family of extracellular vesicles released by every type of cell both in
 normal and pathological conditions. Growing interest in studies indicates that extracellular vesicles,
 in particular, the fraction named exosomes containing lipids, proteins and nucleic acid, represent
 an efficient way to transfer functional cargoes between cells, thus combining all the other cell–cell
 interaction mechanisms known so far. Only a few decades ago, the involvement of exosomes in
 the carcinogenesis in different tissues was discovered, and very recently it was also observed how
 they carry and modulate the presence of Wnt pathway proteins, involved in the carcinogenesis of
 gastrointestinal tissues, such as Frizzled 10 protein (FZD10), a membrane receptor for Wnt. Here,
 we report the in vitro study on the capability of tumor-derived exosomes to induce neoplastic
 features in normal cells. Exosomes derived from two different colon cancer cell lines, namely the
 non-metastatic CaCo-2 and the metastatic SW620, were found to deliver, in both cases, FZD10, thus
 demonstrating the ability to reprogram normal colonic epithelial cell line (HCEC-1CT). Indeed, the
 acquisition of specific mesenchymal characteristics, such as migration capability and expression of
 FZD10 and markers of mesenchymal cells, was observed. The exosomes derived from the metastatic
 cell line, characterized by a level of FZD10 higher than the exosomes extracted from the non-metastatic
 cells, were also more efficient in stimulating EMT activation. The overall results suggest that FZD10,
 delivered by circulating tumor-derived exosomes, can play a relevant role in promoting the CRC
 carcinogenesis and propagation.

 Keywords: tumor-derived exosomes; frizzled 10 protein; mesenchymal markers; epithelial
 –mesenchymal transition; colorectal cancer

1. Introduction
    Extracellular vesicles (EVs) are biological lipid-bilayer delimited particles secreted by every
type of cells into the extracellular space. They can be broadly classified into three main classes,

Int. J. Mol. Sci. 2020, 21, 6705; doi:10.3390/ijms21186705                             www.mdpi.com/journal/ijms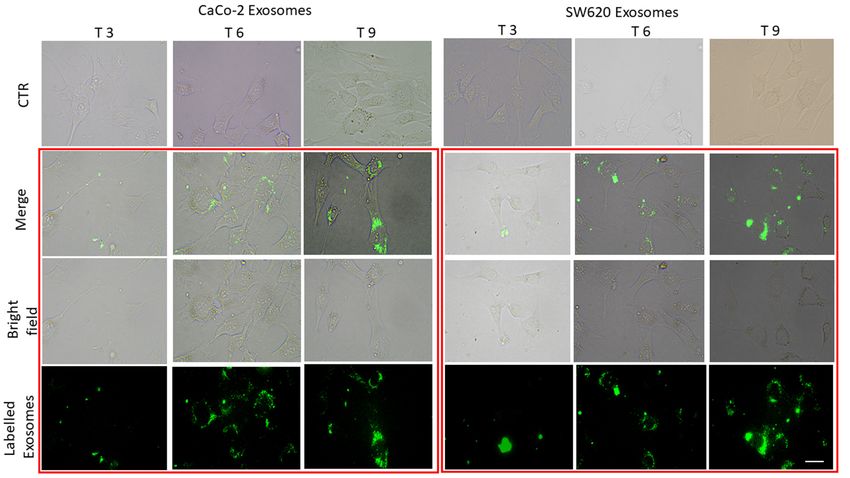
Int. J. Mol. Sci. 2020, 21, 6705                                                                      2 of 15

namely exosomes, microvesicles (MVs) and apoptotic bodies, based primarily on their size, biogenesis,
cargo, function and release pathway during the cell life. Exosomes are vesicles with a size ranging from
50 to 150 nm, containing various bioactive molecules such as proteins (including oncoproteins, tumor
suppressor proteins and transcriptional regulators), small RNAs and DNAs [1]. They are present in
the bloodstream as efficient mediators of intercellular communication. Tumor-derived exosomes were
recognized to deliver their oncogenic cargo from the primary tumor cells to healthy recipient target
cells located in distant organs, with a significant implication in tumor progression and metastasis [2,3].
The hypothesis that metastases may originate from oncogenic macromolecules, circulating in plasma
and derived from the primary tumor, which transfect susceptible cells, even in distant target organs,
is known as “genometastasis” and was reported, for the first time, by Garcia-Olmo D. et al. [4].
The genometastatic hypothesis in human cells was recently confirmed by Abdouh S. et al. who proved
the oncogenic transformation potential of cancer patient serum on human cells [5,6]. Exosomes were
found to be involved not only in communication among cancer cells but also in reprogramming of
mesenchymal stem cells (MSCs) to tumor sites. In this regard, Zakaria Y. A. E. et al. suggested that the
neoplastic transformation of patient-derived adipose mesenchymal stem cells may result from their
long-term exposure to tumor-derived oncogenic factors in prostate cancer (PC) patients. Furthermore,
they indicated the active role of PC cell-derived exosomes as mediators of oncogenic transformation,
genetic instability and mesenchymal–epithelial transition (MET) in patient-derived adipose stem
cells [7]. Similarly, exosomes secreted by breast and ovarian cancer cells resulted able to convey the
specific physical and functional features of tumor-supporting myofibroblasts to adipose tissue-derived
mesenchymal stem cells [8].
      Different proteins, such as vimentin, E-cadherin, N-cadherin, β-catenin and Slug/Snail, were
found to be either upregulated or downregulated during the carcinogenesis, in particular during type
3 epithelial–mesenchymal transition (EMT), which is the process that converts epithelial cells into
mesenchymal cells. In this transition, epithelial cells lose their characteristic cell polarity and cell–cell
adhesion and gain migratory and invasive properties to become mesenchymal cells [9]. Generally,
the downregulation of E-cadherin expression is observed in EMT mainly during tumor cell invasion [10].
This repression was related to the role of c-Myc oncogene in post-transcriptional mechanisms [11],
cytoskeletal modification and cells adhesion that typically occur during tumorigenesis, as well as to
the loss of epithelial markers and the gain of mesenchymal markers, such as vimentin [12]. During the
carcinogenesis, the involved tissues were demonstrated to acquire rigidity compared to the normal
tissues, due to an increase of cellular vimentin expression [13,14] and of cancer cell malignancy due
to the re-organization of cell polarity [12,13]. In colorectal cancer (CRC), mutations in components
actively involved in the Wnt/β-catenin signaling pathway induce deregulation of the c-Myc oncogene
expression [15]. Recently, Frizzled 10 protein (FZD10), one of the membrane receptors involved in the
Wnt pathway, was found to play a crucial role in CRC. Indeed, FZD10 resulted to be overexpressed
not only in CRC tissues but also in exosomes derived from CRC patients and from CRC cell lines.
Interestingly, an in vitro study suggested that FZD10 and FZD10-mRNA delivering exosomes may
be potential messengers of disease reactivation even in quiescent cells. Moreover, FZD10 delivering
exosomes are also thought to function as messengers of cellular transformation, with a concomitant
possible active role in metastasis were supposed [16–19].
      On the basis of these premises, this study investigated the possible role of FZD10 delivering
exosomes, derived either from metastatic and non-metastatic CRC cell lines, to act as messengers able
to trigger reprogramming of normal colon epithelial cells. To assess such a function of the FZD10
delivering exosomes, the acquisition of MCS-like features such as migration ability and expression of
specific EMT involved proteins was evaluated.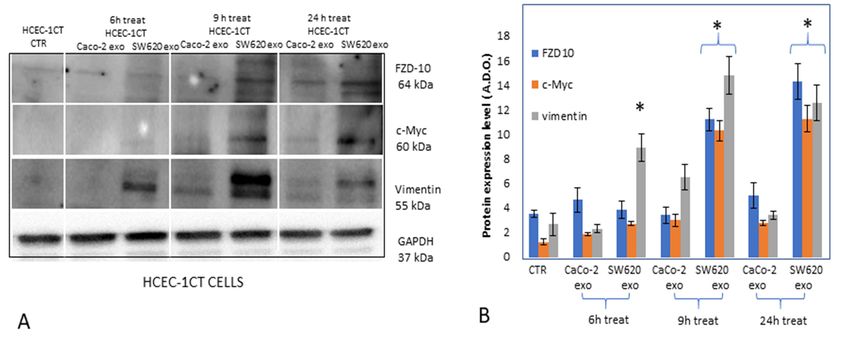
Int. J. Mol. Sci. 2020, 21, 6705 3 of 15
2. Results
2.1. Exosomes Evaluation
Exosomes extracted from the culture medium of the untreated HCEC-1CT, SW620 and CaCo-2
cells were characterized in terms of morphology, size, size distribution and surface charge by TEM,
Int. J. Mol. Sci. 2020, 21, x FOR PEER REVIEW 3 of 16
DLS and ζ-potential investigation. A round shape can be observed for the exosome derived from
culture medium
culture medium of of each
each cell
cell line
line in
in TEM
TEM micrographs. Representative micrographs
micrographs. Representative micrographs are
are reported
reported in
in
Figure 1, showing, in detail, spherical objects with size ranging from 30 to
Figure 1, showing, in detail, spherical objects with size ranging from 30 to 100 nm. 100 nm.
Figure 1. TEM micrographs obtained with positive staining of exosomes freshly extracted from culture
Figure
medium1.of:
TEM micrographs
HCEC-1CT obtained
cells (A); with
CaCo-2 cellspositive
(B); andstaining of exosomes
SW620 cells freshly
(C). Scale bar, 100 extracted
nm. from
culture medium of: HCEC-1CT cells (A); CaCo-2 cells (B); and SW620 cells (C). Scale bar, 100 nm.
DLS investigation of exosomes derived from HCEC-1CT, CaCo-2 and SW620 cells (Table 1)
DLS average
provides investigation of exosomes
hydrodynamic derivedlower
diameters fromthan
HCEC-1CT, CaCo-2
150 nm and, and SW620
therefore, cells (Table
compatible 1)
with the
provides
results ofaverage
the TEM hydrodynamic diameters lower
observation, considering that than
TEM150 nm and,
analysis therefore,
requires compatible with
the preliminary the
samples
results of the
deposition ontoTEM observation,
a grid considering
and subsequently that TEM
a drying analysis requires
step. Therefore, the preliminary
a shrinking of exosomessamples
up to a
deposition onto
certain extent a grid and
is expected to subsequently a dryingaqueous
occur, being exosomes step. Therefore, a shrinking
vesicles derived fromofcell
exosomes
membranes up to
anda
certain extent
delimited by a is expected to bilayer.
phospholipid occur, being exosomes
Indeed, aqueous
ζ-potential vesicles derived
measurements (Table 1)from cell the
revealed membranes
presence
and delimitedcharge
of a negative by a phospholipid bilayer. Indeed,
on exosomes surface, ζ-potential
ascribable measurements
to the negatively charged(Table 1) revealed
phosphate groupsthe
of
presence of a negative
the phospholipid bilayer. charge on exosomes surface, ascribable to the negatively charged phosphate
groups of the phospholipid bilayer.
Table 1. Exosomes characterization by DLS analisys.
Table 1. Exosomes characterization by DLS analisys.
Cell Line Type DH (nm) PDI ζ-Potential (mV)
Cell Line Type
HCEC-1CT DH (nm)
106 ± 11 PDI
0.38 ± 0.18 −32.4ζ-Potential
± 4.5 (mV)
HCEC-1CT CaCo-2 124 ± 6
106 ± 11 0.32 ± 0.13
0.38 ± 0.18 −56.3 ± 1.2
−32.4 ± 4.5
SW 620 150 ± 5 0.35 ± 0.06 −48.2 ± 3.2
CaCo-2 124 ± 6 0.32 ± 0.13 −56.3 ± 1.2
Intensity-average hydrodynamic diameter and corresponding polydispersity index (PDI) determined by DLS and
SWvalue
ζ-Potential 620 of the exosomes extracted
150 ± from
5 culture medium
0.35 ± of
0.06 −48.2
all investigated cell lines and ± 3.2
suspended in
water. Mean value ± SD are reported, n = 3.
Intensity-average hydrodynamic diameter and corresponding polydispersity index (PDI) determined
by DLS and ζ-Potential value of the exosomes extracted from culture medium of all investigated cell
Western
lines blotting was
and suspended performed
in water. on exosomes
Mean value derivedn from
± SD are reported, = 3. the three different cell lines after
extraction of their total protein content to investigate on the expression level of FZD10 (Figure 2).
Western blotting was performed on exosomes derived from the three different cell lines after
The semi-quantitative analysis proved an expression level of FZD10 in the tumor-derived exosomes
extraction of their total protein content to investigate on the expression level of FZD10 (Figure 2). The
significantly (p < 0.001 versus normal cells) higher than in the exosomes extracted from HCEC-1CT cell
semi-quantitative analysis proved an expression level of FZD10 in the tumor-derived exosomes
line. Moreover, the SW620-derived exosomes were found to present a level of FZD10 higher than that
significantly (p < 0.001 versus normal cells) higher than in the exosomes extracted from HCEC-1CT
found in the CaCo-2-derived exosomes.
cell line. Moreover, the SW620-derived exosomes were found to present a level of FZD10 higher than
that found in the CaCo-2-derived exosomes.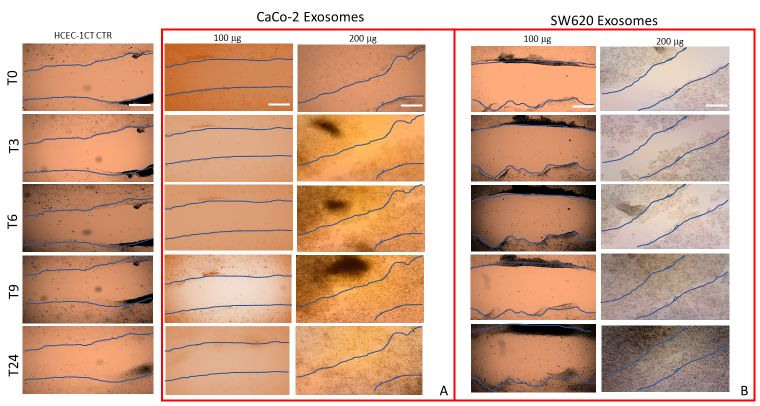
Int. J. Mol. Sci. 2020, 21, 6705                                                                                       4 of 15
       Int. J. Mol. Sci. 2020, 21, x FOR PEER REVIEW                                                             4 of 16

      Figure 2. (A) Representative Western blotting of FZD10 and two exosomal protein markers (Hsp70 and
            Figure 2. (A) Representative Western blotting of FZD10 and two exosomal protein markers (Hsp70
      ALIX); and (B) semi-quantitative estimation, by densitometry of protein bands, of relative FZD10
            and ALIX); and (B) semi-quantitative estimation, by densitometry of protein bands, of relative FZD10
      expression level in exosomes derived from the culture medium of HCEC-1CT, CaCo-2 and SW620.
            expression level in exosomes derived from the culture medium of HCEC-1CT, CaCo-2 and SW620.
      For each   sample, the same total protein content was loaded (20 µg). Molecular mass markers
            For each sample, the same total protein content was loaded (20 µg). Molecular mass markers are
      are indicated
            indicated on
                       on the
                           the right.  For the
                                right. For   the semi-quantitative
                                                 semi-quantitativeanalysis,
                                                                    analysis,  FZD10
                                                                            FZD10       bands
                                                                                    bands    are are  evaluated
                                                                                                  evaluated  uponupon
      normalization   with with
            normalization   the corresponding    housekeeping
                                 the corresponding  housekeeping HSP-70 protein
                                                                   HSP-70        band,
                                                                           protein     forfor
                                                                                   band,    each
                                                                                              eachsample.   (*)pp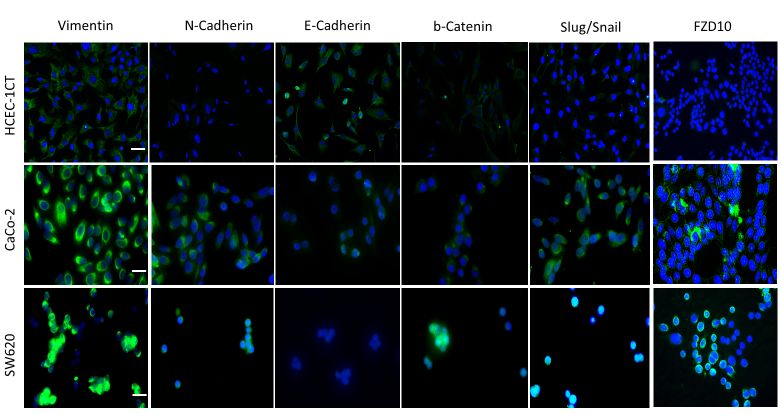
monitor the cell uptake of exosomes proteins, at increasing incubation time (3, 6 and 9 h), by using
confocal microscopy (Figure 3). After 3 h of incubation, the green fluorescent exosomes appeared
localized on the surface of the cells, while their internalization was observed after 6 h. After a 9-h
treatment, a perinuclear localization of fluorescent exosomes, in correspondence of the endoplasmic
reticulum, was noticed. The time dependent cellular uptake for exosomes derived from the two
Int. J. Mol. Sci. 2020, 21, 6705 5 of 15
different cancer cell lines, CaCo-2 and SW620 cells, was characterized by similar trend, as a complete
internalization was observed after 6-h incubation.
Int. J. Mol. Sci. 2020, 21, x FOR PEER REVIEW 5 of 16
Figure 3. Confocal bright field and fluorescence micrographs of fixed HCEC-1CT cells. Time-
dependent uptake of green fluorescent exosomes, freshly extracted exosomes from culture medium
of CaCo-2 and SW 620 cells, in HCEC-1CT cells. Control (CTR) untreated cells. Micrographs of the
cells after 3, 6 and 9 h of treatment with: CaCo-2-derived exosomes (A); and SW620-derived exosomes
(B). Cells in the bright field images (Bright field), in green detection channel (labeled exosomes).
Overlay of bright field and green fluorescence (Merge). Scale bar, 50 µm; magnification, 40×.
2.3. Effect of Treatment with Exosomes on HCEC-1CT Migration
In vitro scratch assay was performed to qualitatively evaluate the effect on the cells of the
incubation with the exosomes, derived from the culture medium of the two cancers cell lines, CaCo-
2 and SW620 cells, on the motility of normal epithelial HCEC-1CT cells, at different time points
(Figure 4). A mechanical scratch (marked in blue) was made on semi confluent cell monolayers, and,
subsequently, the HCEC-1CT cells were treated with exogenous exosomes at different exosomes/cells
concentrations, namely 100 µg/100,000 cells or 200 µg/100,000 cells for 3, 6, 9 and 24 h. The first
investigated time point, T0, is defined as the time when the exosomes were added to the cultures of
the HCEC-1CT cells. Figure 4 shows that, when HCEC-1CT cells were incubated with exosome
Figure
derived Confocal
3. from bright field
the culture and fluorescence
medium of CaCo-2 or micrographs of fixed
SW620 cells, HCEC-1CT cells.
at exosomes/cells Time-dependent
concentration of 200
uptake of green fluorescent exosomes, freshly extracted exosomes from culture
µg/100,000 cells, the extent of the scratch wound appeared significantly reduced already medium of CaCo-2
within and
6 h,
SW 620 cells, in
if compared to HCEC-1CT
corresponding cells.control
Control (CTR)
cells. untreatedclosure
A complete cells. Micrographs of thearea
of the scratched cellswas
afterobserved
3, 6 and
9after
h of 24
treatment
and 9 h, with: CaCo-2-derived
for HCEC-1CT exosomes
cells treated with (A); and SW620-derived
exosomes, extracted fromexosomes
CaCo-2 and (B).SW620
Cells incells,
the
bright field images (Bright field), in green detection channel (labeled exosomes). Overlay
respectively. However, in the case of the scratch healing at 24 h, a partial covering effect due to cellof bright field
and green fluorescence
proliferation cannot be(Merge).
excluded,Scale being bar, 50 µm; magnification,
doubling 40×. h for HCEC-1CT cells.
time equal to 18–24
Figure 4. Qualitative
Figure 4. Qualitativeanalysis
analysisofof collective HCEC-1CTcell
collective HCEC-1CT cellmigration
migration
by inby vitro
in vitro scratch
scratch assay.assay.
Representative micrographs
Representative micrographsof scratch-wound
of scratch-wound closure
closureofofcells
cellstreated
treatedwith
withexosomes derivedfrom
exosomes derived from the
culture
themedium of CaCo-2
culture medium of (A) or SW620
CaCo-2 (A) or(B) cells (B)
SW620 at exosomes/cells concentration
cells at exosomes/cells of 100 µg/100,000
concentration of 100
µg/100,000
and 200 and cells
µg/100,000 200 µg/100,000
for 0, 3, 6,cells
9 andfor 24
0, 3,
h.6,CTR,
9 anduntreated
24 h. CTR,cells.
untreated
Blue cells.
linesBlue lines represent
represent the edges of
the edges of the scratched areas. Scal bar, 50
the scratched areas. Scal bar, 50 µm. Magnification, 10×. μm. Magnification, 10×.
No appreciable
No appreciable evidence
evidence of of scratchclosure
scratch closureover
over time
time was
wasdetected when
detected whenHCEC-1CT
HCEC-1CT cellscells
werewere
treated with exosomes isolated from the two different cancer cell lines at 100 µg/100,000
treated with exosomes isolated from the two different cancer cell lines at 100 µg/100,000 exosomes/cells
exosomes/cells concentration, compared to the corresponding untreated cells. Therefore, the overall
concentration, compared to the corresponding untreated cells. Therefore, the overall results indicateInt. J. Mol. Sci. 2020, 21, 6705 6 of 15
that a Int.
sufficiently high
J. Mol. Sci. 2020, 21, exosomes/cells concentration is necessary to induce enhanced proliferation
x FOR PEER REVIEW 6 of 16 and
an evident collective migration ability in normal epithelial cells, within 24 h.
results indicate that a sufficiently high exosomes/cells concentration is necessary to induce enhanced
proliferation
2.4. Effect and an
of Treatment evident
with collective
Exosomes migration ability
on Deregulation in normal
of C-Myc, epithelial
Vimentin cells, within
and Other 24 Involved
Proteins h. in
EMT on HCEC-1CT Cell Line
2.4. Effect of Treatment with Exosomes on Deregulation of C-Myc, Vimentin and Other Proteins Involved in
Qualitative
EMT on HCEC-1CT and semi-quantitative
Cell Line. Western blotting analysis was carried out to evaluate the
expression level of two EMT protein markers, c-Myc and vimentin, as well as of FZD10 in HCEC-1CT
Qualitative and semi-quantitative Western blotting analysis was carried out to evaluate the
cells, before and after their treatment with exosomes, extracted by the culture medium of CaCo-2 or
expression level of two EMT protein markers, c-Myc and vimentin, as well as of FZD10 in HCEC-
SW6201CT cells, at exosomes/cells
cells, before and after concentration
their treatment of 200exosomes,
with µg/100,000, for 6, 9by
extracted and
the24 h (Figure
culture medium4). The exposure
of CaCo-
of HCEC-1CT
2 or SW620 cells, at exosomes/cells concentration of 200 µg/100,000, for 6, 9 and 24 h (Figure 4).samples
cells to exosomes derived from metastatic SW620 was found to induce, in the The
investigated
exposure at of
9 and 24 h ofcells
HCEC-1CT treatment, a statistically
to exosomes significant
derived from (p <
metastatic 0.001was
SW620 versus
foundcontrol cells)inincrease
to induce, the
of the samples
expression levels ofatc-Myc
investigated 9 and and24 h FZD10 (Figure
of treatment, 5). A significant
a statistically (pInt. J. Mol. Sci. 2020, 21, 6705 7 of 15
Int. J. Mol. Sci. 2020, 21, x FOR PEER REVIEW 7 of 16
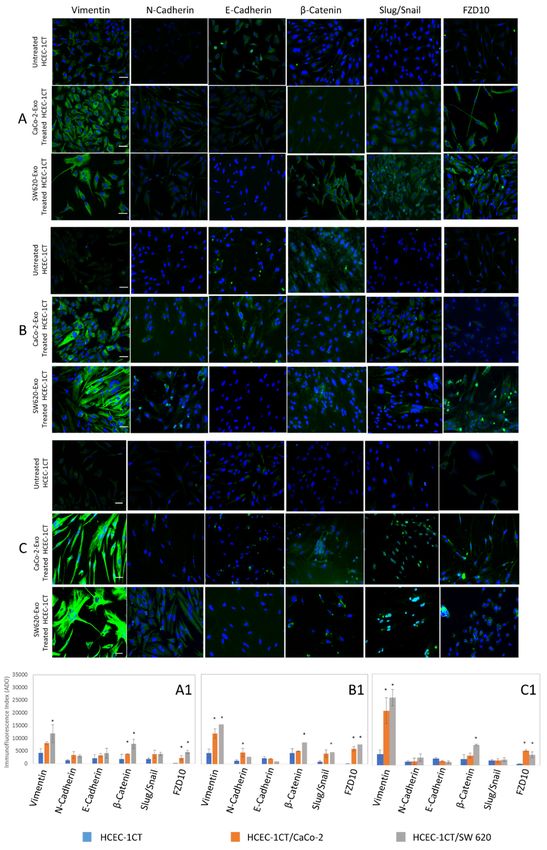
Figure 6. Detection
Figure 6. Detectionofofvimentin,
vimentin, N-cadherin, E-cadherin,β-catenin,
N-cadherin, E-cadherin, β-catenin, Slug/Snail
Slug/Snail and and FZD10
FZD10 by by
immunofluorescence
immunofluorescenceconfocal microscopy
confocal microscopyin in
fixed HCEC-1CT,
fixed HCEC-1CT,CaCo-2
CaCo-2and
andSW620
SW620cells.
cells. Overlay of blue
Overlay of
bluenuclei
stained stained
andnuclei
greenand greenproteins
labeled labeled is
proteins
shownisforshown for line.
each cell each Scale
cell line.
bar,Scale
50 µm;bar, 50 µm;
Magnification,
40×. Magnification, 40×.
Confocal
Confocal microscopy
microscopy imagesofofuntreated
images untreated HCEC-1CT
HCEC-1CTcells cells(Figure 6) and
(Figure the the
6) and corresponding
corresponding
immunofluorescence by mean intensity index of vimentin, N-cadherin,
immunofluorescence by mean intensity index of vimentin, N-cadherin, E-cadherin, β-catenin, E-cadherin, β-catenin,
Slug/Snail
Slug/Snail and FZD10 (Figure 7, blue bars) indicated the presence of very low expression level of
and FZD10 (Figure 7, blue bars) indicated the presence of very low expression level of vimentin,
vimentin, N-cadherin, β-catenin, Slug/Snail and FZD10. In particular, the lowest expression was
N-cadherin, β-catenin, Slug/Snail and FZD10. In particular, the lowest expression was recorded for
recorded for FZD10. Conversely, the expression of the E-cadherin, which is an epithelial and not
FZD10. Conversely,
mesenchymal the expression
marker, of the E-cadherin,
was clearly observed which
in the untreated is an epithelial
HCEC-1CT and itnot
cells, while mesenchymal
resulted less
marker, was clearly
detectable in bothobserved
the cancer in cells.
the untreated
The confocal HCEC-1CT
microscopy cells, whilehighlighted
analysis it resultedthe less detectable
relevant
in both the cancer
expression of thecells.
FZD10The andconfocal microscopy
all EMT marker analysis
proteins, highlighted
except for E-cadherin, the relevant
in both expression
the colon cancer of
the FZD10 and all EMT marker proteins, except for E-cadherin, in both the colon cancer cell lines
cell lines (Figures 6 and 7, blue bars). The confocal microscopy images and immunofluorescence data
expressed
(Figures 6 and 7,byblue
meanbars).
intensity
The index of vimentin,
confocal microscopy N-cadherin,
images and E-cadherin, β-catenin, Slug/Snail
immunofluorescence and
data expressed
FZD10 in HCEC-1CT cells, before and after their treatment with exosomes
by mean intensity index of vimentin, N-cadherin, E-cadherin, β-catenin, Slug/Snail and FZD10 derived from both the in
cancer cell lines, at 3, 7 and 12 days, are reported in Figure 7A–C.
HCEC-1CT cells, before and after their treatment with exosomes derived from both the cancer cell
The immunofluorescence analysis shows a significant increase of fluorescence intensity index (p
lines, at 3, 7 and 12 days, are reported in Figure 7A–C.
< 0.001 versus control cells) of vimentin and FZD10 upon exposure of HCEC-1CT cells to exosomes
The immunofluorescence analysis shows a significant increase of fluorescence intensity index
derived from both the two cancer cell lines, at each investigated incubation time. Expression levels of
(p < 0.001 versus
β-catenin andcontrol cells)
Slug/Snail wereof found
vimentinto beand FZD10 upon
statistically exposure
(p < 0.001 versusof HCEC-1CT
control cells to
cells) higher exosomes
than in
derived from both the two cancer cell lines, at each investigated incubation
the untreated normal cells, at each tested treatment time and at seven days for β-catenin and time. Expression levels of
β-catenin and Slug/Snail
Slug/Snail, only in thewere
case offound to be statistically
HCEC-1CT (pInt. J. Mol. Sci. 2020, 21, 6705 8 of 15
Int. J. Mol. Sci. 2020, 21, x FOR PEER REVIEW 9 of 16
Figure 7. Detection of vimentin, N-cadherin, E-cadherin, β-catenin, Slug/Snail and FZD10 by
Figure 7. Detection of vimentin, N-cadherin, E-cadherin, β-catenin, Slug/Snail and FZD10 by
immunofluorescence confocal microscopy in fixed untreated and exosomes treated HCEC-1CT cells
immunofluorescence confocal microscopy in fixed untreated and exosomes treated HCEC-1CT cells
over time. Confocal microscopy images and immunofluorescence data expressed by mean intensity
over time. Confocal microscopy images and immunofluorescence data expressed by mean intensity
index of HCEC-1CT cells, before and after treatment with the exosomes deriving from the CaCo-2
index of HCEC-1CT cells, before and after treatment with the exosomes deriving from the CaCo-2
and the SW620 culture medium, for three days (A,A1); seven days (B,B1); and twelve days (C,C1).
and the SW620 culture medium, for three days (A,A1); seven days (B,B1); and twelve days (C,C1).
Overlay of blue stained nuclei and green labeled proteins was shown for each cell line. Scale bar, 50 µm;
Overlay of blue stained nuclei and green labeled proteins was shown for each cell line. Scale bar, 50
Magnification, 40×. * p < 0.001.
µm; Magnification, 40×. *p < 0.001.Int. J. Mol. Sci. 2020, 21, 6705 9 of 15
3. Discussion
Exosomes, and generally all EVs, may act as vectors for delivery of specific biological information
and as mediators of intercellular signaling within multicellular organisms in both health and
pathological conditions. One of the mechanisms proposed to define the interaction between exosomes
and plasma membrane of recipient cells is based on the concept of “vesicle–cell fusion”, a process
that allows the vesicles to merge with the plasma membrane of a recipient cell. Different studies
demonstrated the fusion of the exosomes’ membrane derived from cancer cells with recipient cells
by using the fluorescent lipid mixing assay [20]. In this study, two different CRC cell lines, namely
non-metastatic CaCo-2 cells and metastatic SW620 cells, were selected, and the corresponding exosomes
were extracted from their cell culture medium to investigate possible exosomes mediated modifications
that could be induced on normal colon epithelial cells (HCEC-1CT) in terms of migration ability
and expression of FZD10, c-Myc and EMT markers. Firstly, the presence of FZD10 in the exosomes
extracted from the three different cell lines was demonstrated and its expression level was quantitatively
evaluated. The tumor-derived exosomes were characterized by significantly enhanced expression
level of FZD10 compared to the exosomes derived from the normal cells. Interestingly, the exosomes
isolated from the metastatic SW620 cells were found to express the highest level of the investigated
protein. Such evidence confirms the observation of the presence of FZD10 in SW620-derived exosomes,
already reported in a previous in vitro study [21]. Furthermore, FZD10 expression level was compared
for normal and non-metastatic CRC cells. The ability of exosomes to be internalized by HCEC-1CT
cells was investigated by labeling them with a green fluorescent tag. A complete cell uptake of the
tumor-derived exosomes was observed after 6-h incubation of HCEC-1CT cells with exosomes derived
from both the two CRC cell lines. The exosome uptake process can reasonably occur by vesicle–cell
fusion mechanism and, accordingly, ends up in the release of their cargo within the normal cells,
(Figure 3).
Western blotting analysis was performed to evaluate whether the normal HCEC-1CT cells exposure
to the exosomes can stimulate their transformation, by inducing deregulation in the expression of
vimentin and c-Myc, the two main proteins involved in the early stage of EMT, along with FZD10.
Their semi-quantitative analysis revealed that only the exosomes derived from metastatic SW620
induced a statistically significant over-expression of c-Myc, vimentin and FZD10 in HCEC-1CT cells
within 24 h. Vimentin, one of the proteins expressed during the cell transition, plays a crucial role in
embryonic development, wound healing, inflammation and regeneration, as well as in the oncogenic
transformation and dissemination of a malignant tumor [22]. Therefore, vimentin is a well-established
canonical marker of EMT reprogramming, associated with the acquisition of a migratory and invasive
tumor cell phenotype [23], with an early overexpression during the transition.
The c-Myc oncogene is involved in the control of several normal cellular functions including
growth, proliferation, migration, differentiation, angiogenesis and regulation of apoptosis mechanisms.
The active role of overexpressed c-Myc as promoter of EMT and aggressive carcinoma has widely been
demonstrated [24–28]. Aberrant expression of c-Myc was achieved in many human cancers and, it was
found increased up to 70–80% in CRC [29].
In particular, during the carcinogenesis, dysregulation of Wnt/β-catenin signaling pathway is
reported as a common event, that induces the nuclear translocation of β-catenin and upregulation of the
expression of c-Myc, due to EMT activation [30,31]. A recent clinical study reported by Lee K. S. et al.
evidenced the c-Myc and β-catenin over-expression in CRC patients [32]. FZD10 is a member of
the frizzled gene family, which code for different proteins and function as receptors for the Wnt
signaling proteins. Different studies suggested the active role of FZD10 during CRC progression, as its
overexpression induced a consequent over-activity of Wnt/β-catenin [33]. The relevant involvement of
the FZD10 in CRC was also proved by our in vitro study, which revealed the presence of FZD10 and
FZD10-mRNA in exosomes extracted from culture medium of the metastatic CRC, gastric, hepatic
and cholangial cancer cell lines, namely HGC-27, SW-620, N-87 and HUCCT-1 cells. A substantial
reduction in FZD10 and FZD10-mRNA level in FZD10-mRNA silenced cells and in their correspondingInt. J. Mol. Sci. 2020, 21, 6705 10 of 15
exosomes was observed, and a significant decrease in viability of the silenced cells compared to their
respective controls was demonstrated. The restoration of the cell viability, as well as of the FZD10
and FZD10-mRNA level, was promoted by incubation of silenced cells with the exosomes isolated
by culture medium of the same untreated cells [21]. Remarkably, our clinical study established an
active role for FZD10, delivered in small extracellular vesicles, as a potential biomarker for the early
diagnosis of CRC and gastric cancer and for monitoring the treatment response [19].
Here, we found that the c-Myc oncogene, whose regulation is correlated to the canonical cascade
of Wnt, was upregulated in normal cells, along with FZD10 and vimentin, upon stimulation by the
exosomes derived from the metastatic SW620 cells, which were demonstrated to present a FZD10
level higher than that found in the exosomes isolated from the normal and non-metastatic cells.
Therefore, the over-expression of c-Myc, vimentin and FZD10 induced on HCEC-1CT cells within
24 h by stimulation with exosomes derived from metastatic SW620 provides a clear indication of the
activation of EMT in normal cells. Interestingly, an essential role of FZD10, that is an active receptor
involved in the Wnt signal and delivered by exosomes, in the triggering the activation of the entire
tumor cascade in normal cells, can be reasonably expected. Such an assumption is supported by the
results reported by C. Gong et al. concerning the involvement of the FZD10 in the spread of the
metastasizing signal, in breast cancer [34].
After assessing the early activation of c-Myc protein, vimentin and FZD10 during treatment with
tumor-derived exosomes, the expression of other proteins involved in EMT, such as N-cadherin,
E-cadherin, b-catenin and Slug/Snail, combined with vimentin and FZD10, was evaluated by
immunofluorescence analysis at long exposure times, namely at 3, 7 and 12 days.
Statistically, a significant increase of vimentin and FZD10 expression was recorded when
HCEC-1CT cells were incubated with exosomes isolated by either the two cancer cell lines, at each
investigated incubation time. EMT is also governed by several signaling pathways that exhibit complex
interactions with vimentin, such as snail and slug over-expression and migration of the proteins from
cytoplasm into the nucleus, with a consequent increase of malignancy [35,36]. Snail and Slug are EMT
inducing transcription factors, having a distribution that was found to depend on phosphorylation of a
Ser-rich sequence adjacent to a nuclear export sequence (NES). D. Domínguez et al. demonstrated that
the modification of such a sequence allows the nuclear export of the protein, and that phosphorylation
and subcellular distribution of Snail are controlled by cell attachment to the extracellular matrix.
These findings established the existence in tumor cells of an effective and fine-tuned non-transcriptional
mechanism of Snail activity regulation dependent on the extracellular environment [37]. In our
experiments, the expression of Slug/Snail increased over time in a statistically significant manner,
when compared to the control cells, only when HCEC-1CT were treated with exosomes derived from
metastatic SW620. Complete migration into the nucleus was evident after 12 days. Higher expression
level of β-catenin was also achieved over time when HCEC-1CT were exposed to exosomes derived
from metastatic SW620, and its localization into the cell nuclei was observed after three-day incubation.
Aberrant Wnt signaling is a prominent feature of several cancers, especially CRCs, which was found in
90% of cases to exhibit overexpression of β-catenin [38,39].
The overall outcome of this study highlights that CRC-derived exosomes can be internalized by
normal colon epithelial cells, and then release their cargo there in and induce cell reprogramming.
The exosomes derived from the metastatic cell line, with a higher FZD10 level, were found to represent
more efficient mediators of cell–cell communication, compared to exosomes extracted from the
non-metastatic cells. They were able to trigger in normal cells the acquisition of an enhanced motility,
which is an established mesenchymal feature, and, especially, the stimulation of EMT activation in
the normal cell lines. Indeed, exposure of the normal cells to SW620-derived exosomes induced the
over-expression of FZD10 along with specific EMT involved proteins.
Here, original experimental evidence indicates that FZD10 delivering exosomes may function as
messengers of cellular modifications and metastasis process in CRC, although further investigation
is needed to fully elucidate the process. The results of the performed investigation suggests thatInt. J. Mol. Sci. 2020, 21, 6705 11 of 15
FZD10, a membrane receptor mediating the activation of the canonical pathway of Wnt and delivered
by circulating tumor-derived exosomes, can represent a relevant player in promoting the CRC
propagation, with autocrine and paracrine action and also above all in the metastatic sites, in the
context of colorectal carcinogenesis.
4. Materials and Methods
4.1. Cell Culture
CaCo-2 human colorectal adenocarcinoma cells and metastatic SW-620 colon cancer cells were
purchased from ATCC (LGC Standards S.r.l. Sesto San Giovanni, Milan, Italy). Human colon epithelial
cell line HCEC-1CT was purchased from EverCyte (Evercyte GmbH. Vienna, Austria). All cell lines
were cultivated accordingly to retailer protocols, using FBS depleted of exosomes, in all cultures.
4.2. Exosomes Extraction
The exosomes were extracted with the Total Exosome Isolation (from cell culture media)
kit (Invitrogen, Carlsbad, CA, USA), according to the retailer protocols, in sterile conditions.
After harvesting, the cell culture media was centrifuged at 2000× g for 30 min to remove cells
and debris and, then, the supernatant was transferred to a new sterile tube. The required volume
of the Total Exosome Isolation reagent was added and mixed with the medium by vortexing until a
homogeneous solution was obtained and the tube was incubated in the fridge overnight. Successively,
the mixture was centrifuged at 10,000× g for 1 h at 4 ◦ C, the supernatant was discarded and the
pellet-contained exosomes were resuspended in 200 µL of sterile water. The exosomes were then ready
for their characterization, protein extraction or incubation with cells. The extracted exosomes were
stored at −80 ◦ C until proteins analysis was performed.
4.3. Transmission Electron Microscopy Investigation
Transmission Electron Microscopy (TEM) investigation was performed on exosomes by using
a Jeol Jem-1011 microscope, working at an accelerating voltage of 100 kV. An Olympus Quemesa
Camera (11 Mpx) was used to acquire the images. Staining of samples was performed according to the
experimental procedure reported in Scavo M. P. et al. [21].
4.4. Dynamic Light Scattering (DLS) and ζ-Potential Investigation
The extracted exosomes were evaluated in terms of size distribution, hydrodynamic diameter,
stability and corresponding polydispersity index (PDI) by using A Zetasizer Nano ZS (Malvern
Instruments Ltd., Worcestershire, UK). The instrument operates with a 4 mW He-Ne laser as a
light source (wavelength λ = 633 nm). A disposable folded capillary cell, DTS1070 (Malvern
Instruments Ltd., Worcestershire, UK), was used, as already reported by Depalo et al. [40].
Three consecutive measurements were performed on each sample to obtain data reported as average
value ± standard deviation.
4.5. Labeling of Exosomes
After their extraction from CaCo-2 and SW620 culture medium, the exosomes were fluorescently
labeled by using the Green ExoGlow-Protein EV labeling kit (System Bioscience, Palo Alto, CA, USA),
a fluorescent tag that specifically marks EVs protein cargo. The exosomes were treated according to
the protocol form described by SBI. Briefly, exosomes were resuspended in 500 µL of sterile phosphate
buffer (PBS 7.4 pH); then, the fluorescent tag was added and incubated with exosomes at 37 ◦ C
and shook for 20 min. After addition of 167 µL of ExoQuick-TC (System Bioscience, Palo Alto, CA,
USA), the resulting mixture was further incubated overnight at 4 ◦ C and, subsequently, centrifuged at
10,000 rpm for 10 min. The supernatant was carefully aspirated, while the exosomes were recovered as
pellet and resuspended in a proper volume of PBS in order to obtain a concentration of total proteinsInt. J. Mol. Sci. 2020, 21, 6705 12 of 15
suitable to proceed with the experiments. The total proteins content was evaluated by means of
Bradford assay (Bio-Rad Hercules, CA, USA). The same procedure was used for untreated exosomes.
4.6. Exosomes Uptake
HCEC-1CT cells (100,000 cells/well) were seeded in a 6-well plate for uptake studies and when
they reached 70% of confluence, 100 µg (in terms of total protein content) of labeled exosomes were
added to the fresh medium in each well, and the uptake was monitored at fixed time points, namely at
0, 3, 6, 9 and 24 h (T0 , T3 , T6 , T9 and T24 ), using the Eclipse Ti2 by Nikon confocal microscope (Nikon,
Tokyo, Japan). The images were acquired by using a Kr-Ar and Ar lasers for the observation of labeled
exosomes (488 nm) or bright field for visualization of the cells (40× magnification).
4.7. Migration Assay
For the migration assay, the scratch test was performed. Briefly, HCEC-1CT cells were seeded
into 6-well plate (100,000 cells/well) and cultured by using the ColoUp medium (Evercyte GmbH.
Vienna Austria) conditioned with exosomes derived from CaCo-2 or SW620 at two different protein
concentrations (100 or 200 µg of total exosomes proteins for 100,000 cells) and supplemented with
10% of exosomes-depleted FBS (Evercyte GmbH. Vienna Austria), sodium pyruvate, 4.5 g/L glucose,
4 mM L-Glutamine and 5 mL Pen-Strep (Gibco, Waltham, MA, USA). Cells were grown until reaching
semi-confluence, in a humidified incubator at 37 ◦ C with an atmosphere containing 5% of CO2 . Then,
a scratch was made on the cell monolayer by using a p200 pipette tip. The plate was washed with
sterile PBS and the medium replaced with ColoUp added with 5% of exosome-depleted FBS, and with
exosomes derived from CaCo-2 or SW620 cell medium, at the two different reported concentrations.
In the case of untreated cells (control), only exosome-depleted cell cultured medium was used.
The cell migration was monitored, capturing at regular intervals (every three hours) micrographs
of the same region of the cell monolayer at 10× magnification. The micrographs were acquired and
analyzed by using the Eclipse Ti2 by Nikon confocal microscope in bright field.
4.8. Western Blotting Analysis
Western blotting analysis was performed for total proteins extracted from exosomes derived from
CaCo-2 and SW620 and for HCEC-1CT cells, untreated or treated with exosomes derived from both
cancer cell lines, as previously described [39]. Untreated cells maintained in culture medium for 24 h
were used as control. The method used for proteins extraction, total proteins amount quantification and
the immunoblotting, was reported in Scavo M. P. et al. [21]. Anti-FZD10 (1:400 Abcam, Cambridge, UK),
anti Alix (1:1000 Cell signaling, Danvers, MA, USA), anti-HSP-70 (1:500 Cell signaling, Danvers, MA,
USA), anti-GAPDH (1:1000 Abcam, Cambridge, UK), anti-C-Myc and anti-Vimentin (both 1:1000 Cell
signaling, Danvers, MA, USA) were used as primary antibodies and the Western blotting membranes
were incubated with each of them overnight. Then, the membranes were treated with the corresponding
HRP-conjugated secondary antibodies [1:1000 Santa Cruz, Santa Cruz, CA, USA] by following the
previously reported protocol [21]. The chemiluminescence signals from proteins were imaged after
incubation by using an enhanced chemiluminescence kit (Bio-Rad, Hercules, CA, USA) by Chemidoc
XRS+ (Bio-Rad, Hercules, CA, USA). The images were analyzed by using Image Lab 5.2.1 software.
Each experiment was repeated three times.
4.9. Immunofluorescence Analysis
Immunofluorescence analysis was performed using HCEC-1CT cells seeded into sterile slide
chambers at a density of 1 × 10³ cells/well per each well. After 24 h, the cells were treated with
exosomes derived from CaCo-2 or SW620 culture medium, at a concentration in terms of total exosome
proteins equal to 200 µg/µL, for 15 days with administration of exosomes every 48 h. Every three
days, a slide chamber for HCEC-1CT cells treated with exosomes derived from CaCo-2 or SW620
conditioned medium was fixed with cold 96◦ ethanol prior to immunofluorescence analysis and forInt. J. Mol. Sci. 2020, 21, 6705 13 of 15
EMT markers detection. CaCo-2 cells and SW620 were also analyzed by immunofluorescence to
evaluate the expression of the EMT markers and FZD10 in each investigated cell line. The experiments
were repeated three times. All cells lines (HCEC-1CT, CaCo-2 and SW620) were seeded into sterile slide
chambers (8 wells each) at a density of 1 × 10³ cells/well at 37 ◦ C. The immunofluorescence analysis
was performed to detect the EMT markers in cells cultured with exosomes derived from CaCo-2
and SW620, using a concentration of total exosomes proteins already used in the other experiment
before (200 µg/100,000 cells). The analysis was performed by following the same protocol reported
in a previous study [21], using the primary antibodies against vimentin (rabbit polyclonal from Cell
Signaling, Danvers, MA, USA), E-cadherin (rabbit polyclonal from BD, Franklin Lakes, NJ, USA),
N-cadherin (mouse monoclonal from abCam, Cambridge, UK), β-catenin (rabbit polyclonal from
abCam, Cambridge, UK), Slug/Snail (rabbit polyclonal from abCam, Cambridge, UK) and FDZ10 (rabbit
polyclonal from abCam, Cambridge, UK). The cells were then incubated with a specific conjugated
secondary anti-rabbit or anti-mouse IgG Alexa 488 (Invitrogen) for 1 h and mounted using prolong
gold antifade reagent containing 40 ,6-diamidino-2-phenylindole, DAPI (Invitrogen, Waltham, MA,
USA). Images were acquired and analyzed by means of Eclipse Ti2 by Nikon confocal microscope.
Kr-Ar laser with 488 nm band-pass filter was used for imaging vimentin, E-cadherin, N-cadherin,
β-catenin, Slug/Snail and FZD10 (green channel), while Ar laser with 358-nm band-pass filter was used
for imaging the DAPI for nuclear counterstaining (blue channel). All images were at 20× magnification.
The fluorescence intensity was measured by using an exposure time of 200 ms and 1× gain per
each acquisition for all the investigated samples and was quantified by means of Image-j software,
by evaluating the number of pixel/areas. Each experiment was repeated three times.
4.10. Statistical Analysis
The Sigmastat 3.1 software was used for statistical analysis. Statistical significance between
the two groups was assessed using the Student’s t-test (unpaired), and multiple comparisons were
performed by using a one-way analysis of variance. The Kruskal–Wallis test was applied when the
hypothesis of equality among groups was rejected by the one-way analysis of variance. We considered
the occurrence of statistically significant difference between the results for each cell line and those of
the corresponding untreated cells for p < 0.001.
Author Contributions: Conceptualization, M.P.S.; methodology, M.P.S., F.R., N.D., and E.F.; software, C.I.;
validation, M.P.S., N.D., and E.F.; formal analysis, M.P.S., N.D., and C.I.; investigation, M.P.S., F.R., and E.F.;
resources, G.G.; data curation, M.P.S., N.D., and M.L.C.; writing—original draft preparation, M.P.S. and N.D.;
writing—review and editing, M.P.S., N.D., and M.L.C.; supervision, G.G.; and funding acquisition, G.G. All authors
have read and agreed to the published version of the manuscript.
Funding: This research was funded by Italian Minister of Health, Grant: Ricerca Corrente.
Conflicts of Interest: The authors declare no conflict of interest.
References
1. Crescitelli, R.; Lässer, C.; Szabó, T.G.; Kittel, A.; Eldh, M.; Dianzani, I.; Buzás, E.I.; Lötvall, J. Distinct
RNA profiles in subpopulations of extracellular vesicles: Apoptotic bodies, microvesicles and exosomes.
J. Extracell Vesicles 2013, 2, 20677. [CrossRef]
2. Colombo, M.; Raposo, G.; Thery, C. Biogenesis, secretion, and intercellular interactions of exosomes and
other extracellular vesicles. Annu. Rev. Cell Dev. Biol. 2014, 30, 255–289. [CrossRef] [PubMed]
3. Scavo, M.P.; Depalo, N.; Tutino, V.; De Nunzio, V.; Ingrosso, C.; Rizzi, F.; Notarnicola, M.; Curri, M.L.;
Giannelli, G. Exosomes for Diagnosis and Therapy in Gastrointestinal Cancers. Int. J. Mol. Sci. 2020, 21, 367.
[CrossRef] [PubMed]
4. Garcia-Olmo, D.; Garcia-Olmo, D.C.; Ontanon, J.; Martinez, E.; Vallejo, M. Tumor DNA circulating in
the plasma might play a role in metastasis. The hypothesis of the genometastasis. Histol. Histopathol.
1999, 14, 1159–1164. [CrossRef] [PubMed]Int. J. Mol. Sci. 2020, 21, 6705 14 of 15
5. Abdouh, M.; Zhou, S.; Arena, V.; Arena, M.; Lazaris, A.; Onerheim, R.; Metrakos, P.; Arena, G.O. Transfer
of malignant trait to immortalized human cells following exposure to human cancer serum. J. Exp. Clin.
Cancer Res. 2014, 33, 86. [CrossRef] [PubMed]
6. Hamam, D.; Abdouh, M.; Gao, Z.H.; Arena, V.; Arena, M.; Arena, G.O. Transfer of malignant trait to
BRCA1 deficient human fibroblasts following exposure to serum of cancer patients. J. Exp. Clin. Cancer Res.
2016, 35, 80. [CrossRef] [PubMed]
7. Abd Elmageed, Z.Y.; Yang, Y.; Thomas, R.; Ranjan, M.; Mondal, D.; Moroz, K.; Fang, Z.; Rezk, B.M.;
Moparty, S.; Sikka, S.C.; et al. Neoplastic reprogramming of patient-derived adipose stem cells by prostate
cancer cell-associated exosomes. Stem Cells 2014, 32, 983–997. [CrossRef]
8. Saleem, S.N.; Abdel-Mageed, A.B. Tumor-derived exosomes in oncogenic reprogramming and cancer
progression. Cell. Mol. Life Sci. 2015, 72, 1–10. [CrossRef]
9. Boyer, B.; Tucker, G.C.; Vallés, A.M.; Franke, W.W.; Thiery, J.P. Rearrangements of desmosomal and
cytoskeletal proteins during the transition from epithelial to fibroblastic organization in cultured rat bladder
carcinoma cells. J. Cell Biol. 1989, 109, 1495–1509. [CrossRef]
10. Conacci-Sorrell, M.; Simcha, I.; Ben-Yedidia, T.; Blechman, J.; Savagner, P.; Ben-Ze’ev, A. Autoregulation of
E-cadherin expression by cadherin–cadherin interactions: The roles of -catenin signaling, Slug, and MAPK.
J. Cell Biol. 2003, 163, 847–857. [CrossRef]
11. Cowling, V.H.; Cole, M.D. E-cadherin repression contributes to c-Myc-induced epithelial cell transformation.
Oncogene 2007, 26, 3582–3586. [CrossRef] [PubMed]
12. Liu, C.-Y.; Lin, H.-H.; Tang, M.-J.; Wang, Y.-K. Vimentin contributes to epithelial-mesenchymal transition
cancer cell mechanics by mediating cytoskeletal organization and focal adhesion maturation. Oncotarget
2015, 6, 15966–15983. [CrossRef] [PubMed]
13. Paszek, M.J.; Zahir, N.; Johnson, K.R.; Lakins, J.N.; Rozenberg, G.I.; Gefen, A.; Reinhart-King, C.A.;
Margulies, S.S.; Dembo, M.; Boettiger, D. Tensional homeostasis and the malignant phenotype. Cancer Cell.
2005, 8, 241–254. [CrossRef] [PubMed]
14. Butcher, D.T.; Alliston, T.; Weaver, V.M. A tense situation: Forcing tumour progression. Nat. Rev. Cancer
2009, 9, 108–122. [CrossRef] [PubMed]
15. Rennoll, S.; Yochum, G. Regulation of MYC gene expression by aberrant Wnt/β-catenin signaling in colorectal
cancer. World J. Biol. Chem. 2015, 6, 290–300. [CrossRef]
16. Nagayama, S.; Yamada, E.; Kohno, Y.; Aoyama, T.; Fukukawa, C.; Kubo, H.; Watanabe, G.; Katagiri, T.;
Nakamura, Y.; Sakai, Y.; et al. Inverse correlation of the up-regulation of FZD10 expression and the activation
of beta-catenin in synchronous colorectal tumors. Cancer Sci. 2009, 100, 405–412. [CrossRef]
17. Nagayama, S.; Fukukawa, C.; Katagiri, T.; Okamoto, T.; Aoyama, T.; Oyaizu, N.; Imamura, M.; Toguchida, J.;
Nakamura, Y. Therapeutic potential of antibodies against FZD 10, a cell-surface protein, for synovial sarcomas.
Oncogene 2005, 24, 6201–6212. [CrossRef]
18. Scavo, M.P.; Fucci, L.; Caldarola, L.; Mangia, A.; Azzariti, A.; Simone, G.; Gasparini, G.; Krol, S. Frizzled-10 and
cancer progression: Is it a new prognostic marker? Oncotarget 2017, 9, 824–830. [CrossRef]
19. Scavo, M.P.; Cigliano, A.; Depalo, N.; Fanizza, E.; Bianco, M.G.; Denora, N.; Laquintana, V.; Curri, M.L.;
Lorusso, D.; Lotesoriere, C.; et al. Frizzled-10 Extracellular Vesicles Plasma Concentration Is Associated with
Tumoral Progression in Patients with Colon and Gastric Cancer. J. Oncol. 2019, 2019, 2715968. [CrossRef]
20. Parolini, I.; Federici, C.; Raggi, C.; Lugini, L.; Palleschi, S.; De Milito, A.; Coscia, C.; Iessi, E.; Logozzi, M.;
Molinari, A.; et al. Microenvironmental pH is a key factor for exosome trafficintumorcells. J. Biol. Chem.
2009, 284, 34211–34222. [CrossRef]
21. Scavo, M.P.; Depalo, N.; Rizzi, F.; Ingrosso, C.; Fanizza, E.; Chieti, A.; Messa, C.; Denora, N.; Laquintana, V.;
Striccoli, M.; et al. FZD10 Carried by Exosomes Sustains Cancer Cell Proliferation. Cells 2019, 8, 777.
[CrossRef] [PubMed]
22. Chernoivanenko, I.S.; Minin An., A.; Minin, A.A. Role of vimentin in cell migration. Ontogenez 2013,
44, 144–157. [CrossRef]
23. Chung, B.M.; Rotty, J.D.; Coulombe, P.A. Networking galore: Intermediate filaments and cell migration.
Curr. Opin. Cell Biol. 2013, 25, 600–612. [CrossRef] [PubMed]
24. Elbadawy, M.; Usui, T.; Yamawaki, H.; Sasaki, K. Emerging Roles of c-Myc in Cancer Stem Cell-Related
Signaling and Resistance to Cancer Chemotherapy: A Potential Therapeutic Target against Colorectal Cancer.
Int. J. Mol. Sci. 2019, 20, 2340. [CrossRef] [PubMed]Int. J. Mol. Sci. 2020, 21, 6705 15 of 15
25. Karlsson, A.; Deb-Basu, D.; Cherry, A.; Turner, S.; Ford, J.; Felsher, D.W. Defective double-strand DNA
break repair and chromosomal translocations by MYC overexpression. Proc. Natl. Acad. Sci. USA 2003,
100, 9974–9979. [CrossRef] [PubMed]
26. Anderson, S.; Poudel, K.R.; Roh-Johnson, M.; Brabletz, T.; Yu, M.; Borenstein-Auerbach, N.; Grady, W.N.;
Bai, J.; Moens, C.B.; Eisenman, R.N.; et al. MYC-nick promotes cell migration by inducing fascin expression
and Cdc42 activation. Proc. Nat. Acad. Sci. USA 2016, 113, E5481–E5490. [CrossRef]
27. Bin Cho, K.; Cho, M.K.; Lee, W.Y.; Kang, K.W. Overexpression of c-Myc induces epithelial mesenchymal
transition in mammary epithelial cells. Cancer Lett. 2010, 293, 230–239. [CrossRef]
28. Supernat, A.M.; Markiewicz, A.; Sejda, A.; Seroczynska, B.; Skokowski, J.; Szade, J.; Welnicka-Jaskiewicz, M.;
Nastaly, P.; Bednarz-Knoll, N.; Zaczek, A.J. Correlation of C-Myc with Epithelial-Mesenchymal Transition
Phenotype. Ann. Oncol. 2012, 23, 2. [CrossRef]
29. He, W.-L.; Weng, X.-T.; Wang, J.-L.; Lin, Y.-K.; Liu, T.-W.; Zhou, Q.-Y.; Hu, Y.; Pan, Y.; Chen, X.-L. Association
between c-Myc and Colorectal Cancer Prognosis: A Meta-Analysis. Front. Physiol. 2018, 9, 1549. [CrossRef]
30. Zhang, S.; Li, Y.; Wu, Y.; Shi, K.; Bing, L.; Hao, J. Wnt/β-catenin signaling pathway upregulates c-Myc
expression to promote cell proliferation of P19 teratocarcinoma cells. Anat. Rec. (Hoboken) 2012, 295, 2104–2113.
[CrossRef]
31. He, T.C.; Sparks, A.B.; Rago, C.; Hermeking, H.; Zawel, L.; da Costa, L.T.; Morin, P.J.; Vogelstein, B.;
Kinzler, K.W. Identification of c-MYC as a target of the APC pathway. Science 1998, 281, 1509–1512. [CrossRef]
[PubMed]
32. Lee, K.S.; Kwak, Y.; Han Nam, K.; Kim, D.W.; Kang, S.B.; Choe, G.; Kim, W.H.; Lee, H.S. Favorable prognosis
in colorectal cancer patients with co-expression of c-Myc and ß-catenin. BMC Cancer 2016, 16, 730. [CrossRef]
[PubMed]
33. Terasaki, H.; Saitoh, T.; Shiokawa, K.; Katoh, M. Frizzled-10, up-regulated in primary colorectal cancer, is a
positive regulator of the WNT - beta-catenin - TCF signaling pathway. Int. J. Mol. Med. 2002, 9, 107–112.
[CrossRef] [PubMed]
34. Gong, C.; Qu, S.; Lv, X.B.; Liu, B.; Tan, W.; Nie, X.; Su, F.; Liu, Q.; Yao, H.; Song, E. BRMS1L suppresses
breast cancer metastasis by inducing epigenetic silence of FZD10. Nat. Commun. 2014, 5, 5406. [CrossRef]
[PubMed]
35. Cano, A.; Pérez-Moreno, M.A.; Rodrigo, I.; Locascio, A.; Blanco, M.J.; del Barrio, M.G.; Portillo, F.; Nieto, M.A.
The transcription factor snail controls epithelial-mesenchymal transitions by repressing E-cadherin expression.
Nat. Cell Biol. 2000, 2, 76–83. [CrossRef] [PubMed]
36. Virtakoivu, R.; Mai, A.; Mattila, E.; De Franceschi, N.; Imanishi, S.Y.; Corthals, G.; Kaukonen, R.; Saari, M.;
Cheng, F.; Torvaldson, E.; et al. Vimentin-ERK Signaling Uncouples Slug Gene Regulatory Function.
J. Cancer Res. 2015, 75, 2349–2362. [CrossRef]
37. Domínguez, D.; Montserrat-Sentís, B.; Virgo’s-Soler, A.; Guaita, S.; Grueso, J.; Porta, M.; Puig, I.; Baulida, J.;
Francí, C.; García de Herreros, A. Phosphorylation Regulates the Subcellular Location and Activity of the
Snail Transcriptional Repressor. Mol. Cell. Biol. 2003, 5078–5089. [CrossRef]
38. Schmalhofer, O.; Brabletz, S.; Brabletz, T. E-cadherin, β-catenin, and ZEB1 in malignant progression of cancer.
Cancer Metastasis Rev. 2009, 28, 151–166. [CrossRef]
39. Mylavarapu, S.; Kumar, H.; Kumari, S.; Sravanthi, L.S.; Jain, M.; Basu, A.; Biswas, M.; Mylavarapu, S.V.S.;
Das, A.; Roy, M. Activation of Epithelial-Mesenchymal Transition and Altered β-Catenin Signaling in a
Novel Indian Colorectal Carcinoma Cell Line. Front. Oncol. 2019, 9, 54. [CrossRef]
40. Depalo, N.; Fanizza, E.; Vischio, F.; Denora, N.; Laquintana, V.; Cutrignelli, A.; Striccoli, M.; Giannelli, G.;
Agostiano, A.; Curri, M.L.; et al. Imaging modification of colon carcinoma cells exposed to lipid based
nanovectors for drug delivery: A scanning electron microscopy investigation. RSC Adv. 2019, 9, 21810.
[CrossRef]
© 2020 by the authors. Licensee MDPI, Basel, Switzerland. This article is an open access
article distributed under the terms and conditions of the Creative Commons Attribution
(CC BY) license (http://creativecommons.org/licenses/by/4.0/).You can also read