Pirfenidone modifies hepatic miRNAs expression in a model of MAFLD/NASH
←
→
Page content transcription
If your browser does not render page correctly, please read the page content below
www.nature.com/scientificreports
OPEN Pirfenidone modifies hepatic
miRNAs expression in a model
of MAFLD/NASH
Rebeca Escutia‑Gutiérrez1, J. Samael Rodríguez‑Sanabria1, C. Alejandra Monraz‑Méndez1,
Jesús García‑Bañuelos1, Arturo Santos‑García2, Ana Sandoval‑Rodríguez1,3* &
Juan Armendáriz‑Borunda1,2,3*
miRNAs are involved in the development of metabolic associated fatty liver disease (MAFLD) and
nonalcoholic steatohepatitis (NASH). We aimed to evaluate modifications by prolonged-release
pirfenidone (PR-PFD) on key hepatic miRNAs expression in a MAFLD/NASH model. First, male
C57BL/6J mice were randomly assigned into groups and fed with conventional diet (CVD) or high fat
and carbohydrate diet (HFD) for 16 weeks. At the end of the eighth week, HFD mice were divided in
two and only one half was treated with 300 mg/kg/day of PR-PFD mixed with food. Hepatic expression
of miRNAs and target genes that participate in inflammation and lipid metabolism was determined by
qRT-PCR and transcriptome by microarrays. Increased hepatic expression of miR-21a-5p, miR-34a-5p,
miR-122-5p and miR-103-3p in MAFLD/NASH animals was reduced with PR-PFD. Transcriptome
analysis showed that 52 genes involved in lipid and collagen biosynthesis and inflammatory response
were downregulated in PR-PFD group. The expression of Il1b, Tnfa, Il6, Tgfb1, Col1a1, and Srebf1
were decreased in PR-PFD treated animals. MAFLD/NASH animals compared to CVD group showed
modifications in gene metabolic pathways implicated in lipid metabolic process, inflammatory
response and insulin resistance; PR-PFD reversed these modifications.
Metabolic associated fatty liver disease (MAFLD), previously known as non-alcoholic fatty liver disease is cur-
rently the most common cause of chronic liver disease worldwide1,2. MAFLD is characterized by hepatic steatosis
accompanied by one of three features: overweight or obesity, type 2 diabetes mellitus (T2DM), or either lean
or normal weight with evidence of metabolic d ysregulation3. MAFLD prevalence is rising due to the global
obesity epidemic and high prevalence of type II diabetes m ellitus4,5. It is estimated that up to a third of the
world population will present the disease in a nearby future6,7. Population studies have estimated a prevalence
of 17–22% in asymptomatic p atients8,9. The progressive form of MALFD condition; nonalcoholic steatohepati-
tis (NASH), is defined by liver cell damage, lobular inflammatory infiltrate, and a variable degree of fi brosis10.
Several microRNAs (miRNAs) are involved in MAFLD progression and NASH pathology. miRNAs are highly
conserved non-coding RNAs that epigenetically regulate gene expression at post-transcriptional level. miRNAs
involved in lipid synthesis, catabolism of fatty acids and glucose and inflammation, are known to be dysregu-
lated in MAFLD/NASH11,12; including miR-122-5p, miR-34a-5p, miR-21a-5p and miR-103-3p13–16. miR-122-5p
is the most expressed miRNA in adult human liver (approximately 70% of total miRNAs) and its key role in
total serum cholesterol regulation and liver lipids metabolism has been clearly d emonstrated17,18. miR-34a-5p is
involved in lipid metabolism, apoptosis, cell cycle control, and studies in mice have shown how overexpression
of miR-34a-5p increases the level of liver triglycerides19,20. Likewise, it has been demonstrated that miR-103-3p
regulates insulin sensitivity and glucose h omeostasis21,22; while miR-21a-5p may be involved at different stages
of MAFLD progression, in buildup of lipids, appearance of steatosis in hepatocytes and/or inflammation at early
stages and fibrosis at a later stage of the d isease23,24.
Several drugs are currently being investigated for the treatment of NASH, notwithstanding, there are no
current FDA approved therapies for treating NASH. Given the vast complexity of NASH where lipid metabo-
lism, insulin resistance, oxidative stress, inflammation and fibrosis pathways are involved, a drug with multiple
1
Department of Molecular Biology and Genomics, Institute for Molecular Biology in Medicine and Gene Therapy,
Health Sciences University Center, University of Guadalajara, Guadalajara, Jalisco, Mexico. 2Tecnologico de
Monterrey, School of Medicine and Health Sciences, Zapopan, Jalisco, Mexico. 3Institute for Molecular Biology
and Gene Therapy, CUCS, University of Guadalajara, 950 Sierra Mojada, 44340 Guadalajara, Mexico. *email:
anasol44@hotmail.com; armdbo@gmail.com
Scientific Reports | (2021) 11:11709 | https://doi.org/10.1038/s41598-021-91187-2 1
Vol.:(0123456789)
www.nature.com/scientificreports/
biological targets ought to be required to stimulate beneficial effects, if any25,26. Pirfenidone (PFD) is a pyridone-
derived drug with extensive antifibrotic, anti-inflammatory and antioxidant effects which modulates a number of
cytokines, i.e., Tgfb1, Il1, Il4, Il6, Il8, Il13, IFNG and Tnfa, among others. Furthermore, PFD reduces expression
of intracellular adhesion molecule 1 (Icam-1) and improves anti-inflammatory cytokines expression, such as
Il1027,28. In this work we used prolonged-release pirfenidone (PR-PFD) with an improved bioavailability com-
pared to standard pirfenidone and a half-life of ~ 8 h29. Thus, the aim of this study was to evaluate modifications
by PR-PFD on key hepatic miRNAs expression in a MAFLD/NASH model.
Methods
Drug. Prolonged-release pirfenidone (PR-PFD) was donated by Cell Pharma S.A. de C.V. (Cuernavaca, Mex-
ico). Chemical reagents used were reactive grade.
Animals. CUCS Research Committee at the University of Guadalajara approved this study (protocol num-
ber: CI-00518). The study was carried out in compliance with the ARRIVE guidelines. All mouse assays were in
compliance with the Animal Research Reporting in Vivo Experiments guidelines and accomplished according
to guidelines for the care and use of laboratory animals published by the US National Institutes of Health (NIH,
publication No. 85-23, revised 1996). Four-week-old male C57BL/6J mice (n = 15), weighing 18–22 g, were
obtained from Cinvestav Animal Facility (Mexico City). After a week of acclimatization, animals were divided
into groups; fed with conventional diet (CVD) with 18% lipids (2018S.15-Envigo) and plain water or fed with
high fat/high carbohydrate diet (HFD) with 60% fat nutriment (TD.06414-Envigo) and 42gr sugar/L in drinking
water (55% fructose and 45% sucrose) for 16 weeks. From ninth week to the end of the protocol, a subgroup of
five HFD mice were treated with prolonged release pirfenidone (PR-PFD) mixed with food (300 mg/kg/day).
Mice were maintained with 12-h light/dark cycles, ad libitum food and water; and constant temperature and
humidity. Animals were weighed weekly to control weight gain.
Sacrifice, clinical and biochemical parameters. Animals were sacrificed after 4 h of fasting using tile-
tamine/zolazepam (15 mg/kg/bw, Zoletil 50, Virbac) at the end of the 16th week of model induction. Liver and
whole blood were collected. The weight of epididymal fat and liver were determined. Blood was centrifuged to
obtain serum where lipid profile (triglycerides, total cholesterol and VLDL) and liver enzymes (AST, ALT) were
determined using VITROS DT60II dry chemistry analyzer (Johnson & Johnson).
Insulin tolerance test and determination of glucose levels and HOMA. Fasting blood glucose was
measured weekly during the study in mouse-tail vein using a clinical glucometer. The Insulin Tolerance Test
(ITT) was determined at eighth and sixteenth week. After 4 h-fasting, 0.025 U/mouse of short-acting human
recombinant insulin was intraperitoneally administrated and glucose levels were measured at 0, 30, 60 and
ethod30. Insulin
90 min after insulin injection. The area under the curve was calculated using the trapezoidal m
was measured in serum by multiplex detection immunoassay. Insulin resistance (IR) was calculated using the
homeostasis model assessment (HOMA)-IR index with the following formula [fasting serum glucose (mg/dL)
× fasting serum insulin (μIU/mL)/405]31.
Histological analysis of liver. Samples from the three main liver lobes were fixed in 4% paraformaldehyde
(0.1 M PBS, pH 7.4). Paraffin embedded tissues were cut into 5 µm sections. Hematoxylin–eosin, Masson’s tri-
chrome and Sirius red staining were performed. Masson’s and H&E were analyzed by two independent patholo-
gists to quantify inflammation, microvesicular steatosis and macrovesicular steatosis. Microvesicular steatosis
was defined by the presence of numerous small lipid vacuoles that do not displace the nucleus; while mac-
rovesicular steatosis was defined by a large lipid vacuole that displaces the nucleus. In addition, periportal and
centrilobulillar fibrosis were examined by scoring fibrotic bridges. To evaluate hepatic stellate cells activation,
immunoreactivity against alpha-smooth muscle actin (Cell Signaling Technology Inc., Beverly MA, USA) and
anti-GFAP (Glial Fibrillary Acidic Protein) (Biocare Medical, Pacheco, CA, USA) was performed using a 1:50
and 1:100 ab dilution respectively. To evaluate inflammatory infiltration in the liver immunoreactivity against
CD68 (Biocare Medical, Pacheco, CA, USA) was carried out using a 1:100 ab dilution.
Collagen, alpha-smooth muscle actin, GFAP and CD68 staining were evaluated using Image-Pro software in
30 photographs at 20 × microscopic field magnification (Media Cybernetics, Inc., Bethesda MD, USA).
RT‑qPCR. RNA isolation from liver was performed according to Chomczynski and Sacchi modified
ethod32. RNA quantity and quality were determined with NanoDrop equipment (Thermo Scientific, USA).
m
2 µg of total RNA were used for retrotranscription with 240 ng Oligo dT, 0.5 mM dNTPs mix, 10 mM DTT, 2
U of RNAse inhibitor and 200 U M-MLV (Invitrogen, Carlsbad, CA). qPCR reactions were performed on the
LightCycler 96 Instrument (Roche Molecular Systems, Pleasanton, CA, USA). All data were run in triplicate,
normalized using GAPDH as housekeeping gene and data analysis was performed using the 2−Δct method33.
Information about the probes used is shown in Supplemental Table 1.
miRNAs extraction and expression. Representative liver tissue was stored in RNAlater stabilization
solution (Ambion, Austin, TX, USA) at − 80 °C. miRNAs were extracted using the miRVana miRNA isola-
tion kit (Thermo Fisher Scientific, Waltham, MA, USA), according to manufacturer’s instructions. The integrity
and amount of the RNA fraction highly enriched in sRNA species ≤ 200 nt was determined using a Nanodrop
ND-2000 spectrophotometer (Thermo Fisher Scientific, Waltham, MA, USA). RNA purity was assessed from
Scientific Reports | (2021) 11:11709 | https://doi.org/10.1038/s41598-021-91187-2 2
Vol:.(1234567890)www.nature.com/scientificreports/
Group
Parameter CVD HFD PFD
Body weight (g)
Initial 17.38 ± 0.31 20.60 ± 0.67 19.30 ± 0.46
Final 27.98 ± 0.47 49.25a ± 2.36*** 40.33b ± 2.82*
Weight gain (g) 10.60 ± 0.51 29.54a ± 1.84*** 20.83b ± 2.97*
Epididimal fat pad weight (g) 0.67 ± 0.11 2.60 ± 0.33 1.79b ± 0.16*
Relative liver weight (g) 4.85 ± 0.34 4.7 ± 0.30 4.7 ± 0.30
Macrovesicular steatosis (%) – 19.2 ± 1.1 8.0b ± 1.8****
Microvesicular steatosis (%) – 71.2 ± 1.7 67.7 ± 2.3
Inflammatory nodules number/total area – 14.8 ± 2.1 6.60b ± 0.96***
Fibrotic bridges number/total area – 4.6 ± 1.9 0.6b ± 0.2*
Periportal fibrosis (%) – 72.5 ± 7.3 34.7b ± 3.8**
Pericental fibrosis (%) – 34.2 ± 3.3 20.5b ± 3.1*
a
AST (U/L) 116.7 ± 6.7 225.0 ± 8.6**** 140.0b ± 19.2****
a
ALT (U/L) 36.0 ± 2.3 91.0 ± 1.7**** 42.0b ± 2.8 ***
a
Total colesterol (mg/dL) 78.0 ± 6.3 153.0 ± 7.7* 120.0b ± 6.9*
a
Triglycerides (mg/dL) 128.0 ± 8.0 212.0 ± 12.7**** 127.0b ± 10.9****
VLDL (mg/dL) 30.0 ± 1.7 34.0 ± 2.0 25.0b ± 2.3*
a
Serum glucose (mg/dL) 110.7 ± 6.93 207.0 ± 14.21** 177.3 ± 5.48
AUC 9.65 ± 0.62 18.09 ± 1.69 11.73b ± 0.35*
Insulin (μIU/mL) 2490 ± 321.6 4326a ± 446.3* 4710a ± 719.4*
HOMA-IR indexc 1.0 ± 0.06 3.25a ± 0.36** 2.7 ± 0.54
Table 1. Clinical, histological and biochemical parameters in animal groups. Data are expressed as
mean ± SEM. CVD conventional diet, HFD high fat and high carbohydrate diet, PFD high fat diet + prolonged
release pirfenidone. VLDL very low-density lipoproteins. a Significance difference versus CVD group (*p < 0.05,
****p < 0.0001). b Significance difference versus HFD group (*p < 0.05, **p < 0.01, ***p < 0.001, ****p < 0.0001).
c
Fasting serum glucose (mg/dL) × fasting serum insulin (μIU/mL)/405.
the ratio of A260/A280; where 1.8–2.1 is expected34. Ten ng of sRNAs were used to performed retrotranscrip-
tion using the Advanced miRNA cDNA synthesis kit (Thermo Fisher Scientific, Waltham, MA, USA), following
the manufacturer’s instructions. Reverse transcription products were diluted to 50 µL, and 2.5 µL of the diluted
sample were used for qPCR reactions, with a total volume of 10 µL/Rx and 1X Thermo specific TaqMan probes
were used for qPCR for mmu-miR-34a-5p, mmu-miR-122-5p, mmu-miR-21a-5p and mmu-miR-103-3p, in a
LigthCycler 96 equipment (Roche Molecular Systems, Pleasanton, CA, USA). qPCR was performed as follows:
1 cycle at 95 °C for 20 s, 40–60 cycles 95 °C for 1 s followed by 60 °C for 20 s. Probes catalog number are shown
in Supplemental Table 1. Gene expression was normalized against mmu-miR-16-5p. Analysis was performed
using the 2 −ΔCT method35.
Microarrays. Total RNA was extracted from 20 mg of liver tissue using Trizol reagent (Invitrogen, Carls-
bad, CA, USA). Abundance and ratio between 28 and 18S rRNA were monitored both by agarose gel electro-
phoresis and NanoDrop ND-2000 spectrophotometer lectures (Thermo Fisher Scientific, Waltham, MA, USA).
Total RNA pooled from 5 animals per group was used throughout the experiment. Reverse transcription and
RNA sample labeling was made according to Microarray Facility UNAM protocol (http://microarrays.ifc.unam.
mx)36. Double-channel microarrays for Mus musculus genome were used and 22,000 genes were hybridized.
Image quantification was analyzed with genArise Microarray Analysis tool version 2.0 with adjusted p values
of < 0.05 and Z score values of > 1.5 and < 1.5 were considered to be significant. To provide functional interpre-
tation of enlisted genes, Database for Annotation, Visualization and Integrated Discovery (DAVID) v6.8 was
employed to visualized the cell pathways and processes involved in non-alcoholic steatohepatitis and modifica-
tions induced by PR-PFD37.
Statistical analysis. Values are expressed as mean ± SD, or as mean ± SEM. Groups were compared with
one-way ANOVA followed by Tukey test for parametric data and Kruskal–Wallis or U de Mann–Whitney for
non-parametric data. Values of p < 0.05 were considered statistically significant. Analysis was run with GraphPad
Prism version 8.
Results
Pirfenidone improves clinical and biochemical parameters in MAFLD/NASH animal model. All
animals gradually increased their weight during the experimental period. As seen in Table 1 after being fed a
high-fat diet for 16 weeks, HFD mice showed a 2.8-fold increase in body weight; while PFD group gain a 1.96-
fold increase in weigh compared to CVD group. CVD fed animals showed 27.98 g ± 0.47 of body weight. HFD
Scientific Reports | (2021) 11:11709 | https://doi.org/10.1038/s41598-021-91187-2 3
Vol.:(0123456789)www.nature.com/scientificreports/
mice treated with PR-PFD, diminished body weight 18.11% against HFD group (40.33 g ± 2.82 vs 49.25 g ± 2.36;
p < 0.05). These data indicated that PFD-treated animals even when fed with HFD, ended with lesser weight gain
and final body weight. No statistical differences in liver weight or liver/animal weight ratio were observed in
any experimental group (Table 1). Epididymal fat pad showed a significant decrease in PFD group compared to
animals in HFD group (1.79 g ± 0.16 vs 2.60 g ± 0.33; p < 0.05) (Table 1). Also, PFD group displayed a significant
decrease in AST and ALT serum levels (p < 0.0001) versus HFD group (Table 1). Triglycerides, cholesterol and
VLDL serum levels were higher in HFD group mice against PFD group (p < 0.0001) (Table 1). Animals treated
with pirfenidone had a slight decrease in serum glucose compared to HFD group. However, mice receiving PFD
treatment showed increased insulin sensitivity (AUC determinations), which was statistically significant at the
end of week 16, (p < 0.05). Insulin levels were increased in HFD animals compared to CVD group (4326 ± 446.3
vs 2490 ± 321.6; p < 0.05) (Table 1). Insulin showed no statistical differences between HFD and Pirfenidone
group. Insulin resistance was increased in HFD group, as assessed by HOMA-IR, yet an increase in this hormone
sensitivity was observed in mice treated with PFD.
Pirfenidone modifies MAFLD/NASH‑involved miRNAs expression while improving liver
inflammation and steatosis. Several miRNAs involved in MAFLD/NASH development where explored
using RT-qPCR in liver tissue. Also, in order to correlate changes in miRNAs expression, some of their target
genes were selected on miRbase and RT-qPCR was performed and/or were searched in the microarray database
of PFD vs HFD chip. Liver levels of miR-21a-5p, a key regulator of lipid metabolism and hepatic fibrogenesis,
were significantly higher (27.28 ± 5.27) in HFD mice compared to CVD mice (4.8 ± 0.85; p < 0.01). HFD mice
receiving PFD treatment exhibited a significant lower expression (12.52 ± 1.15; p < 0.05) (Fig. 1A). Srebf1 and
Tgfb1 mRNA hepatic expression were determined using PCR. Srebf1 mRNA levels were lower in mice admin-
istered with PFD (24.82 ± 2.62; p < 0.05) versus HFD group (52.94 ± 13.51), while Tgfb1 also revealed statistical
negative difference (17.00 ± 2.67 vs 36.09 ± 1.53; p < 0.0001) (Fig. 1A). Additionally, data on microarray analysis
showed upregulation in miR-21a-5p-target genes like Fabp1 (2.24) and Ppara (0.16); while Hbp1 and Myd88
showed downregulation (− 0.20 and − 0.15, respectively).
miR-122-5p levels are elevated under lipid buildup conditions, with quantities correlating with NASH scoring
and severity. As shown in Fig. 1B, our results revealed that miR-122-5p was upregulated in hepatic tissue of HFD
fed mice, and concurrent treatment with PFD decreased its liver expression (1559 ± 296.50 vs 730.80 ± 85.52;
p < 0.01). Target genes for miR-122-5p like Fasn, Mttp, Sirt1 and Ppard showed in microarray profile − 0.71,
− 0.38, 1.72 and 1.16 expression values compared to HFD animals. While qPCR expression of Fasn was found
to decrease (3.08 ± 0.15; p < 0.05) in PFD group against HFD group (4.70 ± 0.54). By qPCR, Mttp gene expression
showed non-statistical difference between groups.
miR-34a-5p is usually expressed in the liver, modulating oxidative stress and lipid metabolism. Fig-
ure 1C shows its increased expression in HFD group compared to PFD administered animals (5060 ± 2844 vs
1264 ± 149.0; p = 0.12). Noteworthy, PFD group levels are similar to those obtained in CVD group (1208 ± 260.4).
miR-103-3p has been shown to regulate insulin sensitivity and glucose homeostasis and is highly expressed
in the liver of MAFLD patients. Data in Fig. 1D for miR-103-3p indicated an upregulation in HFD animals
(150 ± 85.08) and a notable decrease in its expression after PFD treatment (42.14 ± 7.19; p = 0.25). In microarray
assays, its target gene Fgf5 was found downregulated (− 1.82); while Cpt1a was found upregulated (0.84) in PFD
group. Concurrent with this finding, Cpt1a is upregulated in animals treated with PFD (1.630 ± 0.3047, p < 0.05)
compared to the high fat diet group (0.792 ± 0.05).
MAFLD/NASH‑related parameters are decreased in liver tissue of animals after pirfenidone
administration. Histological analysis of liver of animals fed with HFD group showed significant tissue
damage with steatosis, imminent fibrosis, and inflammatory changes predominantly in the periportal area with
neutrophils and mononuclear cells. After prolonged-release pirfenidone treatment; as shown in H&E staining, a
significant reduction in inflammation foci was achieved (p < 0.001) (Table 1, Fig. 2). To correlate this data, mac-
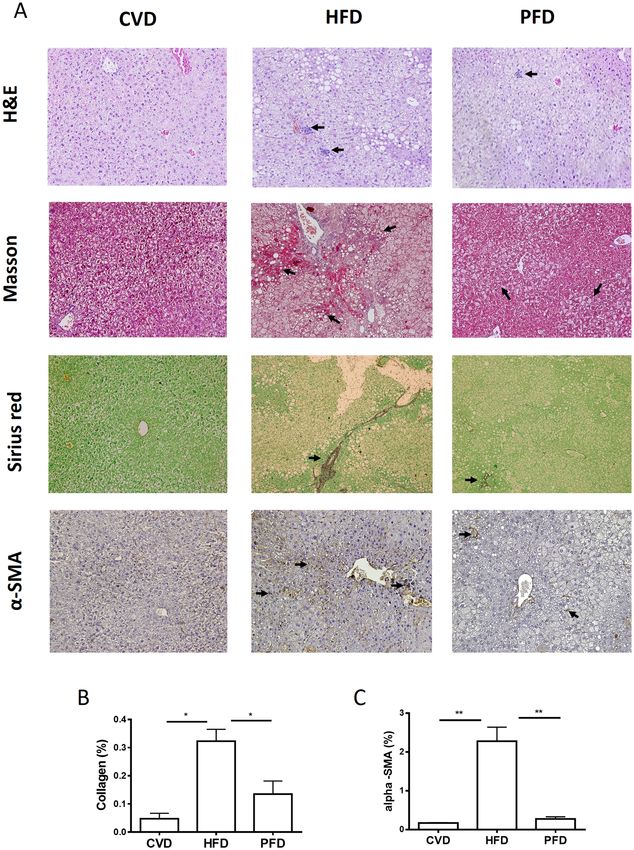
rophage recruitment in the liver was evaluated using CD68 marker (Fig. 3A). Quantification of CD68 positive
area was increased in HFD animals compared to PFD group. (6.29 ± 1.03vs. 1.57 ± 0.34, p < 0.0001). In particular,
macrovesicular steatosis reached substantial reduction in PFD group compared to HFD mice group (Table 1,
p < 0.0001); while microvesicular steatosis decrease in PFD group did not reached statistical significance (Fig. 2,
Table 1). An imminent fibrosis development was observed, especially in periportal and pericentral areas. Fibro-
sis assessment was higher in HFD group; while histological improvement was observed in PFD animals (p < 0.01
and p < 0.05 for periportal and pericentral zones, respectively) (Fig. 2 Sirius red and Masson staining, Table 1).
Likewise, a significant decrease in the number of fibrotic bridges was observed after administration of PFD ver-
sus HFD group (p < 0.05; Fig. 2 Masson staining, Table 1). To corroborate these facts, Sirius red collagen staining
revealed lesser reactivity in PDF treated animals compared to non-treated HFD group (p < 0.05, Fig. 2B).
Hepatic stellate cells activation in a MAFLD/NASH model was reversed in PFD treated ani‑
mals. In order to monitor changes in HSC activation, immunohistochemistry for alpha-SMA was real-
ized. As indicated in Fig. 2C, images were analyzed and percentage of area with immunoreactivity was calcu-
lated. HFD group showed a 2.28 ± 0.36% predominantly in the periportal area; whereas PFD group only had a
0.275 ± 0.055% (p < 0.01) indicating reduction of HSC activation in treated animals. This data also correlates with
lesser fibrosis and collagen staining in this group. To evaluate if pirfenidone decrease α-SMA positive cells is due
to reversal into the HSC quiescent phenotype, we performed GFAP immunohistochemistry (Fig. 3B). GFAP
positive area was increased in PFD animals compared to HFD group. (3.96 ± 0.45 vs. 1.13 ± 0.2, p < 0.0001).
Scientific Reports | (2021) 11:11709 | https://doi.org/10.1038/s41598-021-91187-2 4
Vol:.(1234567890)www.nature.com/scientificreports/
Figure 1. Hepatic expression of selected miRNAs involved in the pathogenesis of non-alcoholic steatohepatitis
and their target genes. (A) miR-21a 5p, Srebf1 and Tgfb1 gene expression by qPCR. Final panel presents
microarray analysis for several miR-21a 5p target genes. (B) Expression analysis of miR-122-5p and mRNA
levels of Fasn and Mttp; and microarray of miR-122-5p target genes. (C) miR-34a-5p gene expression and
microarray analysis of targeted genes. (D) Levels of miR-103-3p and Cpt1a by qPCR, and microarray analysis of
miR-103-3p targeted genes. CVD conventional diet, HFD high fat and high carbohydrate diet, PFD high fat and
high carbohydrate diet + prolonged-release pirfenidone. *p < 0.05, **p < 0.01, ****p < 0.0001.
Pro‑inflammatory cytokines and Collagen 1 were downregulated. As expected, Il1b (301.1 ± 44.0
vs. 1285a ± 86.19, p < 0.0001), Il6 (250.5 ± 181.9 vs 2692 ± 532.8, p < 0.01) and Tnfa (279.7 ± 5.774 vs. 683.0a ± 97.78,
p < 0.05) mRNA levels were notably increased in HFD animals compared to CVD group. On the other hand,
gene expression of these proinflammatory molecules were definitely diminished in PFD animals (565.3 ± 85.27,
1390 ± 477.3 and 220.6 ± 60.19 with p < 0.0001, p ≤ 0.05, p < 0.05; respectively) compared to HFD group. In addi-
tion, in Table 2 Col1a1 gene indicates that collagen expression is stimulated in a MAFLD/NASH model, but PFD
administration diminish its mRNA levels (331.1 ± 64.63 vs. 97.45b ± 31.24, p < 0.01), This data correlated with
previous reports of PFD effects in liver diseases28. Fold reduction is indicated in last column of Table 2 when
comparing PFD vs HFD groups.
Microarrays analysis. Double-channel chips were analyzed to compare 22,000 genes in mice genomes in
the three experimental groups. As shown in Fig. 4A the comparison between CVD animals and HFD mice
showed that 82 genes were overexpressed. Pathways associated were: lipid metabolic process (51 genes: Acox2,
Acbd3, Ch25h, Cpt1a), cholesterol metabolic process (9 genes: Ch25h, Vldlr, Apoa4, Mvk), negative regulation
of IL6 production (7 genes: Irak3), lipid homeostasis (7 genes: Apoa4, Acadm) and negative regulation of IFN-
gamma production (7 genes: Il10, Tnfsf4, Il-33). On the other hand, downregulated genes were those involved
in: innate immune response (40 genes: Il1f6, Traf6), MAPK signaling pathways (23 genes: Smad4, Timp2), metal-
lopeptidase activity (20 genes: Mmp17, Mmp19, Adam17, Adam2), collagen (16 genes: Col3a1, Col1a2, Col11a1),
insulin secretion (10 genes: Irs1, Igf1, Irs3) and Ampk signaling pathway (6 genes: Akt1s1) as indicated in Fig. 4B.
Scientific Reports | (2021) 11:11709 | https://doi.org/10.1038/s41598-021-91187-2 5
Vol.:(0123456789)www.nature.com/scientificreports/
Figure 2. Histological assessment. (A) Microscopic photographs of liver sections. In animals with NASH,
an intense inflammation is observed, constituted by neutrophils and mononuclear cells (arrows). Animals
treated with PFD showed reduction of inflammatory nodules in H&E-staining. Masson staining showed initial
fibrotic bridges and macrovesicular steatosis in animals fed with HFD. Fibrotic bridges and macrovesicular
steatosis were diminished in animals treated with PFD. IHC for alpha-SMA revealed a decreased positivity in
treated animals. Sirius red staining indicates a reduction in collagen content in animals receiving PR-PFD. (B)
Quantification of collagen staining using Sirius Red in liver tissue (*p < 0.05). Arrows indicate inflammation
nodules, lipid vacuoles, fibrosis and collagen bridges. (C)Percentage of alpha-SMA immunoreactivity in treated
animals and controls, (**p < 0.01). Photos at ×20 magnification. CVD conventional diet, HFD high fat and high
carbohydrate diet, PFD high fat and high carbohydrate diet + prolonged-release pirfenidone. Data are expressed
as the media of the group ± SEM.
Scientific Reports | (2021) 11:11709 | https://doi.org/10.1038/s41598-021-91187-2 6
Vol:.(1234567890)www.nature.com/scientificreports/
Figure 3. Immunoreactivity against CD68 and GFAP. (A) In animals fed with high fat-high carbohydrate
diet an increase in CD68 immunoreactivity was observed. Animals treated with PFD showed a significant
reduction in CD68 positive area (****p < 0.0001). (B) Quantification of GFAP positive area in liver tissue
showed an increased in PFD animals (****p < 0.0001). Photographs at ×20 magnification. HFD: high fat and
high carbohydrate diet and PFD: high fat and high carbohydrate diet + prolonged-release pirfenidone. Data are
expressed as the media of the group ± SEM.
Gene CVD HFD PFD Fold change versus HFD Regulation
Il1b 301.1 ± 44.0 1285a ± 86.19**** 565.3b ± 85.27**** − 2.27 Down
Il6 250.5 ± 181.9 2692a ± 532.8** 1390b ± 477.3* − 1.94 Down
Tnfa 279.7 ± 5.774 a
683.0 ± 97.78* 220.6b ± 60.19* − 3.09 Down
Col1a1 118.9 ± 38.03 331.1a ± 64.63* 97.45b ± 31.24** − 3.40 Down
Table 2. Gene expression of proinflammatory cytokines and Collagen Type I. Data are expressed in
mean ± SEM. CVD conventional diet, HFD high fat and high carbohydrate diet, PFD high fat diet + prolonged
release pirfenidone. *p < 0.05, ****p < 0.0001 compared to CVD group and *p < 0.05, **p < 0.01, ****p < 0.0001
as compared with HFD group. a Significance difference versus CVD group (*p < 0.05, **p < 0.01, ****p < 0.0001).
b
Significance difference versus HFD group (*p ≤ 0.05, **p < 0.01, ****p < 0.0001).
When comparing PFD group to HFD group 62 genes were upregulated, and main pathways involved are lipid
metabolism (33 genes: Acaca, Apoa1, Acox1). Response to oxidative stress (16 genes: Mmp14, Prdx1), lipid trans-
port (15 genes: Lbp, Hdl, Apoc4), insuling signaling pathway (14 genes: Cftr/Mrp, Abcc8), Baiap2l1, Atf2). Ppar
signaling pathway (5 genes: Crebbp), antioxidant activity (5 genes: Gpx3, Gsr, Fabp1), cholesterol transport activ-
ity (4 genes: Scp2, Apoa1, Apoa5) and fatty acid desaturase, type 1, C-terminal (3 genes: Scd1, Fads1, Scd2, Scd3)
(Fig. 4C). Genes which were downregulated are implicated in innate immune response (34 genes: Ifna2, Defb41,
Il2), inflammatory response (20 genes: Il12b, Ifng, Il2). Also, downregulation was seen in collagen metabolism
pathways (19 genes: Col13a1, Col14a1), insulin resistance (14 genes: Irs1, Tnfrsf1a), lipid biosynthesis (13 genes:
Ch25h, Srebf2, Hacd4), negative regulation of Nfkb transcription factor activity (10 genes: Cmklr1, Nfkbia, Pias4),
Finally, oxidative stress-induced gene expression via NRF2 (5 genes: Hmox2, Prkca) and hepatic stellate cell acti-
vation (4 genes: Dgat1) (Fig. 4D) were suppressed as well.
Discussion
Several studies have shown that specific miRNAs play a key role in the progression of metabolic associated fatty
liver disease (MAFLD), mostly using high-fat diet animal models. Therefore, modulation of miRNA expression
could be a potential therapeutic target for the treatment of this disease because miRNAs regulate lipid synthesis,
glucose and fatty acid catabolism, inflammation, proliferation, apoptosis and necrosis; all processes epigenetically
Scientific Reports | (2021) 11:11709 | https://doi.org/10.1038/s41598-021-91187-2 7
Vol.:(0123456789)www.nature.com/scientificreports/
Figure 4. Microarray analysis of cellular pathways with gene dysregulation. CVD compared to HFD: (A)
pathways with upregulated genes and (B) cellular tracks with decreased gene expression. PFD compared
to HFD: (C) shows cell processes with gene overexpression and (D) metabolic pathways with decreased
gene expression. CVD conventional diet, HFD high fat and high carbohydrate diet, PFD high fat and high
carbohydrate diet + prolonged-release pirfenidone.
deregulated in NASH15,23. A comprehensive literature search was carried out to select some of the most repre-
sentative miRNAs for each of the key processes found to be dysregulated in non-alcoholic steatohepatitis, which
are inflammation, fibrosis, steatosis and insulin resistance. Therefore, alterations on miRNAs target genes involved
in liver energy metabolism, inflammation, cell regeneration and fibrogenic signaling; driving the progression
from MAFLD to NASH were considered. Our study is the first to show that miR-21a-5p, miR-122-5p, miR-34a-5p
and miR-103-3p expression and numerous of their target genes like, Srebf1, Tgfb1, Fasn and Cpt1a are modified
by pirfenidone treatment in a MAFLD/NASH model as part of an improvement in molecular, histopathological
and biochemical parameters. miR-21a-5p has been extensively studied in liver diseases, as well as its main target
genes. miR-21a-5p hepatic expression is increased in animal models and in patients with MAFLD/NASH38–40.
Similarly, we found a significant increased expression of miR-21a-5p induced by high-fat diet in C57BL/6J mice.
miR-21a-5p is consider a profibrogenic miRNA by its effect on Smad7 and also participates in the accumulation
of liver lipids by interacting with various factors, such as sterol regulatory element binding transcription factor
1 (Srebf1), 3-hydroxy-3-methylglutaryl-coenzyme A reductase (Hmgcr) and protein binding to fatty acids 7
(Fabp7)41–43. We found that miR-21a-5p expression was decreased in PFD group, as well as, Srebf1 and Tgfb1.
miR-21a-5p hepatic diminution has been associated with improved glucose tolerance and insulin sensitivity, in
addition to prevent hepatic steatosis and fatty acid a bsorption44. Tgfb signaling is crucial for fibrogenesis as has
been convincingly demonstrated in numerous studies45,46. In our study, Tgfb1 decrease in PFD group associates
with decreased expression of Col1a1. These results correlated with histological analysis displaying a reduction
in the number of fibrotic bridges, periportal and pericentral fibrosis and percentage of collagen stained area in
PFD group. We also found a faded alpha-SMA positive area, indicating a contracted activation of HSCs due to
PFD treatment; which correlates with an increase in GFAP (Glial fibrillary acidic protein) quiescent marker in
HSCs in these group. As stated by Zisser et al. and others, quiescent HSCs are characterized by the cytoplasmic
storage of vitamin A and markers include, PPARg, GFAP, and B AMBI47–49. These observed effects are caused by
PFD; a drug widely known for reducing fibrosis and collagen deposition in various organs and diseases, includ-
ing MAFLD models28,50,51. Nuclear receptor peroxisome proliferation-activated receptor alpha (Ppara) is target
gene of miR-21a-5p. A study has shown that miR-21a-5p is increased in NASH patients, resulting in diminished
expression of Ppara52. In this way, miR-21a-5p contributes to cell injury, inflammation, and fibrosis, through
its inhibition of the PPARAsignaling pathway23. Also, Sandoval-Rodriguez et al. had previously reported that
protein expression of Ppara is diminished in a mouse MAFLD/NASH model and restored to similar levels than
CVD in animals treated with P FD51.
miR-122-5p is one of the most abundant miRNAs in the liver, it constitutes 70% of all hepatic miRNAs.
It has been reported that miR-122-5p is overexpressed in liver tissue of C57BL/6 mice with MAFLD, and in
HepG2 and Huh-7 cells exposed to FFA. These in vitro models present an excess of lipid accumulation and
triglycerides secretion, decreased expression of Sirt1 and genes related to l ipogenesis53. Similarly, in the present
study, we found that miR-122-5p expression was remarkably elevated in HFD mice as determined by qRT-PCR.
Conversely, former studies have shown that miR-122-5p is decreased in MAFLD models induced by HFD. Also,
reduced levels of miR-122-5p were identified in liver biopsies of patients with NASH, at the most severe stage
of the MAFLD spectrum, compared to control g roup39. A possible explanation for these divergent results is the
diverse animals’ strains and variety of conditions of MAFLD induction, as well as the different co-morbidities
and severity in patients with MAFLD.
miR-122-5p has been reported to be expressed primarily in hepatocytes and to target multiple enzymes
in lipid metabolism, including fatty acid synthase (Fasn), 3-hydroxy-3-methyl-glutarylcoenzyme A reductase
(Hmgcr), and Srebf1 and Srebf254. We found that miR-122-5p reduced expression in PFD group correlates with
Fasn mRNA reduced expression in microarray. Fasn catalyzes the last step in fatty acid biosynthesis and therefore
it is an important determinant of maximal liver ability to generate fatty acids by novo lipogenesis14.
Scientific Reports | (2021) 11:11709 | https://doi.org/10.1038/s41598-021-91187-2 8
Vol:.(1234567890)www.nature.com/scientificreports/
Recently, miR-34a-5p has been shown to be specifically modulated in liver diseases. Circulating miR-34a-5p
levels are high in patients with MAFLD and in animal models of s teatosis55. Similarly, our data showed a higher
hepatic miR-34a-5p expression, while PFD administration attenuates its induction. Also, a decrease in the expres-
sion of miR-34a-5p and an increase in its target genes Sirt1, Ppara, and Insig2 has been reported when green
tea was used to protect against MAFLD development in a rodent m odel56. Hnf4a is a target gene of miR-34a-5p
known to modulate the regulatory elements of promoters and enhancers of genes involved in the metabolism of
cholesterol, fatty acids and glucose. In microarray analysis, our data showed increased Hnf4a expression by PFD
treatment. Specifically in the liver, Hnf4a activates hepatic gluconeogenesis and regulates expression of several
genes, including a polipoproteins57.
miR-103-3p has been shown to regulate insulin sensitivity and glucose homeostasis, previous studies have
found that miR-103-3p expression was increased in the liver of patients with MAFLD; as well as, in vitro and
in vivo experimental models of MAFLD/NASH58–60. In our study, miR-103-3p expression was also detected
increased due to high-fat diet induction of NASH. Silencing miR-103-3p improved insulin resistance. In contrast,
the gain of function of miR-103-3p in the liver was sufficient to induce insulin r esistance21. Other studies con-
firmed that high expression of miR-103-3p led to insulin resistance by decreasing the expression of caveolin-1,
which is a direct target of miR-103-3p and a critical regulator of insulin receptor21,22. These data correlate with the
effects seen after PFD treatment, since ITT was improved and miR-103 expression was reduced. In accordance
with the miRWalk database 2.0, Srebf1 is a predicted miR-103-3p target gene. Srebf1 is one of the main regulators
of de novo lipogenesis in MAFLD, and Srebf1 overexpression contributed predominantly to lipids accumulation61.
In resveratrol-treated obese rats, a significant decreased expression of miR-103-3p was reported, as well as, a
decline in Srebf1 protein e xpression60. According to these facts, in PFD animals we observed the same pattern
regarding these molecules. In agreement to the miRWalk database 2.0, carnitine palmitoyltransferase 1a (Cpt1a)
is a predicted target gene for miRNA-103-3p. Cpt1a is a key enzyme involved in mitochondrial β-oxidation,
catalyzes the transfer of acyl groups from fatty acyl-CoAs to carnitine in the mitochondrial membrane for the
translocation into the intermembrane s pace62,63. Cpt1a expression is decreased in our MAFLD model induced
by high-fat diet, while increased in PFD group.
Key cellular processes are found to be altered in the development of non-alcoholic steatohepatitis (NASH).
Using microarray analyses, we examined genes involved in lipid metabolism, inflammation, oxidative stress,
fibrosis, insulin resistance, and how these pathways or cellular metabolism were modified in NASH and after
administration of prolonged-release pirfenidone.
When comparing PFD group to HFD group, we found a decreased expression in genes involved in hepatic
stellate cells activation, collagen metabolic processes and transforming growth factor β receptor binding, events
involved in fibrosis progression, which is coherent with the well-known antifibrotic effect of pirfenidone in
diverse fibrotic diseases27,28,64,65.
Particularly in NASH related to MAFLD, recently Komiya et al. and Sandoval-Rodriguez et al. found that
pirfenidone improves liver fibrosis in mice m odels50,51. Gutierrez-Cuevas et al. also found in a model of MAFLD
induced by High fat diet that PFD showed beneficial effects in cardiac fi brosis66.
Insulin resistance is a characteristic feature of MAFLD that contributes to its pathogenesis. Under conditions
of insulin resistance, abnormally high levels of insulin are required to metabolize glucose and inhibit hepatic
glucose production effectively due to reduced insulin sensitivity in peripheral tissues. Insulin resistance stimulates
the pancreas to increase insulin secretion from the portal vein, leading to higher levels of insulin in the liver than
in the periphery. High concentrations of hepatic glucose and plasmatic insulin are recognized as biomarkers of
hepatic insulin resistance. Elevated fasting glucose levels are due to hepatic insulin resistance, while elevated
concentrations of free fatty acids o ccur67. Microarrays showed a decrease expression in genes that participate
in insulin resistance and in insulin secretion in the PFD group compared to HF group, which indicates that
hyperinsulinemia might be caused by a high fat diet.
Activation of innate response of the immune system during NASH occurs mainly due to excessive accumula-
tion of lipids that leads to hepatocytes damage, activating an inflammatory response that worsens the progress
of liver disease. Inflammation is characterized by Tnfa, Il1b, as well as reactive oxygen species p roduction68.
Our data indicates a decrease expression in genes involved in the innate response of the immune system in PFD
mice versus HFD group. Extensive experimental and clinical data support a central role for macrophages in
the development and progression of NASH. Liver-resident Kupffer cells initiate inflammation and help recruit
blood-derived monocytes69. Macrophage polarization to M1 phenotype (proinflammatory) contribute to NASH
progression70. Here, we found a significant reduction in immunoreactivity of CD68 marker in PFD treated ani-
mals. These data suggest that pirfenidone is able to reduce inflammatory response activation, correlating with
the already reported anti-inflammatory properties of P FD28,71.
Nfkb is a transcription factor involved in innate and adaptive immune responses, as well as in a number of
pathological processes, such as inflammation. Under normal conditions, Nfkb is sequestered in the cytoplasm
and binds to IKB proteins, inhibiting the nuclear localization of NFKB. NFKB activation is normally moderate,
whereas, under conditions of insulin resistance, its expression in the liver is greatly increased. Nfkb translocation
to the nucleus leads to upregulation of target genes encoding inflammatory mediators, such as Tnfa and Il672. We
found a decrease expression of genes related to the inflammatory response in PFD mice compared to the HFP
group, which could be linked to a decrease in the negative regulation of Nfkb activity.
We also found a decreased expression in genes that participate in the metabolic process of lipids and fatty
acids, mainly of genes that participate in lipogenesis in PFD animals compared to HFD group. On the other hand,
microarrays showed an increase in the expression of genes related with activity of the cholesterol transporter,
the transport of lipids and type 1 fatty acid desaturase. Previous studies have reported changes in the expression
of liver desaturases during the development of MAFLD/NASH, it was found that a significant decrease in the
activity of Fads1 in the progression to NASH63. Regarding cholesterol transport genes, hepatic accumulation of
Scientific Reports | (2021) 11:11709 | https://doi.org/10.1038/s41598-021-91187-2 9
Vol.:(0123456789)www.nature.com/scientificreports/
free cholesterol has been shown to be an outstanding feature in MAFLD, which correlates with the histological
severity of the disease. Additionally, epidemiological studies have identified dietary cholesterol intake as a factor
related to the risk and severity of MAFLD. Transport of lipids is important, since an excessive flow of free fatty
acids into the liver can cause NASH. Diet is an important component in the development of MAFLD, since 15%
of triglycerides in the liver have the diet as their source73. Fatty acids in the diet are involved in liver lipogenesis
and could play a dual role in the pathogenesis of liver steatosis, since they are involved in its development and
in its prevention or reversal depending of the amount of omega-fatty acids.
Lipotoxicity, arising from hepatic fat excess, leads to mitochondrial dysfunction associated with an elevated
ability to oxidize fatty acids, resulting in the production of reactive oxygen species (ROS). In transcriptome
analysis, a decreased expression in genes involved in the response to oxidative stress was present in PFD group
compared to HFD group. MAFLD causes overexpression of antioxidant agents, but the unbalanced produc-
tion of ROS promotes oxidative stress. Pirfenidone has been reported to have antioxidant c apacity74,75 and
this effect correlates with expected benefits in this MALFD model. Oxidative stress can induce hepatocellular
damage by inhibiting enzymes involved in mitochondrial respiratory chain and inactivation of glyceraldehyde-
3-phosphate dehydrogenase76. Furthermore, ROS cause lipid peroxidation and cytokine production, which con-
tributes to hepatocellular injury and fibrosis, promoting the progression from simple steatosis to nonalcoholic
steatohepatitis68. Oxidative stress in MAFLD induces hepatic stellate cell activation, the most important producer
of extracellular m atrix77,78. In summary, increased expression of miR-21a-5p, miR-34a-5p, miR-122-5p and
miR-103-3p in this MAFLD/NASH model was reversed with prolonged-release pirfenidone. MAFLD/NASH
group compared to conventional diet control revealed modifications in gene metabolic pathways implicated in
lipid metabolic process, inflammatory response, antioxidant activity and insulin resistance; PR-PFD seems to
reverse these modifications.
Received: 27 February 2021; Accepted: 24 May 2021
References
1. Younossi, Z. M. et al. Global epidemiology of nonalcoholic fatty liver disease—meta-analytic assessment of prevalence, incidence,
and outcomes. Hepatology 64, 73–84 (2016).
2. Tilg, H. & Effenberger, M. From NAFLD to MAFLD: When pathophysiology succeeds. Nat. Rev. Gastroenterol. Hepatol. 17, 387–388
(2020).
3. Eslam, M., Sanyal, A. J. & George, J. MAFLD: A consensus-driven proposed nomenclature for metabolic associated fatty liver
disease. Gastroenterology 158, 1999-2014.e1991 (2020).
4. Fabbrini, E., Sullivan, S. & Klein, S. Obesity and nonalcoholic fatty liver disease: Biochemical, metabolic, and clinical implications.
Hepatology 51, 679–689 (2010).
5. Perumpail, B. J. et al. Clinical epidemiology and disease burden of nonalcoholic fatty liver disease. World J. Gastroenterol. 23,
8263–8276 (2017).
6. Younossi, Z. et al. Global burden of NAFLD and NASH: Trends, predictions, risk factors and prevention. Nat. Rev. Gastroenterol.
Hepatol. 15, 11–20 (2018).
7. Estes, C. & Razavi, H. Modeling the epidemic of nonalcoholic fatty liver disease demonstrates an exponential increase in burden
of disease. Hepatology 67, 123–133 (2018).
8. Lizardi-Cervera, J., Laparra, D. I., Chavez-Tapia, N. C., Ostos, M. E. & Esquivel, M. U. Prevalence of NAFLD and metabolic syn-
drome in asymtomatics subjects. Rev. Gastroenterol. Mex. 71, 453–459 (2006).
9. Saab, S., Manne, V., Nieto, J., Schwimmer, J. B. & Chalasani, N. P. Nonalcoholic fatty liver disease in latinos. Clin. Gastroenterol.
Hepatol. 14, 5–12 (2016) (quiz e19–10).
10. Brunt, E. M. et al. Nonalcoholic fatty liver disease. Nat. Rev. Dis. Primers 1, 15080 (2015).
11. Szabo, G. & Bala, S. MicroRNAs in liver disease. Nat. Rev. Gastroenterol. Hepatol. 10, 542–552 (2013).
12. Bartel, D. P. MicroRNAs: Genomics, biogenesis, mechanism, and function. Cell 116, 281–297 (2004).
13. He, Z., Hu, C. & Jia, W. miRNAs in non-alcoholic fatty liver disease. Front Med. 10, 389–396 (2016).
14. Szabo, G. & Csak, T. Role of microRNAs in NAFLD/NASH. Dig. Dis. Sci. 61, 1314–1324 (2016).
15. Baffy, G. MicroRNAs in nonalcoholic fatty liver disease. J. Clin. Med. 4, 1977–1988 (2015).
16. Pirola, C. J. et al. Circulating microRNA signature in non-alcoholic fatty liver disease: From serum non-coding RNAs to liver
histology and disease pathogenesis. Gut 64, 800–812 (2015).
17. Moore, K. J., Rayner, K. J., Suárez, Y. & Fernández-Hernando, C. The role of microRNAs in cholesterol efflux and hepatic lipid
metabolism. Annu. Rev. Nutr. 31, 49–63 (2011).
18. Bandiera, S., Pfeffer, S., Baumert, T. F. & Zeisel, M. B. miR-122—a key factor and therapeutic target in liver disease. J. Hepatol. 62,
448–457 (2015).
19. Ding, J. et al. Effect of miR-34a in regulating steatosis by targeting PPARalpha expression in nonalcoholic fatty liver disease. Sci.
Rep. 5, 13729 (2015).
20. Xu, Y. et al. A metabolic stress-inducible miR-34a-HNF4alpha pathway regulates lipid and lipoprotein metabolism. Nat. Commun.
6, 7466 (2015).
21. Xu, Q., Li, Y., Shang, Y.-F., Wang, H.-L. & Yao, M.-X. miRNA-103: Molecular link between insulin resistance and nonalcoholic
fatty liver disease. World J. Gastroenterol. 21, 511–516 (2015).
22. Trajkovski, M. et al. MicroRNAs 103 and 107 regulate insulin sensitivity. Nature 474, 649–653 (2011).
23. Loyer, X. et al. Liver microRNA-21 is overexpressed in non-alcoholic steatohepatitis and contributes to the disease in experimental
models by inhibiting PPARalpha expression. Gut 65, 1882–1894 (2016).
24. Krichevsky, A. M. & Gabriely, G. miR-21: A small multi-faceted RNA. J. Cell Mol. Med. 13, 39–53 (2009).
25. Caligiuri, A., Gentilini, A. & Marra, F. Molecular pathogenesis of NASH. Int. J. Mol. Sci. 17, 20 (2016).
26. Ocker, M. Challenges and opportunities in drug development for nonalcoholic steatohepatitis. Eur. J. Pharmacol. 870, 172913
(2020).
27. Di Sario, A. et al. The anti-fibrotic effect of pirfenidone in rat liver fibrosis is mediated by downregulation of procollagen alpha1(I),
TIMP-1 and MMP-2. Dig. Liver Dis. 36, 744–751 (2004).
28. Lopez-de la Mora, D. A. et al. Role and new insights of pirfenidone in fibrotic diseases. Int. J. Med. Sci. 12, 840–847 (2015).
Scientific Reports | (2021) 11:11709 | https://doi.org/10.1038/s41598-021-91187-2 10
Vol:.(1234567890)www.nature.com/scientificreports/
29. Poo, J. L. B. R. et al. Pharmacokinetics of the antifibrotic drug pirfenidone in Child-Pugh A and B cirrhotic patients compared to
healthy age-matched controls. J. Hepatol. 64, S213–S424 (2016).
30. Allison, D. B., Paultre, F., Maggio, C., Mezzitis, N. & Pi-Sunyer, F. X. The use of areas under curves in diabetes research. Diabetes
Care 18, 245–250 (1995).
31. Matthews, D. R. et al. Homeostasis model assessment: Insulin resistance and beta-cell function from fasting plasma glucose and
insulin concentrations in man. Diabetologia 28, 412–419 (1985).
32. Chomczynski, P. & Sacchi, N. Single-step method of RNA isolation by acid guanidinium thiocyanate-phenol-chloroform extrac-
tion. Anal. Biochem. 162, 156–159 (1987).
33. Schmittgen, T. D. & Livak, K. J. Analyzing real-time PCR data by the comparative CT method. Nat. Protoc. 3, 1101–1108 (2008).
34. Brown, R. A. M. et al. Total RNA extraction from tissues for microRNA and target gene expression analysis: Not all kits are created
equal. BMC Biotechnol. 18, 16 (2018).
35. Schmittgen, T. D. & Livak, K. J. Analyzing real-time PCR data by the comparative C(T) method. Nat. Protoc. 3, 1101–1108 (2008).
36. Unidad de Microarreglos de DNA-Instituto de Fisiología Celular, U. Microarreglos de ratón, http://microarrays.ifc.unam.mx/
(Updated).
37. da Huang, W., Sherman, B. T. & Lempicki, R. A. Systematic and integrative analysis of large gene lists using DAVID bioinformatics
resources. Nat. Protoc. 4, 44–57 (2009).
38. Loyer, X. et al. Liver microRNA-21 is overexpressed in non-alcoholic steatohepatitis and contributes to the disease in experimental
models by inhibiting PPARα expression. Gut 65, 1882–1894 (2016).
39. Cheung, O. et al. Nonalcoholic steatohepatitis is associated with altered hepatic MicroRNA expression. Hepatology 48, 1810–1820
(2008).
40. Liu, J. et al. A circulating microRNA signature as noninvasive diagnostic and prognostic biomarkers for nonalcoholic steatohepa-
titis. BMC Genom. 19, 188 (2018).
41. Wu, H., Ng, R., Chen, X., Steer, C. J. & Song, G. MicroRNA-21 is a potential link between non-alcoholic fatty liver disease and
hepatocellular carcinoma via modulation of the HBP1-p53-Srebp1c pathway. Gut 65, 1850–1860 (2016).
42. Sun, C. et al. miR-21 regulates triglyceride and cholesterol metabolism in non-alcoholic fatty liver disease by targeting HMGCR.
Int. J. Mol. Med. 35, 847–853 (2015).
43. Ahn, J., Lee, H., Jung, C. H. & Ha, T. Lycopene inhibits hepatic steatosis via microRNA-21-induced downregulation of fatty acid-
binding protein 7 in mice fed a high-fat diet. Mol. Nutr. Food Res. 56, 1665–1674 (2012).
44. Calo, N. et al. Stress-activated miR-21/miR-21* in hepatocytes promotes lipid and glucose metabolic disorders associated with
high-fat diet consumption. Gut 65, 1871–1881 (2016).
45. Yang, L. et al. Transforming growth factor beta signaling in hepatocytes participates in steatohepatitis through regulation of cell
death and lipid metabolism in mice. Hepatology 59, 483–495 (2014).
46. Zhang, T., Yang, Z., Kusumanchi, P., Han, S. & Liangpunsakul, S. Critical role of microRNA-21 in the pathogenesis of liver diseases.
Front Med. 7, 20 (2020).
47. Shang, L., Hosseini, M., Liu, X., Kisseleva, T. & Brenner, D. A. Human hepatic stellate cell isolation and characterization. J. Gas-
troenterol. 53, 6–17 (2018).
48. Friedman, S. L. Hepatic stellate cells: Protean, multifunctional, and enigmatic cells of the liver. Physiol. Rev. 88, 125–172 (2008).
49. Zisser, A., Ipsen, D. H. & Tveden-Nyborg, P. Hepatic stellate cell activation and inactivation in NASH-fibrosis-roles as putative
treatment targets?. Biomedicines 9, 365 (2021).
50. Komiya, C. et al. Antifibrotic effect of pirfenidone in a mouse model of human nonalcoholic steatohepatitis. Sci. Rep. 7, 44754
(2017).
51. Sandoval-Rodriguez, A. et al. pirfenidone is an agonistic ligand for PPARα and improves NASH by activation of SIRT1/LKB1/
pAMPK. Hepatol. Commun. 4, 434–449 (2020).
52. Rodrigues, P. M., Rodrigues, C. M. P. & Castro, R. E. Modulation of liver steatosis by miR-21/PPARα. Cell Death Discov. 4, 9 (2018).
53. Long, J. K., Dai, W., Zheng, Y. W. & Zhao, S. P. miR-122 promotes hepatic lipogenesis via inhibiting the LKB1/AMPK pathway by
targeting Sirt1 in non-alcoholic fatty liver disease. Mol. Med. 25, 26 (2019).
54. Dorn, C. et al. Expression of fatty acid synthase in nonalcoholic fatty liver disease. Int. J. Clin. Exp. Pathol. 3, 505–514 (2010).
55. Xu, Y. et al. A metabolic stress-inducible miR-34a-HNF4α pathway regulates lipid and lipoprotein metabolism. Nat. Commun. 6,
7466 (2015).
56. Torres, L. F., Cogliati, B. & Otton, R. Green tea prevents NAFLD by modulation of miR-34a and miR-194 expression in a high-fat
diet mouse model. Oxid. Med. Cell. Longev. 2019, 4168380 (2019).
57. Baciu, C. et al. Systematic integrative analysis of gene expression identifies HNF4A as the central gene in pathogenesis of non-
alcoholic steatohepatitis. PLoS One 12, e0189223 (2017).
58. Soronen, J. et al. Novel hepatic microRNAs upregulated in human nonalcoholic fatty liver disease. Physiol. Rep. 4, e12661 (2016).
59. Jin, X. et al. Transition from hepatic steatosis to steatohepatitis: Unique microRNA patterns and potential downstream functions
and pathways. J. Gastroenterol. Hepatol. 27, 331–340 (2012).
60. Gracia, A. et al. Are miRNA-103, miRNA-107 and miRNA-122 involved in the prevention of liver steatosis induced by resveratrol?.
Nutrients 9, 360 (2017).
61. Higuchi, N. et al. Liver X receptor in cooperation with SREBP-1c is a major lipid synthesis regulator in nonalcoholic fatty liver
disease. Hepatol. Res. 38, 1122–1129 (2008).
62. Koo, S.-H. Nonalcoholic fatty liver disease: Molecular mechanisms for the hepatic steatosis. Clin. Mol. Hepatol. 19, 210–215 (2013).
63. Ipsen, D. H., Lykkesfeldt, J. & Tveden-Nyborg, P. Molecular mechanisms of hepatic lipid accumulation in non-alcoholic fatty liver
disease. Cell Mol. Life Sci. 75, 3313–3327 (2018).
64. Garcia, L. et al. Pirfenidone effectively reverses experimental liver fibrosis. J. Hepatol. 37, 797–805 (2002).
65. Zhao, X. Y., Zeng, X., Li, X. M., Wang, T. L. & Wang, B. E. Pirfenidone inhibits carbon tetrachloride- and albumin complex-induced
liver fibrosis in rodents by preventing activation of hepatic stellate cells. Clin. Exp. Pharmacol. Physiol. 36, 963–968 (2009).
66. Gutiérrez-Cuevas, J. et al. Prolonged-release pirfenidone prevents obesity-induced cardiac steatosis and fibrosis in a mouse NASH
model. Cardiovasc. Drugs Ther. 20, 20 (2020).
67. Chen, Z., Yu, R., Xiong, Y., Du, F. & Zhu, S. A vicious circle between insulin resistance and inflammation in nonalcoholic fatty
liver disease. Lipids Health Dis. 16, 203–203 (2017).
68. Masarone, M., Rosato, V., Dallio, M. & Gravina, A. G. Role of oxidative stress in pathophysiology of nonalcoholic fatty liver disease.
Oxid. Med. Cell Longev. 2018, 9547613 (2018).
69. Kazankov, K. & Jørgensen, S. M. D. The role of macrophages in nonalcoholic fatty liver disease and nonalcoholic steatohepatitis.
Nat. Rev. 16, 145–159 (2019).
70. Grunhut, J. et al. Macrophages in nonalcoholic steatohepatitis: Friend or foe?. Eur. Med. J. Hepatol. 6, 100–109 (2018).
71. Chen, G., Ni, Y. & Nagata, N. Pirfenidone prevents and reverses hepatic insulin resistance and steatohepatitis by polarizing M2
macrophages. Lab. Invest. 99, 1335–1348 (2019).
72. Kosmalski, M., Mokros, Ł, Kuna, P., Witusik, A. & Pietras, T. Changes in the immune system—the key to diagnostics and therapy
of patients with non-alcoholic fatty liver disease. Cent. Eur. J. Immunol. 43, 231–239 (2018).
73. Nakamuta, M. et al. Evaluation of fatty acid metabolism-related gene expression in nonalcoholic fatty liver disease. Int. J. Mol.
Med. 16, 631–635 (2005).
Scientific Reports | (2021) 11:11709 | https://doi.org/10.1038/s41598-021-91187-2 11
Vol.:(0123456789)www.nature.com/scientificreports/
74. Salazar-Montes, A., Ruiz-Corro, L., Lopez-Reyes, A., Castrejon-Gomez, E. & Armendariz-Borunda, J. Potent antioxidant role of
pirfenidone in experimental cirrhosis. Eur. J. Pharmacol. 595, 69–77 (2008).
75. Liu, Y., Lu, F., Kang, L., Wang, Z. & Wang, Y. Pirfenidone attenuates bleomycin-induced pulmonary fibrosis in mice by regulating
Nrf2/Bach1 equilibrium. BMC Pulm. Med. 17, 63 (2017).
76. Rolo, A. P., Teodoro, J. S. & Palmeira, C. M. Role of oxidative stress in the pathogenesis of nonalcoholic steatohepatitis. Free Radic.
Biol. Med. 52, 59–69 (2012).
77. Palladini, G. et al. Fatty acid desaturase involvement in non-alcoholic fatty liver disease rat models: Oxidative stress versus metal-
loproteinases. Nutrients 11, 799 (2019).
78. Arroyave-Ospina, J. C., Wu, Z. & Geng, Y. Role of oxidative stress in the pathogenesis of non-alcoholic fatty liver disease: Implica-
tions for prevention and therapy. Antioxidants 10, 174 (2021).
Acknowledgements
Rebeca Escutia-Gutiérrez would like to thank CONACYT for the scholarship granted to obtain her PhD.
Author contributions
R.E.-G.: sample processing, therapy administration, animal model, miRNA expression analysis, data analysis and
article writing. J.S.R.-S.: animal models and laboratory studies. C.A.M.-M.: gene expression analysis and data
analysis. J.G.-B.: sample processing, therapy administration and statistics. A.S.-G.: critical intellectual input. A.S.-
R.: article writing, data analysis, methodological analysis and supervision. J.A.-B.: article writing, data analysis
and supervision. All authors have reviewed and approved the final version of the manuscript.
Competing interests
Dr. Juan Armendariz-Borunda is a consultant for Cell Pharma S.A. de C.V. The other authors declare no conflict
of interest.
Additional information
Supplementary Information The online version contains supplementary material available at https://doi.org/
10.1038/s41598-021-91187-2.
Correspondence and requests for materials should be addressed to A.S.-R. or J.A.-B.
Reprints and permissions information is available at www.nature.com/reprints.
Publisher’s note Springer Nature remains neutral with regard to jurisdictional claims in published maps and
institutional affiliations.
Open Access This article is licensed under a Creative Commons Attribution 4.0 International
License, which permits use, sharing, adaptation, distribution and reproduction in any medium or
format, as long as you give appropriate credit to the original author(s) and the source, provide a link to the
Creative Commons licence, and indicate if changes were made. The images or other third party material in this
article are included in the article’s Creative Commons licence, unless indicated otherwise in a credit line to the
material. If material is not included in the article’s Creative Commons licence and your intended use is not
permitted by statutory regulation or exceeds the permitted use, you will need to obtain permission directly from
the copyright holder. To view a copy of this licence, visit http://creativecommons.org/licenses/by/4.0/.
© The Author(s) 2021
Scientific Reports | (2021) 11:11709 | https://doi.org/10.1038/s41598-021-91187-2 12
Vol:.(1234567890)You can also read