The Voronoi theory of the normal liver lobular architecture and its applicability in hepatic zonation
←
→
Page content transcription
If your browser does not render page correctly, please read the page content below
www.nature.com/scientificreports
OPEN The Voronoi theory of the normal
liver lobular architecture and its
applicability in hepatic zonation
C. Lau1, B. Kalantari1, K. P. Batts2, L. D. Ferrell3, S. L. Nyberg4, R. P. Graham5 &
Roger K. Moreira5*
The precise characterization of the lobular architecture of the liver has been subject of investigation
since the earliest historical publications, but an accurate model to describe the hepatic lobular
microanatomy is yet to be proposed. Our aim was to evaluate whether Voronoi diagrams can be used
to describe the classic liver lobular architecture. We examined the histology of normal porcine and
human livers and analyzed the geometric relationships of various microanatomic structures utilizing
digital tools. The Voronoi diagram model described the organization of the hepatic classic lobules
with overall accuracy nearly 90% based on known histologic landmarks. We have also designed a
Voronoi-based algorithm of hepatic zonation, which also showed an overall zonal accuracy of nearly
90%. Therefore, we have presented evidence that Voronoi diagrams represent the basis of the two-
dimensional organization of the normal liver and that this concept may have wide applicability in liver
pathology and research.
The microanatomy of the liver was first described by J.J. Wepfer examining pig livers in 1665 and shortly there-
after by Malpighi in his celebrated work “De Viscerum Structura Exercitatio Anatomica” (cited by K iernan1), in
which several species were studied. Different models of the hepatic microarchitecture and their corresponding
anatomic and functional units were subsequently proposed (Fig. 1). In 1833, Kiernan1 described and illustrated
the microscopic anatomy of the liver lobules. This model would later be known as “classic” or “Kiernan” lobule,
whereby the basic histologically-defined units of the liver are depicted as polygonal-shaped structures contain-
ing a central vein in the middle and portal tracts at the vertices. The boundaries of the classic liver lobules are
easily recognized in some animal species (most notably in pigs—as they are often used in scientific studies—but
also in camels, raccoons, and polar bears) due to the presence of well-defined fibrous septa delineating the
periphery of individual normal lobules. The “hepatic acinus” model was put forth by Rappaport and colleagues2
in 1954, according to which the liver is subdivided in units based on terminal portal circulation—with zones 1
being closest to portal tracts, zones 3 closest to central veins, and zones 2 located between zones 1 and 3. These
proposed regions, although not defined by histologic landmarks in any species, have been widely adopted in
hepatology and hepatopathology due to their broad correlation with zonal patterns of expression of different cel-
lular products, cell metabolism, as well as with zonal susceptibility to various disease processes. The Matsumoto’s
“primary lobule” model3,4, which is based on the angio-architecture of the portal venous tree and proposes the
subdivision of the classic lobules (termed “secondary lobule” in this model) into 6–8 primary lobules, has also
received increasing attention and acceptance in recent decades. Other unit models have been described, including
the “portal lobule”5 (in which the portal tracts represent the center of the lobule), the “single-sinusoid” model
by Bloch6 and McCuskey7 and the cholehepaton model by Ekataksin and W ake8, but have not been as widely
adopted as the other aforementioned models.
Recently, our group has fortuitously observed a striking similarity between the pattern of geometric parti-
tioning of the universe illustrated by early astronomers in the seventeenth century (René Descartes, in Principia
philosophiae9, supplement figure S1) and the classic lobular architecture of the liver. The mathematical basis for
this method would later be described in detail by the Russian mathematician Georgy F. Voronoy (1868–1908)
and referred to thereafter as Voronoi diagrams—a principle which is now widely utilized across a wide variety
of disciplines, from natural sciences and medicine to engineering and computational geometry10–18. Preliminary
analysis of the liver lobular architecture in porcine and human livers by our group suggested a relationship
1
Department of Computer Science, Rutgers University, Brunswick, NJ, USA. 2Allina Health, Minneapolis, MN,
USA. 3Department of Pathology, University of California, San Francisco, CA, USA. 4Division of Transplantation
Surgery, Department of Surgery, Mayo Clinic, Rochester, MN, USA. 5Department of Pathology and Laboratory
Medicine, Mayo Clinic, Rochester, MN, USA. *email: Moreira.roger@mayo.edu
Scientific Reports | (2021) 11:9343 | https://doi.org/10.1038/s41598-021-88699-2 1
Vol.:(0123456789)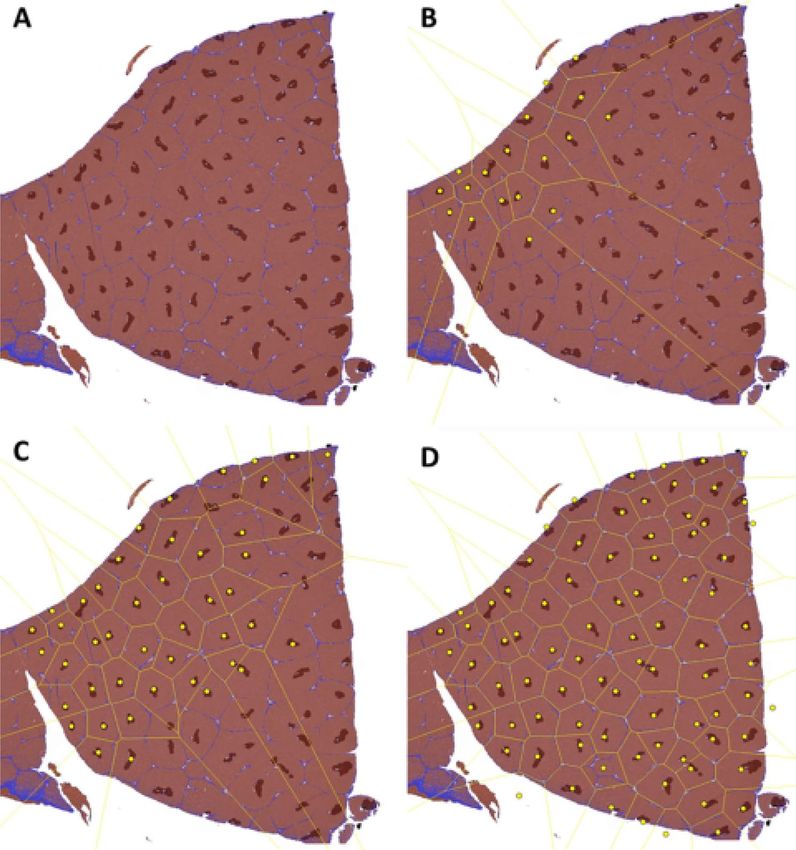
www.nature.com/scientificreports/
Figure 1. Representation of some of the different microanatomic and functional models of the liver. (A) Classic
“Kiernan” lobule model; (B) acinus model of Rappaport; and C, portal lobule. Created by Mayo Clinic Medical
Illustration.
between the general lobular organization of liver tissue and Voronoi diagrams—further understanding of which
could prove useful for the study of liver development, microanatomy, and various disease processes.
In this study, we investigate various aspects of the microanatomy of the human liver and whether the math-
ematical properties of Voronoi diagrams and its geometric/graph theoretical dual, Delaunay triangulation, can
be used to more precisely describe classic hepatic lobules and to determine whether this mathematical tool can
offer further insights to our understanding of the liver microarchitecture that could be useful in the emerging
era of computational histopathology.
Results
Porcine livers. Two whole-slide sections of pig liver were analyzed, measuring 0.84 and 0.64 c m2 in total
area, containing 127 and 76 lobules, and 190 and 130 portal tracts, respectively. In this species, since the bounda-
ries of the classic hepatic lobules are demarcated by interlobular connective tissue, we were able to precisely
assess the accuracy with which Voronoi diagrams describe the two-dimensional hepatic lobular organization.
The classic lobular architecture of the liver largely overlapped with Voronoi diagrams obtained through any of
our five methods, which showed a surface overlap area ranging from 86.7% (object edge method) to 88.6% (trial
and error method) of all 203 porcine lobules by digital analysis (P = 0.007, but no statistically significant differ-
ence among trial and error, modified edge, and centroid methods).
Voronoi diagrams also fairly accurately described the overall two-dimensional/cross sectional shape, num-
ber of sides, angles, and general orientation of most lobules (Supplemental figure S2). Utilizing the trial and
error method, the most common Voronoi region shape in pigs was the pentagon (representing 40% [81/203] of
lobules), followed by the hexagon (32.5% [66/203] of lobules) (Supplemental figure S3). The number of sides of
polygons ranged from 3 (triangles) to 8 (octagons). The average area of pig lobules in our samples was 0.69 mm2
(standard deviation [SD], 0.20 m m2) and the average circumcircle polygon diameter was 1.2 mm.
The edges of Voronoi regions either coincided or were located in close proximity with the majority of inter-
lobular fibrous septa of cross-sections of classic lobules. In a subgroup of larger lobules, however, corresponding
to “compound hepatic lobules” described by Ekataksin and W ake19, Voronoi diagrams often subdivided individual
compound lobules (which almost invariably contained 2 or more central vein profiles) in different regions.
Therefore, one or more of the Voronoi edges did not correspond to interlobular connective tissue septa in these
Scientific Reports | (2021) 11:9343 | https://doi.org/10.1038/s41598-021-88699-2 2
Vol:.(1234567890)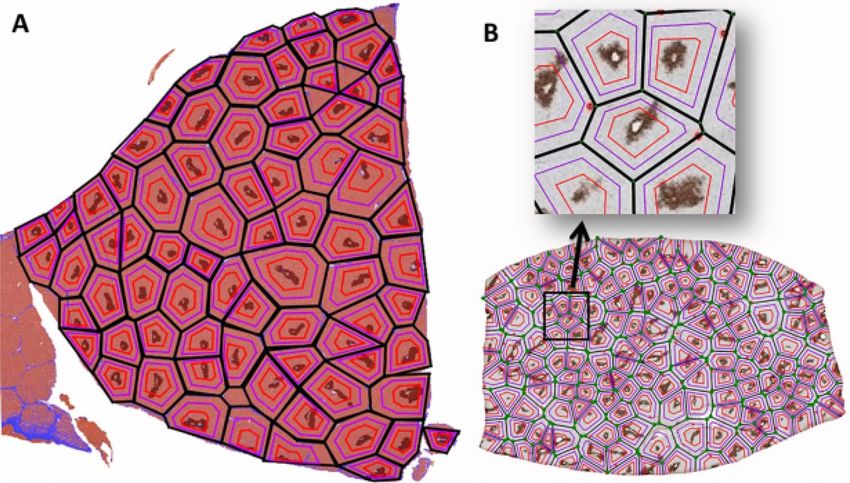
www.nature.com/scientificreports/
instances (which represented 14.3% [29/203] of porcine lobules). Occasionally, very small lobule cross sections
were also present—presumably representing either tangential sectioning or the terminal aspect of a lobule—and
their corresponding Voronoi regions were significantly larger than the lobule profile (representing 6.9% [14/203]
of porcine lobules). Examples of these structures are illustrated in Fig. 7.
Human livers. Five whole-slide sections of human liver were analyzed, containing a total of 11.25 cm2 of
tissue (median: 2.42 cm2; range, 1.46–2.88 cm2) and a total of 812 portal tracts (median: 170 portal tracts; range
113–217).
In humans, since the boundaries of the classic hepatic lobules are not histologically demarcated, we assessed
the accuracy with which Voronoi diagrams describe the two-dimensional hepatic lobular organization based
on the presence of GS-positive areas near the center of the Voronoi regions (i.e., zones 3) and the inclusion of
previously annotated portal tracts within the peripheral areas of Voronoi regions (i.e., zones 1), as defined in this
study. In order to accomplish this, we have created an algorithm (referred to as zonal algorithm) to subdivide
each Voronoi or modified Voronoi region (depending on the Voronoi method utilized) into three different zones,
analogous to the Rappaport acinus model.
The algorithm method of Voronoi generation had the best performance for portal tracts (84.4% falling within
zones 1) and the modified edge method had the best performance for GS-positive areas (97.2% of positive area
falling within zones 3). The total accuracy scores (encompassing zones 1 and zones 3) for each method ranged
from 85.2 to 89.6% for the five methods, with the modified edge method being overall the most accurate.
Utilizing the most accurate method for each sample, the most common Voronoi region shape in humans
was the heptagon (representing 34% [353/1035] of lobules), closely followed by the hexagon (32% [331/1035] of
lobules) (Supplemental figure S4). The number of sides of Voronoi polygons in humans, similarly to pigs, ranged
from 3 (triangles) to 8 (octagons). The average area of human lobules in our samples was 0.89 m m2 (standard
2
deviation [SD], 0.51 mm ) and the median circumcircle polygon diameter was 1.3 mm.
Discussion
The classic liver lobule—most clearly visualized in the normal porcine liver, in which dense and well-delineated
interlobular fibrous septa linking portal tracts establish an easily identifiable boundary to each classic lobule—has
traditionally been characterized and illustrated as uniform hexagonal structures, with portal tracts positioned
in each of the six vertices and a central vein located in its center (Fig. 1). The human liver is generally thought
to be organized in a similar fashion, although the delineation of the classic lobule cannot be properly visual-
ized on routines stains. Functionally, in both human and non-human mammalian species, and based on the
microanatomy of the classic liver lobule, hepatocytes are subdivided into three distinct zones (Rappaport lobule,
Fig. 1). In spite of the typical lobular representation as juxtaposed regular hexagons, histologic examination
of porcine liver sections (or human liver sections stained with zone-specific immunohistochemical markers)
reveals a decidedly more complex picture: liver lobules of variable sizes and shapes—commonly but not always
roughly hexagonal—with a non-uniform number of portal tracts surrounding each central vein. This relatively
high degree of variability also extends to the central veins themselves, which are often somewhat eccentrically
located within the liver lobules, show a seemingly haphazard orientation, and frequently bifurcate or trifurcate.
Although the three-dimensional structure of the liver lobule is fairly complex and proper orientation of
portal tracts and central veins is not practically feasible histologically, evaluation of sections with the aid of
zone-specific immunohistochemical markers and utilization of digital tools enabled us to hypothesize a novel
concept—whereby the two dimensional classic lobular architecture of the liver is neither random nor uniform;
rather, it is generally organized following the mathematical/geometric principles of Voronoi diagram and Delau-
nay triangulation.
Some of the basic concepts related to Voronoi diagrams were investigated as early as 1644 by the French
philosopher and mathematician René Descartes, as a method of describing the distribution of matter through-
out the solar system and the universe (Supplemental figure S1). This method was later applied by the German
mathematician Johan Dirichlet in 1850 to the study of quadratic forms. Voronoi diagrams (also known as Voronoi
tessellation, Voronoi partition, or Dirichlet tessellation) were named after the Russian mathematician Georgy
Voronoy, who expanded Dirichlet’s formalized concepts of diagrams in the two- and three-dimensional cases to
the n-dimensional case. A Voronoi diagram is defined as the partition of a plane with n generating seeds (also
referred to as “sites”, “points”, or “generators”) into convex polygons (known as “regions”, or “cells”), in which
each polygon has exactly one seed and every specific location within a given polygon is nearest to its generating
seed than to any other seed20–22.
Voronoi patterns are quite ubiquitous in nature—as exemplified by the crystalloid structure of some minerals,
the puzzle-like pattern of a giraffe’s fur, the delicate ridges on a dragonfly’s wings, and tortoise shell plates (Sup-
plemental figure S5). This pattern arises in many cases due to expansion (or growth in case of biological tissue)
from the “seed”/originating point of the Voronoi region outwards (Supplemental figure S6). Gomez-Galvez
et al.13 have proposed that a three-dimensional geometrical shape named “scutoid” (resembling the scutellum of
a beetle) represents the optimal configuration for energy efficiency and three-dimensional packing of epithelial
cells. This unique geometrical shape was predicted by Voronoi tessellation models and subsequently verified in
various types of epithelium by the same group. Voronoi diagrams have also been utilized to study the density
and spatial distribution of neurons14, to design 3D scaffolds for bone tissue bioengineering15, to explain tissue
self-organization and c ytomorphology16, and to model human tumor tissue g rowth17. Voronoi diagrams are also
widely utilized in the field of computational pathology and digital image analysis in histology and histopathology,
especially with the purpose of outlining the otherwise difficult-to-recognize cell borders on histologic sections
Scientific Reports | (2021) 11:9343 | https://doi.org/10.1038/s41598-021-88699-2 3
Vol.:(0123456789)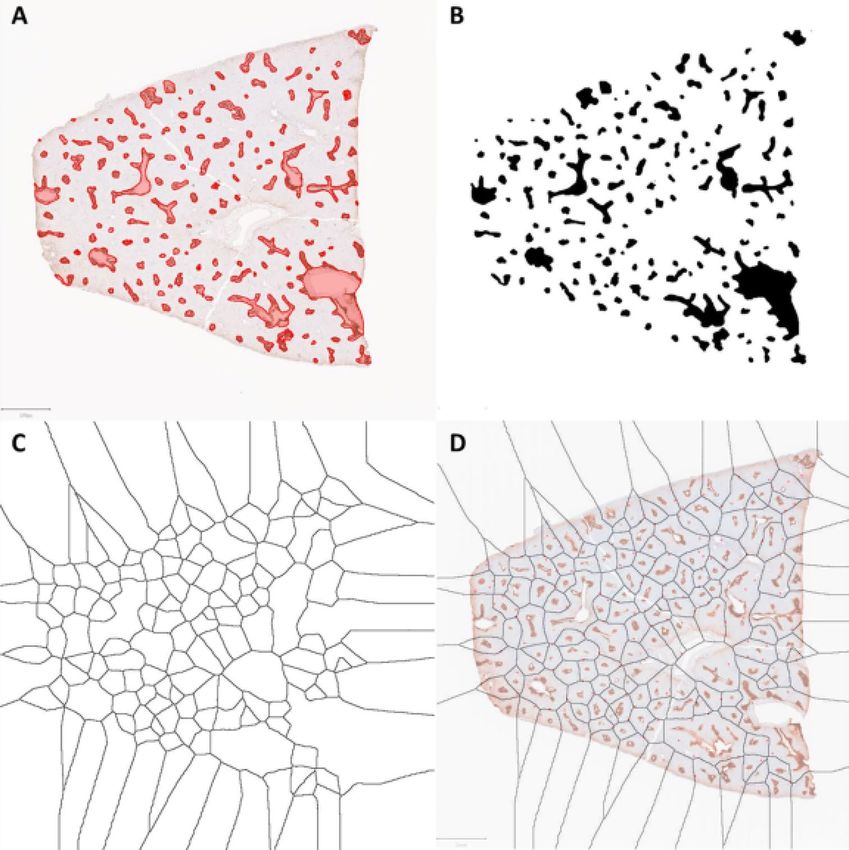
www.nature.com/scientificreports/
(both routine stains and immunostains). Its graph theoretical dual—Delaunay triangulation—is also employed
in various forms of spatial analysis between cells, cell types, and microanatomic s tructures23,24.
Our data demonstrated that the overall two-dimensional lobular architecture of the liver in both pigs and
humans is characterized by a pattern that closely approximates that of a Voronoi diagram, with central veins
representing originating sites. This knowledge seems particularly helpful since, in humans, neither the classic
lobule nor the hepatic acinus is specifically demarcated histologically, and even histochemical/ immunohisto-
chemical zonal markers are not practically useful with respect to precise lobular delineation. Although Voronoi
(and Voronoi-like) diagrams can be constructed using slightly different methods in this context, all approaches
utilized by our group were able to describe the known classic lobular architecture of porcine livers with an accu-
racy greater than 85%, as assessed by digital image analysis and, in humans, voronoi diagrams were able to place
GS-positive areas in zones 3 and portal tracts in zones 1 with an overall accuracy ranging from 85% to nearly 90%.
Therefore, our data strongly indicate that the typical characterization of the two-dimensional lobular architecture
of the liver as juxtaposed regular hexagons is inaccurate or, at best, oversimplified. Rather, the hepatic lobular
organization is best described as a “Voronoi pattern” in which polygons with 5–7 sides predominate (Fig. 8).
In pigs, our model showed pentagons to actually represent the most common shape of Voronoi polygons
modeling classic lobules (40%), followed by hexagons (32.5%), with number of sides varying from 3 to 8. These
observations are essentially in agreement with early meticulous descriptions by E. G. White in 1 93925, who also
noted pentagons (47%) and hexagons (37%) to be the most common shapes among 650 adult porcine lobules,
with number of sides varying from 3 to 8. Our model also showed a mean lobular area of 0.69 mm2 in pigs. While
hite25, Johnson26, and M
the area of lobules was not calculated in classic studies, the works of W all5 mention aver-
age diameters of 1.5 mm, 1.2 mm, and 1.2 mm, respectively (compared to 1.2 mm in our model).
In humans, information regarding the shape and size of human classic lobules is fairly scarce in literature.
The radius of the human lobules has been recently measured at 491 µm (diameter of approximately 1 mm)
based on portal tract-central vein distances by Hall et al.27, which is in keeping with the previously stated lobular
diameters ranging from 1.0 to 1.3 mm28–30. Based on these numbers, using an circumcircle radius of 0.491 to
0.65 mm for a regular heptagon (considering this as a prototypical human lobule), the resulting polygon area
would be 0.65–1.15 mm2 (or 0.89 mm2 using the average [0.57 mm] of these previously reported values), which
is the exact average cross-sectional area obtained by our model. Using alkaline phosphatase histochemical stain,
Teutsch31 reported human liver lobules to be polyhedral, with seven to nine facets. In our model, the most com-
mon shapes were heptagons (34%) and hexagons (32%), with number of polygon sides varying from 3 to 8. In
addition, as predicted by Voronoi tessellation, the non-equidistant central veins in sections of human livers are
often eccentrically placed in their respective polygons (lobules) rather than always being at or around their center,
as would be the case for a honeycomb pattern formed exclusively by regular hexagons.
The three-dimensional structure of the liver is, overall, still poorly understood. Teutsch31, in a 3D recon-
struction of a portion of human liver, described classic lobules (referred to in his work as “primary modules”)
as polyhedral structures with seven to nine facets, having heights of up to 0.9 mm and volumes of 0.1 to 0.9
mm3. The precise visualization and 3D reconstruction of individual liver lobules (in humans as well as in mice
and rats) is further complicated by the lack of a recognizable boundary at the histologic level, hence requiring
histochemical or immunohistochemical m ethods31,32. Voronoi diagrams are widely used in three-dimentional
spatial partitioning, generating convex polyhedra33. Therefore, conceptually, Voronoi diagrams (or approximate
Voronoi diagrams) could be used to attempt to mathematically model the complex 3D architecture of liver lob-
ules. This, however, was beyond the scope of this study.
Aside from representing a more accurate descriptive model of the classic lobular architecture of the liver,
the geometric properties proposed in this study also have implications to other liver unit models. Regarding
liver zonation, for instance, the precise boundaries between the different zones of the Rappaport lobule can be
established mathematically (or computationally) based on the location of central veins—especially if aided by
central zone-specific immunostain or immunofluorescence markers. Currently, zonation of liver tissue cannot
reliably be established by any method, especially in areas away from the immediate vicinity of central veins and
portal tracts. As part of this study, and based on Voronoi diagrams, we have designed a digital image analysis
algorithm that was able to delineate the borders of classic lobules in both pigs and humans as well as subdivide
each lobule into different zones, in a fashion analogous to the Rappaport acinar model. We were also able to test
the performance of our algorithm in human livers given the known location of zones 3 (GS-positive centrilobular
areas) and positions of portal tracts (within zone 1). Using these structures as zonal landmarks, our best model
had an accuracy of nearly 90%. Hence, this method—or future refinements thereof—could be used to more
accurately and objectively study not only the size and shape of liver lobules in normal conditions (and how these
may change in different diseases) but also the zonality of normal phenomena in hepatic physiology and zonal
involvement by common pathologic processes such as steatosis, inflammation, necrosis, and liver fibrosis. In
addition, using a computational geometry algorithmic approach, the delineation and definition of lobular zones
(i.e., size and configuration of each zone) can be customized to specific needs, according to which physiologic
or pathologic process is being studied.
Finally, an important implication derived from the Voronoi organization of the classic liver lobules relates to
its embryology. Although the specific dynamics of hepatocyte tissue growth during embryological and post-natal
development is highly complex—and beyond the scope of this study—the Voronoi organization of the classic
liver lobules would indicate that cellular growth of primordial hepatocytes starts at the vicinity of the central vein
and proceeds outwards radially, with portal tracts (and fibrous septa in some species) forming along the expand-
ing edge of the nascent lobules—and eventually settling along the border of two or three classic lobular units.
In summary, our work describes the relationship between Voronoi diagrams and the liver microarchitecture
in both pigs and humans. We have presented histologic and mathematical evidence that Voronoi diagrams
accurately describe the basic two-dimensional organization of the normal liver. This method seems especially
Scientific Reports | (2021) 11:9343 | https://doi.org/10.1038/s41598-021-88699-2 4
Vol:.(1234567890)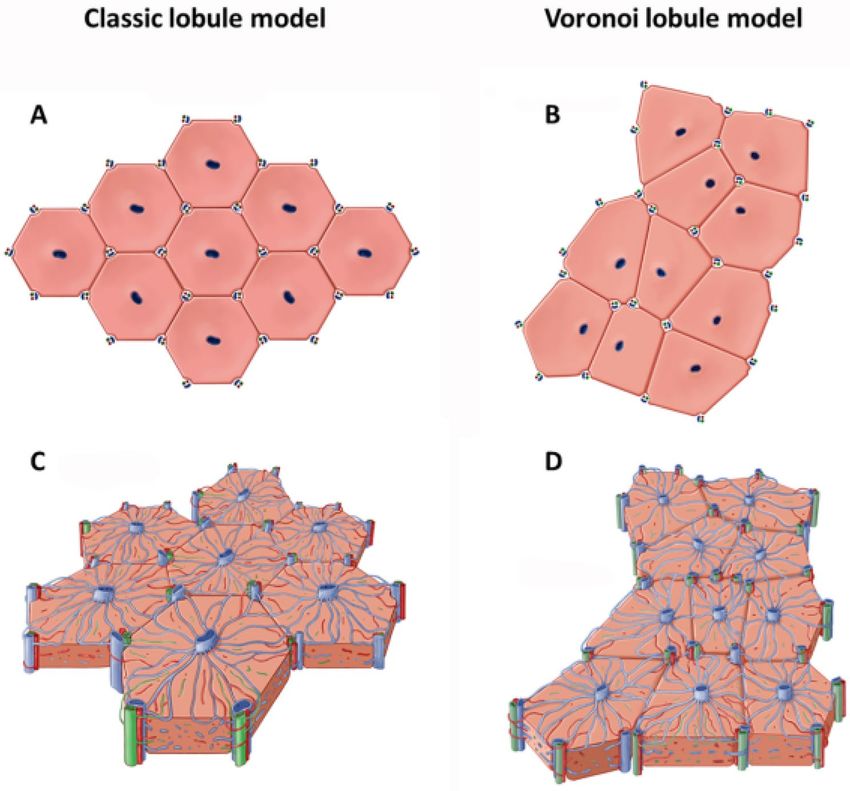
www.nature.com/scientificreports/
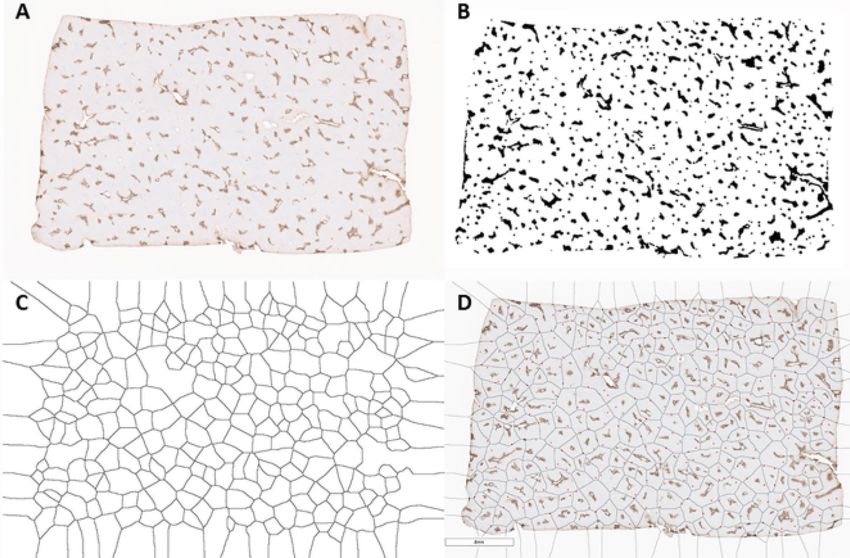
Figure 2. “Trial and error” method in a section of porcine liver (AI-assisted colorized Masson trichrome/
glutamine synthetase immunostains composite image). Utilizing an interactive Voronoi digital tool (Fiji ImageJ
Voronoi Delaunay plugin), Voronoi sites (yellow dots) were placed at the location of central veins. As Voronoi
regions were generated, the location of sites was adjusted, as needed, for maximum overlap of Voronoi edges
with the boundary of lobules (interlobular fibrous tissue). Original image (A). Initiation of the interactive
Voronoi process (B). Continuation of interactive Voronoi process (C). Final Voronoi diagram (D). Sofware
utilized: QuPath v-.2.0-m12 (Bankhead, P. et al. (2017). QuPath: Open source software for digital pathology
image analysis. Scientific Reports) and Fiji ImageJ 1.52p (Schindelin, J.; Arganda-Carreras, I. & Frise, E. et al.
(2012), "Fiji: an open-source platform for biological-image analysis", Nature methods 9(7): 676–682).
relevant to the study human livers, since reliable histologic landmarks of lobular boundaries are absent. We have
also designed an algorithm based on Voronoi diagrams that enabled us to delineate boundaries of zones 1–3
within the classic lobules in humans, hence representing a method that would allow for more precise quantita-
tive analysis of both physiologic and pathologic zonal processes, regardless of how, exactly, the hepatic zones
are defined. Therefore, in addition to a better understanding of the liver microstructure itself, the utilization of
this mathematical/computational tool opens numerous possibilities of relevant applications in the study of the
normal liver and liver diseases, especially in view of the increasing utilization of digital pathology and artificial
intelligence-assisted histologic evaluation.
Materials and methods
Histologic samples. Normal human liver samples (n = 5; 2 males and 3 females; median age 57, range
29–77) were obtained from Mayo Clinic archival surgical pathology material, utilizing sections of grossly normal
liver tissue (based on gross examination of surgical specimens). Specimens were obtained from large (lobec-
tomy) specimens performed for excision of benign (focal nodular hyperplasia, n = 2) or malignant (metastatic
breast cancer, n = 1; hepatocellular carcinoma, n = 2) lesions. All patients had a single lesion within the resected
specimen and at least 5 cm of surrounding normal liver, from which sections were taken. All five patients had
normal liver enzymes, except one patient who had mildly elevated serum levels of aspartate aminotransferase
Scientific Reports | (2021) 11:9343 | https://doi.org/10.1038/s41598-021-88699-2 5
Vol.:(0123456789)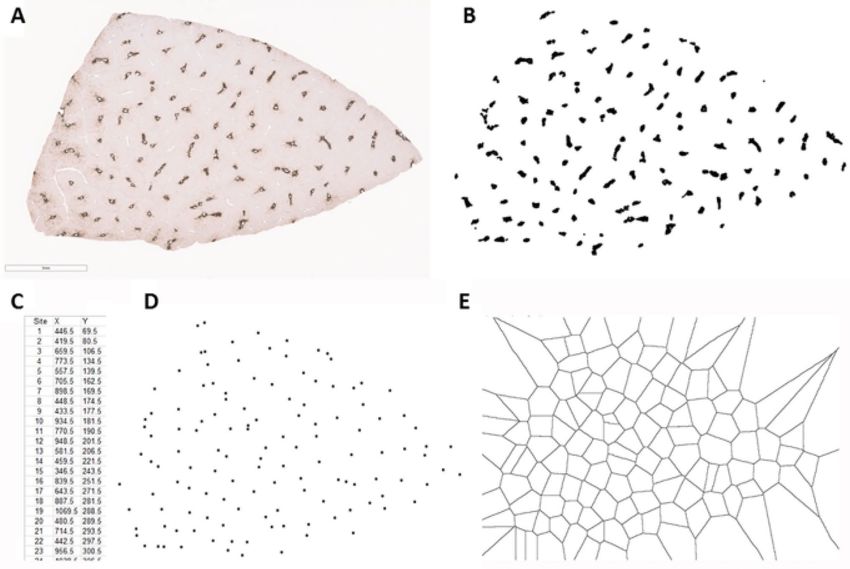
www.nature.com/scientificreports/

                                            Figure 3.  “Centroid” approach for obtaining a Voronoi diagram based on the location of central veins in a
                                            section of normal porcine liver. The process starts with the centrilobular/zone 3 marker glutamine synthetase
                                            (GS) immunostain (A). GS-positive areas are segmented and transformed into a binary image (B). Centroid
                                            coordinates are obtained (C). Location of centroids are plotted (D). Voronoi diagram is generated (E) for
                                            subsequent overlay with trichrome-GS composite image (not shown). Software utilized: Fiji ImageJ 1.52p
                                            (Schindelin, J.; Arganda-Carreras, I. & Frise, E. et al. (2012), "Fiji: an open-source platform for biological-image
                                            analysis", Nature methods 9(7): 676–682).

                                            (59 U/L) and one who had mildly elevated serum alkaline phosphatase (171 U/L). None of the patients had
                                            clinical history of liver diseases, clinical signs of portal hypertension, or received pre-surgical chemo-radiation
                                            therapy for the hepatic lesion. Normal adult Landrace porcine liver sections were obtained from archival histol-
                                            ogy material from the Mayo Clinic William J. von Liebig Center for Transplantation and Clinical Regeneration.
                                                H&E, trichrome, and reticulin stains were performed on all samples with standard protocols, reviewed by
                                            a liver pathology specialist, and showed no fibrosis, nodularity, or other histopathologic abnormalities, aside
                                            from very mild (less than 5%) steatosis in two of the human samples. Immunohistochemical studies for the
                                            centrilobular marker glutamine synthetase (GS) (monoclonal antibody, clone GS-6; Millipore, Temecula, CA,
                                            USA) were performed on all samples.
                                                Human and tissue samples were obtained in accordance to the regulations and with the approval of Mayo
                                            Clinic Institutional Review Board. All human tissue samples we have utilized for this study are from archived
                                            material (i.e. left over tissue previously obtained for medical procedures and already thoroughly tested/evalu-
                                            ated from a clinical perspective). None of the samples were obtained exclusively or specifically for the purposes
                                            of this study. Consent waiver for this study was approved by Mayo Clinic Institutional Review Board. Animal
                                            samples were obtained in accordance to the regulations and with the approval of the American Association for
                                            Laboratory Animal Science (IACUC).

                                            Digital analysis. Glass slides were scanned and imaged using the Aperio (Leica) ScanScope AT Turbo
                                            Instrument. Each slide was scanned at × 40 magnification on the Aperio ScanScope AT Turbo brightfield instru-
                                            ment (Leica Biosystems) at a resolution of 0.50 μm per pixel. ImageScope and eSlide Manager (Leica Biosystems)
                                            were utilized to view the digital images. Whole slide images (WSI) and still images were used for histologic anno-
                                            tations and digital image analysis using QuPath v-0.2.0-m12 and Fiji ImageJ 1.52p. Voronoi diagram composite
                                            images were analyzed using OpenCV version 4.3 and Shapely vesion 1.7, both in Python 3 version 3.6.

                                            Generation of Voronoi diagrams. Voronoi diagrams and, when applicable, Delaunay triangulation, were
                                            digitally generated using GS-positive perivenular areas as references for the position of generating points using

          Scientific Reports |   (2021) 11:9343 |                https://doi.org/10.1038/s41598-021-88699-2                                                        6

Vol:.(1234567890)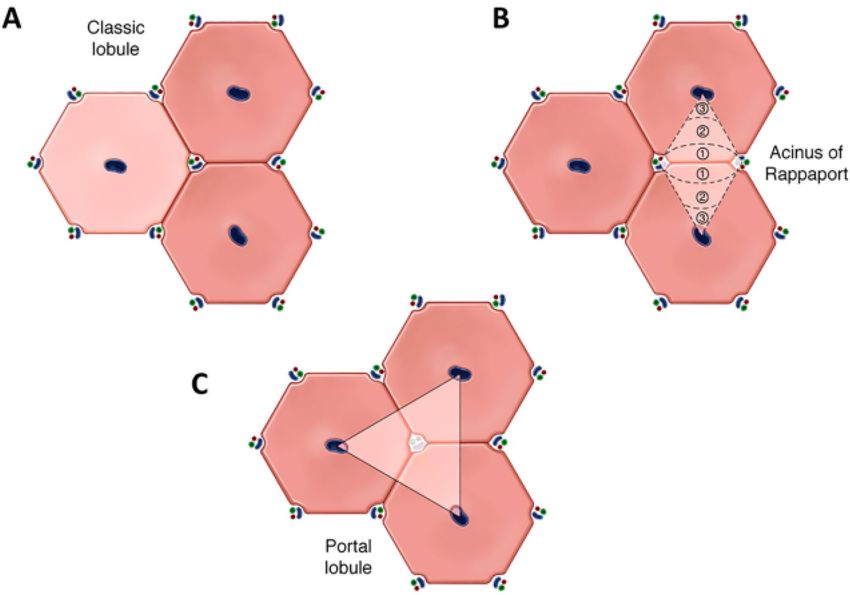
www.nature.com/scientificreports/

                                  Figure 4.  “Object edge” approach for obtaining a Voronoi diagram based on the location of central veins on
                                  glutamine synthetase (GS) immunostains in a section of normal human liver. Original GS immunostain (A)
                                  and binarization of GS-positive zone 3 areas (B). Voronoi-like diagram is generated based on the edges of each
                                  object (rather than a single point) (C). Diagram is combined with GS immunostains whole slide scan image;
                                  portal tracts have been previously annotated as red stars on the original immunostains image; notice that the
                                  large majority of portal tracts are located along the edges of Voronoi regions (D). Software utilized: Fiji ImageJ
                                  1.52p (Schindelin, J.; Arganda-Carreras, I. & Frise, E. et al. (2012), "Fiji: an open-source platform for biological-
                                  image analysis", Nature methods 9(7): 676–682).

                                  the “Delaunay Voronoi” plugin in Fiji ImageJ 1.52p. This software permits the placement of points at any loca-
                                  tion within a given image (and subsequent adjustment of their position if needed) and interactive generation of
                                  Voronoi diagrams and/or Delaunay triangulation based on the position of these points. Voronoi diagrams were
                                  generated using five different methods.

                                  1. “Trial and error” approach: Using Fiji ImageJ Delaunay Voronoi plugin and whole-section images obtained
                                     from WSI files, dots were placed over recognizable central veins or GS-positive areas in both pig and human
                                     liver sections. Trichrome-GS composite images were used for pig livers and annotated GS images were used
                                     in human livers. If no recognizable central vein was present within a given porcine lobule, a point was placed
                                     in its center. The position of points were then adjusted as needed, on a trial and error basis, so that the edges
                                     of the Voronoi diagram overlapped maximally with the interlobular fibrous tissue of liver lobules (in porcine
                                     livers) and with surrounding previously annotated portal tracts (in human livers) (Fig. 2).
                                  2. “Centroid”approach: Whole-section still images from WSI scans of GS immunohistochemistry slides were
                                     utilized and further processed digitally using Fiji ImageJ (8-bit conversion, followed by image thresholding
                                     – Image > Adjust > Threshold [using “default” and “red” settings]). The image was then converted to binary
                                     (Process > binary > Make binary) and background noise was cleared (Process > Noise > Despeckle). Centroid
                                     coordinates were then obtained (Analyze > analyze particle, with “centroid” checked under “Set Measure-
                                     ments”). Voronoi diagrams were then obtained utilizing centroid locations as points (Fig. 3).
                                  3. “Object edge” approach: Images were processed in a manner identical to that described for the centroid
                                     approach (except for the centroid, coordinates, and plotting steps). The resulting image was then converted to
                                     a Voronoi-like pattern (Process > Binary > Voronoi), whereby lines with equal distance to the borders (rather
                                     than centroid) of the two nearest particles are generated. Thus, the resulting Voronoi-like partition, similarly
                                     to a true voronoi diagram, includes all points that are nearer to the edge of its generating particle than to
                                     the edge of any other particle. However, given the fact that most of the particles were not single points (but,

Scientific Reports |   (2021) 11:9343 |                https://doi.org/10.1038/s41598-021-88699-2                                                         7

                                                                                                                                                 Vol.:(0123456789)
www.nature.com/scientificreports/
Figure 5. Modified object edge method: digital annotation of glutamine synthetase (GS) immunostains of
normal human liver (A), binary transformation (B), generation of Voronoi-like diagram based on object edges
(C) and overlay with original GS immunostain with annotated portal tracts (D). Software utilized: QuPath
v-.2.0-m12 (Bankhead, P. et al. (2017). QuPath: Open-source software for digital pathology image analysis.
Scientific Reports) and Fiji ImageJ 1.52p (Schindelin, J.; Arganda-Carreras, I. & Frise, E. et al. (2012), "Fiji: an
open-source platform for biological-image analysis", Nature methods 9(7): 676–682).
rather, irregular regions of varying sizes), the resulting partition does not follow all the defining features of a
Voronoi diagram from a mathematical standpoint, therefore being referred to here as a Voronoi-like diagram
(Fig. 4).
4. “Modified object edge” approach: Whole-section still images from WSI scans of GS immunohistochemistry
slides were utilized. GS-positive perivenular areas and central veins were manually annotated as objects
using QuPath v-0.2.0-m12, then further processed using “residual” under Brightness and Contrast” for
background exclusion. The resulting image was exported to ImageJ for segmentation (8-bit conversion, then
Image > Threshold) and generation of Voronoi-like diagram (Process > Binary > Voronoi) (Fig. 5).
5. Algorithm approach: The algorithm utilized the Python3 language as well as OpenCV, an image-processing
library for Python3 and Scipy.spatial library for Voronoi diagram generation. Still images from WSI scans
of trichrome and GS immunohistochemistry slides (annotated GS stains for humans and trichrome and
trichome-GS composite images for pigs) were utilized. Central veins were annotated and transformed into
objects using OpenCV. The GS-positive perivenular areas were recognized by OpenCV as objects and trans-
formed into single points (object centroids). First, a Voronoi diagram based on the location of centroids of
GS-positive perivenular areas was generated. The diagram was then refined by adjusting the position of both
the polygon edges and vertices in order for them to maximally match the position of interlobular fibrous
septa (in pig livers) and annotated portal tracts (in humans). In order to preserve a structure at least closely
approximating a Voronoi diagram, a depth-first search error metric that measures the mismatch between
the original Voronoi diagram and the adjusted diagram was obtained, with the a maximum allowed non-
overlapping area of 5%. In addition to the depth-first search, a clustering algorithm was also used to separate
large regions (suggesting the presence of more than one GS-positive perivenular area within the region) into
Scientific Reports | (2021) 11:9343 | https://doi.org/10.1038/s41598-021-88699-2 8
Vol:.(1234567890)www.nature.com/scientificreports/
Figure 6. Voronoi diagram through the algorithm approach on a pig liver section (A) (black lines) and human
liver section (B). Zonation algorithm further divides each lobule into three zones. Purple lines represent the
border between zones 1 and 2, while red lines mark the border between zones 2 and 3 (A,B). Software utilized:
QuPath v-.2.0-m12 (Bankhead, P. et al. (2017). QuPath: Open-source software for digital pathology image
analysis. Scientific Reports) and Fiji ImageJ 1.52p (Schindelin, J.; Arganda-Carreras, I. & Frise, E. et al. (2012),
"Fiji: an open-source platform for biological-image analysis", Nature methods 9(7): 676–682). Voronoi algorithm
created in OpenCV version 4.3 and Shapely vesion 1.7, both in Python 3 version 3.6.
Figure 7. Artificial intelligence-assisted recognition of hepatocytes and fibrous tissue with digital colorization,
for better visualization of lobular architecture at 20 × magnification, of a section of porcine liver (A). The same
image with superimposed Voronoi diagram, showing compound lobules (examples highlighted in semi-
translucent blue) with multiple central vein profiles (B). Small lobular cross sections (likely representing the
tip of a lobule or a tangential section) highlighted in semi-translucent yellow (B). Software utilized: QuPath
v-.2.0-m12 (Bankhead, P. et al. (2017). QuPath: Open source software for digital pathology image analysis.
Scientific Reports) and Fiji ImageJ 1.52p (Schindelin, J.; Arganda-Carreras, I. & Frise, E. et al. (2012), "Fiji: an
open-source platform for biological-image analysis", Nature methods 9(7): 676–682).
smaller regions (including new Voronoi sites). The resulting image of a Voronoi-like diagram was generated
using Matplotlib, a Python3 library for generating images.
We have also created an algorithm to subdivide each Voronoi or modified Voronoi region into three con-
centric zones, analogous to the Rappaport acinus model. The zonal algorithm utilized the Python3 language
and OpenCV. The general location of the GS-positive perivenular areas were recognized using OpenCV. Within
each Voronoi region pertaining to a particular GS-positive area, zone 3 was defined as the region with maximum
coverage of GS-positive areas and minimal coverage of GS-negative areas that maintains the same polygon
configuration as its corresponding Voronoi region. Zone 1 was defined as the area between the edges of each
Scientific Reports | (2021) 11:9343 | https://doi.org/10.1038/s41598-021-88699-2 9
Vol.:(0123456789)www.nature.com/scientificreports/
Figure 8. Comparison between the typical representation of the classic lobule model (A,C) formed by
juxtaposed regular hexagons and the Voronoi model (B,D) characterized by a Voronoi diagram pattern. Created
by Mayo Clinic Medical Illustration.
Voronoi region and a line that runs at the midpoint between the Voronoi edge and the border of zone 3. The
intermediate area between zone 3 and zone 1 (of equal width to zone 1) represented zone 2. The resulting image
of the algorithm’s output was generated using Matplotlib, a Python3 library for generating images. An example
of Voronoi diagram by the algorithm approach and zonation is shown in Fig. 6.
Statistical analysis. Descriptive statistics were presented using average and standard deviation or median
and interquartile range for continuous data with normal and non-normal distribution, respectively. Percent-
ages were used for categorical data. Groups were compared using one-way analysis of variance (ANOVA) and
t-test. Normal distribution was tested using the Shapiro–Wilk test (MedCalc Software, Ostend, Belgium). A
P-value < 0.05 was considered statistically significant (Figs. 7, 8).
Received: 10 December 2020; Accepted: 12 April 2021
References
1. Kiernan, F. The anatomy and physiology of the liver. Philos. Trans. R Soc. Lond. 123, 711–770 (1833).
2. Rappaport, A., Borowy, Z. J., Lougheed, W. M. & Lotto, W. N. Subdivision of hexagonal liver lobules into a structural and functional
unit: Role in hepatic physiology and pathology. Anat. Rec. 119, 11–34 (1954).
3. Matsumoto, T. et al. A study on the normal structure of human liver, with special reference to its angioarchitecture. Jikeikai Med.
J. 26, 1–40 (1979).
4. Matsumoto, T. & Kawakami, M. The unit-concept of hepatic parenchyma: A reexamination based on angioarchitectural studies.
Acta Pathol. Jpn. 32, 285–314 (1882).
5. Mall, F. A study of the structural unit of the liver. Am. J. Anat. 5, 227–308 (1906).
6. Bloch, E. The termination of hepatic arterioles and the functional unit of the liver as determined by micrscopy of the living organ.
Ann. NY Acad. Sci. 170, 78–87 (1970).
7. MacCuskey R. Hepatic microcirculation. In Bioulac-Sage, P., Balabaud, C., eds Sinusoids in human liver: health and disease. 151–164
(1988).
Scientific Reports | (2021) 11:9343 | https://doi.org/10.1038/s41598-021-88699-2 10
Vol:.(1234567890)www.nature.com/scientificreports/
8. Ekataksin W, Wake, K. New concepts in biliary and vascular anatomy of the liver. In : Boyer JL, Ockner RK, eds Progress in liver
diseases, vol XV Philadelphia: WB Saunders. 1–30 (1997).
9. Descartes R. Principia philosophiae. Amstelodami: Ludovicum Elzevirium. 1644.
10. Bock, M., Tyagi, A. K., Kreft, J. U. & Alt, W. Generalized voronoi tessellation as a model of two-dimensional cell tissue dynamics.
Bull. Math. Biol. 72, 1696–1731 (2010).
11. Kasim, M. F. et al. Quantitative shadowgraphy and proton radiography for large intensity modulations. Phys. Rev. E. 95, 023306
(2017).
12. Pimpinelli, A., Tumbek, L. & Winkler, A. Scaling and exponent equalities in island nucleation: Novel results and application to
organic films. J. Phys. Chem. Lett. 5, 995–998 (2014).
13. Gomez-Galvez, P. et al. Scutoids are a geometrical solution to three-dimensional packing of epithelia. Nat. Commun. 9, 2960 (2018).
14. Duyckaerts, C. & Godefroy, G. Voronoi tessellation to study the numerical density and the spatial distribution of neurones. J.
Chem. Neuroanat. 20, 83–92 (2000).
15. Gomez, S., Vlad, M. D., Lopez, J. & Fernandez, E. Design and properties of 3D scaffolds for bone tissue engineering. Acta Biomater.
42, 341–350 (2016).
16. Sanchez-Gutierrez, D. et al. Fundamental physical cellular constraints drive self-organization of tissues. EMBO J. 35, 77–88 (2016).
17. Saribudak, A., Yiyu, D., Gundry, S., Hsieh, J. & Uyar, M. U. Mathematical models of tumor growth using Voronoi tessellations in
pathology slides of kidney cancer. Conf. Proc. IEEE Eng. Med. Biol. Soc. 2015, 4454–4457 (2015).
18. Ayawli, B. K., Mei, X., Shen, M. Q., Appiah, A. Y. & Kyeremeh, F. Mobile robot path planning in dynamic environment using
voronoi diagram and computation geometry technique. IEEE Access. 7, 86026–86040 (2019).
19. Ekataksin W WK. Liver units in three dimensions: I. Organization of argyrophilic connective tissue skeleton in porcine liver with
particular reference to the "compond hepatic lobule". Am. J. Anat. 191, 113–153 (1991).
20. Aurenhammer, F. Voronoi diagrams: A survey of fundamental geometric data structure. ACM Comput. Surv. 23, 345–405 (1991).
21. Aurenhammer FK, R; Lee, D. . Voronoi Diagrams and Delaunay Triangulations 1st Ed. ed. USA: World Scientific Publishing Co.,
Inc.; 2013.
22. B K. The State of the Art of Voronoi Diagram Research. Transactions on Computational Science XX Lecture Notes in Computer
Science Berlin, Heidelberg: Springer; 2013 (8110).
23. Kaliman, S., Jayachandran, C., Rehfeldt, F. & Smith, A. S. Limits of applicability of the voronoi tessellation determined by centers
of cell nuclei to epithelium morphology. Front. Physiol. 7, 551 (2016).
24. Sudbo, J., Marcelpoil, R. & Reith, A. New algorithms based on the Voronoi Diagram applied in a pilot study on normal mucosa
and carcinomas. Anal. Cell Pathol. 21, 71–86 (2000).
25. White, E. G. Some observations on the liver of the pig: the hepatic lobule and liver cell during post-natal growth. J. Anat. 73(Pt
3), 365–386 (1939).
26. Johnson, F. P. The isolation, shape, size, and number of the lobules in the pig’s liver. Am. J. Anat. 23, 273–283 (1918).
27. Hall, A. et al. Transaminase abnormalities and adaptations of the liver lobule manifest at specific cut-offs of steatosis. Sci. Rep. 7,
40977 (2017).
28. Moudgil K and Narang B. The liver and biliary system New Delhi: Prentice-Hall of India; 2006.
29. Kuntz, E. & Kuntz, H. Morphology of the liver (Springer Medizin Verlag, 2008).
30. Crawford, J. M. & Lui, C. Liver and biliary tract (Saunders Elsevier, 2010).
31. Teutsch, H. F. The modular microarchitecture of human liver. Hepatology 42, 317–325 (2005).
32. Teutsch, H. F., Schuerfeld, D. & Groezinger, E. Three-dimensional reconstruction of parenchymal units in the liver of the rat.
Hepatology 29, 494–505 (1999).
33. Ying, S., Xu, G., Li, C. P. & Mao, Z. Y. Point cluster analysis using a 3D voronoi diagram with applications in point cloud segmenta-
tion. Isprs Int. Geo-Inf. 4, 1480–1499 (2015).
Author contributions
Study concept and design: R.K.M., C.L., B.K., and R.P.G. Critical appraisal and technical support: S.L.N., K.P.B.,
L.D.F., and R.P.G. Writing the manuscript: R.K.M. and C.L.; editing: R.K.M., C.L., B.K., R.P.G., S.L.N., K.P.B.,
and L.D.F. Mathematical concepts: B.K. and C.L. Computer science/algorithms: C.L.
Funding
Mayo Clinic Anatomic Pathology.
Competing interests
The authors declare no competing interests.
Additional information
Supplementary Information The online version contains supplementary material available at https://doi.org/
10.1038/s41598-021-88699-2.
Correspondence and requests for materials should be addressed to R.K.M.
Reprints and permissions information is available at www.nature.com/reprints.
Publisher’s note Springer Nature remains neutral with regard to jurisdictional claims in published maps and
institutional affiliations.
Open Access This article is licensed under a Creative Commons Attribution 4.0 International
License, which permits use, sharing, adaptation, distribution and reproduction in any medium or
format, as long as you give appropriate credit to the original author(s) and the source, provide a link to the
Creative Commons licence, and indicate if changes were made. The images or other third party material in this
article are included in the article’s Creative Commons licence, unless indicated otherwise in a credit line to the
material. If material is not included in the article’s Creative Commons licence and your intended use is not
permitted by statutory regulation or exceeds the permitted use, you will need to obtain permission directly from
the copyright holder. To view a copy of this licence, visit http://creativecommons.org/licenses/by/4.0/.
© The Author(s) 2021
Scientific Reports | (2021) 11:9343 | https://doi.org/10.1038/s41598-021-88699-2 11
Vol.:(0123456789)You can also read