Tuning Curves for Approximate Numerosity in the Human Intraparietal Sulcus
←
→
Page content transcription
If your browser does not render page correctly, please read the page content below
Neuron, Vol. 44, 547–555, October 28, 2004, Copyright 2004 by Cell Press
Tuning Curves for Approximate Numerosity
in the Human Intraparietal Sulcus
Manuela Piazza,1 Véronique Izard,1 are distributed on a logarithmic scale, thus permitting
Philippe Pinel,1 Denis Le Bihan,2 a wide range of quantities to be encoded with a small
and Stanislas Dehaene1,* population of cells. This compressive property implies
1
Unité INSERM 562 “Cognitive Neuroimaging” an increasingly coarser encoding of larger numbers.
2
Unité de Neuroimagerie Anatomo-Fonctionnelle Thus, it can explain the behavioral observation that, as
Service Hospitalier Frédéric Joliot the numbers increase, it takes a proportionally larger
CEA/DSV difference between them for discrimination performance
91401 Orsay Cedex to remain at a constant level (Weber’s law).
France Recently, this model received support when neurons
tuned to numerical quantity were identified in the ma-
caque prefrontal and parietal cortex (Nieder and Miller,
Summary 2003, 2004; Sawamura et al., 2002). In macaques trained
in a numerical match-to-sample task with sets of one
Number, like color or movement, is a basic property to five visual objects, each of these quantities activated
of the environment. Recently, single neurons tuned to a preferred population of cells, with tuning curves that
number have been observed in animals. We used both exhibited a Gaussian shape with a fixed width when
psychophysics and neuroimaging to examine whether plotted on a logarithmic scale. It is tempting to speculate
a similar neural coding scheme is present in humans. that similar cells implement the human neural code for
When participants viewed sets of items with a variable number. Indeed, the number sense hypothesis (De-
number, the bilateral intraparietal sulci responded se- haene, 1997) proposes that we share with many animal
lectively to number change. Functionally, the shape of species a representation of approximate number, which
this response indicates that humans, like other animal initially reacts only to nonsymbolic displays such as sets
species, encode approximate number on a com-
of objects and later becomes linked to symbols such
pressed internal scale. Anatomically, the intraparietal
as Arabic digits and number words. We therefore at-
site coding for number in humans is compatible with
tempted to demonstrate a functional and anatomical
that observed in macaque monkeys. Our results there-
parallel between the human and monkey codes for num-
fore suggest an evolutionary basis for human elemen-
ber, through a combination of behavioral and functional
tary arithmetic.
magnetic resonance imaging (fMRI) methods.
Our stimuli were sets of visual shapes varying in num-
Introduction
ber, similar to those used in the monkey, but which have
not yet been used in human neuroimaging. Behaviorally,
Whenever we engage in calculation, the left and right
we tested whether the human ability to discriminate two
intraparietal regions of the brain are systematically acti-
vated (Dehaene et al., 2003, 1999; Eger et al., 2003; Lee, such sets based on their number followed Weber’s law.
2000; Naccache and Dehaene, 2001; Pesenti et al., 2000; In fMRI, we tested the hypothesis that the left and right
Pinel et al., 2001, 2004; Simon et al., 2002). For instance, intraparietal sulci encode the numerical quantity of sets
when we select which of two Arabic digits is larger, the of objects, at the same anatomical location that is known
intraparietal sulcus activates in direct proportion to the to respond during manipulation of Arabic digits. To
difficulty of the comparison, which varies with the dis- probe the format of the human neuronal representation
tance between the numbers (Pinel et al., 2001, 2004). of numerical quantity, we used fMRI adaptation (Grill-
Because Arabic, spelled-out, and spoken numerals all Spector and Malach, 2001; Naccache and Dehaene,
activate this area (Eger et al., 2003; Naccache and De- 2001), a method inspired by single-neuron electrophysi-
haene, 2001; Pinel et al., 2001), it is thought to be in- ological studies in primates (Desimone, 1996; Miller et
volved in cross-modal, abstract representation and ma- al., 1993). During an fMRI block, we repeatedly pre-
nipulation of the quantity meaning of numbers, rather sented a specific number, n1, in order to habituate puta-
than any specific number notation. tive neurons tuned to this value. We reasoned that pre-
How is an abstract semantic dimension such as nu- senting an occasional deviant number, n2, should then
merical quantity encoded at the neural level? A neural lead to a recovery of fMRI responses, with an amount
network model (Dehaene and Changeux, 1993) pro- of activation inversely related to the n1–n2 distance (see
poses that number can be represented cortically by a Figure 1 for examples of stimuli used). A mathematical
population of neurons, each coarsely tuned to a pre- model of this idea (presented as Supplemental Data at
ferred quantity. The coarse tuning implies that the closer http://www.neuron.org/cgi/content /f ull/44/3/547/
two numbers are, the more similar are the coding DC1/) predicted that both behavioral performance and
schemes of their neuronal populations. It thus explains brain activation should follow Weber’s law: the detection
why numerical distance is a major determiner of number of number change should scale with the habituation
comparison performance. Furthermore, the model as- number, such that doubling its value (from 16 to 32)
sumes that the preferred numbers for different neurons should result in a doubling of the change detection
threshold. Equivalently, the results should depend solely
*Correspondence: dehaene@shfj.cea.fr on the ratio of the two numbers.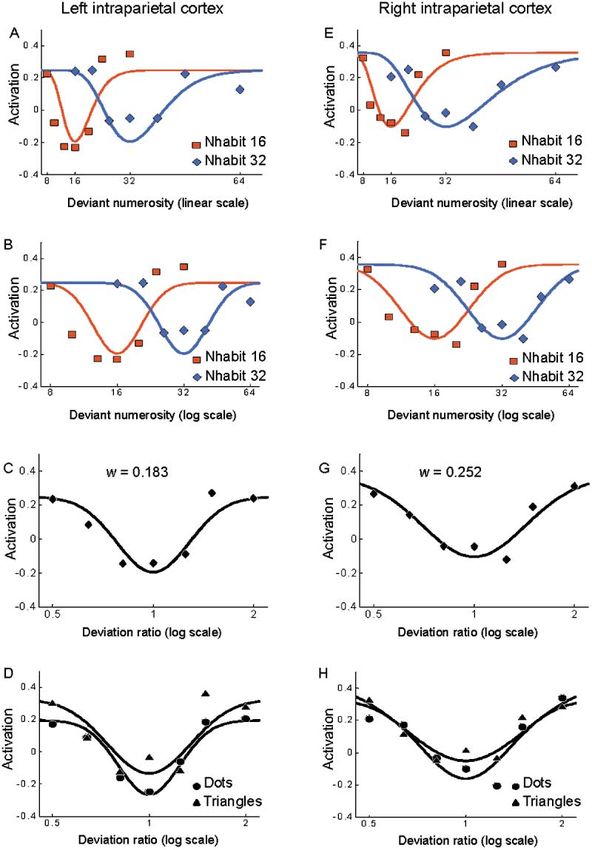
Neuron
548

Figure 1. Experimental Design for Adaptation to Approximate Number
Twelve human participants were scanned while they were passively presented with a rapid stream of sets of dots. Unbeknownst to the
participants, item shape and number occasionally changed, while all other nonnumerical visuospatial variables, such as dot density or location,
were carefully controlled, so that response to number change could not be attributed to any nonnumerical visuospatial parameter. The item
shape change control enabled us to rule out the possibility of a generic attentional reaction to any type of change. We predicted that number-
related areas would show only a main effect of number change and that a distinct set of regions would react to item shape change.

Results and Discussion                                                     44/3/547/DC1/), which accounted for 98.8% of variance
                                                                           and yielded an estimate of the internal Weber fraction
We first examined behavior in an explicit number change                    w ⫽ 0.170.
detection task, where participants were asked to detect                       We confirmed those results in a second forced-choice
whether the last set in a series of four had a deviant                     task, which required subjects to decide if the fourth set
number (Figures 2A–2C). Performance varied signifi-                        was larger or smaller than the preceding ones (Figures
cantly with distance between the habituation and the                       2E–2G). Comparison performance followed a classic
deviant number [F(6, 42) ⫽ 106.3; p ⬍ 0.0001]. The pro-                    sigmoid curve, with a slope twice as large for habituation
portion of “different” responses followed a classical                      32 than for habituation 16 (Figure 2E). Although targets
U-shaped function that characterizes approximate per-                      were now distributed regularly around the reference
ceptual judgments. The shape of this curve conformed                       value, performance was again asymmetrical and better
precisely to the behavioral predictions of our com-                        fitted by the integral of a Gaussian on a log scale than
pressed number line model. When plotted on a linear                        on a linear scale (r2 ⫾ 1 SD ⫽ 88.0% ⫾ 4.1% versus
scale for number, the performance curves were asym-                        94.9% ⫾ 2.4%; t(7 d.f.) ⫽ 6.23; p ⫽ 0.0004). The log-
metrical and twice as broad for habituation number 32                      Gaussian model accounted for 99.7% of variance and
than for habituation number 16 (Figure 2A). However,                       gave a value of the internal Weber fraction that was very
the curves became symmetrical and Gaussian with a                          close to that obtained in the first task (w ⫽ 0.174). This
fixed width when plotted on a log scale (Figure 2B).                       value is also consistent with previous psychophysical
Indeed, the curves for 16 and 32 became superimpos-                        investigations of numerosity judgments in human adults
able once expressed as a function of the log ratio of the                  (Cordes et al., 2001; van Oeffelen and Vos, 1982; Whalen
target and habituation numerosities, in agreement with                     et al., 1999).
Weber’s law (Figure 2C). Nonlinear fitting with either a                      The average curves from both tasks were centered
Gaussian or a log-Gaussian function was used to com-                       on the habituation number, suggesting that participants
pare the linear and logarithmic models quantitatively. In                  could extract accurate numerical information in spite of
all participants, a better goodness of fit was obtained                    changes in item size, density, and layout between the
with the log model (r2 ⫾ 1 SD across participants ⫽                        habituation and deviant images. Changes in item shape,
70.5% ⫾ 11.3% versus 90.9% ⫾ 5.6%; t(7 d.f.) ⫽ 7.23;                       however, did have a modest impact on numerical perfor-
p ⬍ 0.0001). The data were well fitted by the maximum                      mance. In the same-different task, small sets of triangles
likelihood decision model that is described in the Sup-                    were judged to be numerically identical to the habitua-
plemental Data (http://www.neuron.org/cgi/content/full/                    tion displays more frequently than large sets, while no
Tuning Curves for Numerosity in the Human Brain
549

                                                                                 Figure 2. Behavioral Results from Same-Dif-
                                                                                 ferent and Larger-Smaller Tasks
                                                                                 Graphs in the left column represent the pro-
                                                                                 portion of trials in which participants re-
                                                                                 sponded that the final set differed in number
                                                                                 from the habituation sets. Graphs in the right
                                                                                 column represent the proportion of trials in
                                                                                 which participants responded that the final
                                                                                 set was more numerous than the habituation
                                                                                 sets. In both cases, performance is plotted
                                                                                 as a function of the amount of numerical devi-
                                                                                 ation. Performance curves assume a skewed
                                                                                 shape when number is plotted on a linear
                                                                                 scale (A and E) but become symmetrical on
                                                                                 a logarithmic scale (B and F) and depend
                                                                                 solely on the logarithm of the ratio of the two
                                                                                 numbers (C and G). Performance was slightly
                                                                                 affected by an irrelevant change in target
                                                                                 shape (D and H). The fitted curves are derived
                                                                                 from the equations that are described in the
                                                                                 Supplemental Data at http://www.neuron.
                                                                                 org/cgi/content/full/44/3/547/DC1/.

such bias was present for sets of dots (Figure 2D) [main      subjects were estimating numerical quantity rather than
effect of item shape, F(1, 7) ⫽ 12.70, p ⫽ 0.009; item        any alternative physical variable.
shape by distance interaction, F(6, 42) ⫽ 3.38, p ⫽ 0.008].      During fMRI, participants were passively exposed to
In the larger-smaller task, likewise, subjects responded      habituation and deviant sets. In a whole-brain search,
“larger” more often when the target set was made of           the only regions that responded proportionally to numer-
triangles than when it was made of dots [item shape,          ical distance were localized in the left and right intrapa-
F(1,7) ⫽ 18.81, p ⫽ 0.003]. Both effects could be ac-         rietal sulci (see Table 1 and Figure 3). Importantly, there
counted for by a small (5%–7%) overestimation of the          was little overlap of those number-related regions with
number of triangles compared to dots, perhaps because         those that responded to item shape change. Only 17
the triangles appeared slightly bigger. However, no such      right-parietal voxels were shared, representing, respec-
difference was found when the triangles appeared as           tively, 13% and 4% of the number- and shape-related
habituation sets [F(1,7) ⫽ 1.60; p ⫽ 0.25], even if an item   activations. Item shape change activated the right and
shape by distance interaction was present [F(7, 49) ⫽         left prefrontal cortex, anterior cingulate cortex, and right
5.43; p ⫽ 0.0001], presumably because the same habitu-        parietal cortex at a site lateral to the activation evoked
ation number was presented many times within a block,         by number change (see Table 2 and Figure 5). The left
both as triangles and as dots. Crucially, in spite of this    lateral occipito-temporal cortex, which was reported in
bias, the best-fitting Weber fraction was unchanged           previous studies of adaptation to a single shape (Grill-
across conditions (range 0.162–0.175), suggesting that        Spector et al., 1998; Kourtzi and Kanwisher, 2001), also
Neuron
550
Table 1. Regions Responding to Deviations in Number Table 2. Regions Responding to Deviations in Item Shape
Corrected p Corrected p
Cortical Region x y z (Cluster) Cortical Region x y z (Cluster)
Left IPS ⫺36 ⫺60 52 0.006 Left prefrontal ⫺48 28 12 0.003
⫺28 ⫺68 48 ⫺28 24 28
⫺28 ⫺56 44 ⫺40 24 24
Right IPS 28 ⫺56 52 0.008 Right prefrontal 48 8 36 0.000
28 ⫺40 40 48 8 12
16 ⫺56 44 20 32 24
24 ⫺58 52 Anterior cingulate ⫺8 12 56 0.004
4 28 32
⫺4 8 44
Right parietal 44 ⫺52 44 0.000
showed a marginal shape change effect (corrected 24 ⫺48 40
p ⫽ 0.07). 32 ⫺52 52
The most anterior parietal voxels responsive to num- Lateral occipital ⫺40 ⫺60 ⫺4 0.070
ber change, especially in the right hemisphere, coin- ⫺52 ⫺60 ⫺4
⫺60 ⫺56 ⫺8
cided with the horizontal intraparietal sulcus (hIPS) site
common to many arithmetic tasks (Dehaene et al., 2003),
including number comparison (Naccache and Dehaene,
2001; Pesenti et al., 2000; Pinel et al., 2001, 2004), sub- The depth of the intraparietal sulcus where number-
traction (Lee, 2000; Simon et al., 2002), approximation related activation was observed occupies a reproduc-
(Dehaene et al., 1999), or mere detection of numerals ible location relative to other landmarks that might corre-
(Eger et al., 2003). Here, we show that these regions spond to monkey areas LIP and AIP (Simon et al., 2002)
respond to the nonsymbolic “numerosity” dimension of and may constitute a putative homolog of the deep ven-
sets of physical objects. It is often argued that the pari- tral intraparietal area where number-responsive neurons
etal activation observed during number processing may are found in the macaque monkey (Nieder and Miller,
result from the greater difficulty of arithmetic tasks rela- 2004). Interestingly, in the monkey performing a delayed
tive to the baseline chosen. However, this argument match-to-sample task, number-coding neurons are also
cannot apply to the present data, which are based on observed in prefrontal cortex. However, the parietal neu-
a habituation protocol in which subjects did not have rons have a shorter firing latency than the frontal ones
to explicitly respond to the stimuli and were not engaged (about 100 versus 160 ms) (Nieder and Miller, 2004).
in any effortful task. Activation related to number change This difference is compatible with the hypothesis that
also extended posteriorly in the IPS, reflecting either a numerosity is first extracted in the IPS and later transmit-
sparse and distributed coding of numerosity along the ted to prefrontal cortex as needed for the requested
IPS (Pinel et al., 2004; Nieder and Miller, 2004) or the task. Our experiment did not involve any explicit working
additional engagement of attention-orientating mecha- memory demands, which may explain why number-
nisms that might have followed the detection of numero- related activation was not found at corrected levels of
sity changes in the display (Dehaene et al., 2003). significance in prefrontal cortex, but only in the intrapa-
rietal region, where number representation is faster and
more automatic. Note, however, that at a lower threshold
(clusterwise p ⬍ 0.01 uncorrected for multiple compari-
sons), number-related activation was also observed in
right posterior premotor (coordinates 36, 0, 32) and dor-
solateral prefrontal cortex (48, 32, 16).
In the absence of further data on the geometrical and
cytoarchitectonic organization of this region in both spe-
cies, the proposed anatomical homology between the
human and monkey parietal representations of numero-
sity must remain speculative. However, the present data
allow us to ascertain whether detailed functional paral-
lels in the parietal coding schemes for number are pres-
ent across the two species. To study whether numerical
responses in the human IPS followed the predictions of
the compressive tuning curves of the macaque neurons,
we isolated, for each subject, within the two IPS regions
identified by the group analysis, the voxel where the
largest fMRI response to numerical novelty was found.
We then plotted activation in these voxels as a function
of experimental conditions in the same format as the
Figure 3. Brain Regions that Respond to Number Change psychophysical curves (Figure 4). Although noisier than
Brain regions that responded to number change superimposed on behavioral curves, the brain activation responses to ha-
axial (top left) and coronal (top right) anatomical images of one bituation numerosities 16 and 32 showed the character-
subject, and on a standard 3D render of the cortex (bottom). istic features of Weber’s law. The curves had an increas-Tuning Curves for Numerosity in the Human Brain
551
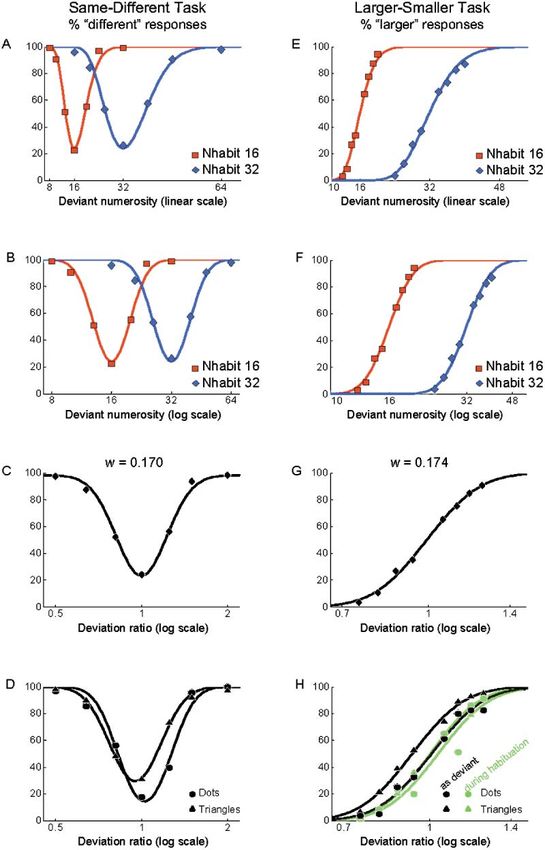
Figure 4. Parietal Responses to Number
Change
Same organization as Figure 2. Deviant sets
elicit an activation that increases with the
amount of number change (A and B). Activa-
tion curves are a Gaussian function of the log
ratio of the two numbers (C), with only minimal
influence of item shape change (D). Activation
is expressed as percent change in BOLD sig-
nal and is relative to the ongoing level of acti-
vation elicited by the continuous stream of
habituation displays. Hence, the negative val-
ues when the deviant and habituation values
match (ratio ⫽ 1) indicate continued BOLD
habituation.
ing width on a linear number scale (Figure 4A), became stimuli 16 and 32, as a function of whether they were
identical in width when plotted on a log scale (Figure presented in blocks with habituation 16 or 32. We ob-
3B), and could be expressed as a simple Gaussian func- served highly significant interactions of deviant number
tion of log ratio (Figure 3C). However, single-subject by habituation number [left parietal, F(1, 11) ⫽ 14.390,
data were too noisy for individual nonlinear curve fitting, p ⬍ 0.001; right parietal, F(1, 11) ⫽ 15.196, p ⬍ 0.001].
and the group data were fitted about equally well by a log As predicted, there was a lower fMRI signal when the
and by a linear Gaussian function of ratio (right parietal deviant number matched the habituation number than
cortex, respectively, r2 ⫽ 0.770 versus 0.597; left parietal when the two numbers differed. Those interactions can-
cortex, r2 ⫽ 0.649 versus 0.706). not be explained by a sensitivity to item size or spacing,
Importantly, in those numerosity-sensitive regions, no which were matched across the habituation sets, nor to
influence of item shape change was perceptible (Figure total luminance or occupied area, which were matched
4D). This was confirmed statistically by submitting the across the deviant sets (see the Supplemental Data at
data to an analysis of variance (ANOVA) with factors of http://www.neuron.org/cgi/content/full/44/3/547/
habituation number (16 or 32), number deviation ratio DC1/). The fact that fMRI responses to deviants reached
(7 levels), and item shape change (dots, no shape a minimum precisely at the number that was used during
change; or triangles, shape change). Only the main effect habituation, although very different physical parameters
of number deviation reached significance (p ⬍ 0.0001), were used to generate the habituation and deviant stim-
which was expected because we used it to select the uli, can only be explained by a genuine sensitivity to
fMRI peaks. To further demonstrate that number, rather numerical change in the underlying neural population.
than any other physical parameter, was responsible for Activation profiles in shape-sensitive regions (left and
fMRI signal recovery in the intraparietal sulcus, we per- right prefrontal, lateral occipital, anterior cingulate, and
formed an ANOVA on fMRI signals to the same deviant right parietal) differed radically from those of numero-Neuron 552 Figure 5. Responses to Item Shape Change Activation in those regions was not significantly influenced by number change (horizontal axis) but depended solely on the presence of a change in item shape (triangles versus dots). sity-sensitive regions (Figure 5), in that they showed a in excellent agreement with our behavioral results (w ⫽ main effect of item shape change in the absence of a 0.17). Interestingly, the Weber fraction tended to be main effect of number change. The anterior cingulate larger for the right intraparietal region (w ⫽ 0.25), al- and right parietal regions also showed a small interac- though this difference did not reach significance. Further tion of item shape, deviation, and number (p ⬍ 0.01), research should probe whether there is a differential which could be explained by a decreasing sensitivity to precision of number coding in the two hemispheres, item shape changes for increasingly larger numbers, perhaps due to interactions with an exact verbal code for presumably because the individual shapes became number within the language-dominant left hemisphere smaller and therefore less discriminable. Previous habit- (Dehaene, 1997). uation studies have revealed a coding of shape in the Other mechanisms may also contribute to the ob- lateral occipital complex (Grill-Spector et al., 1998; Kour- served finer sensitivity in behavior than in fMRI. For tzi and Kanwisher, 2001). The observation of additional instance, participants attended to numerical quantity in parietal, prefrontal, and cingulate regions in our para- the behavioral experiments but not during fMRI. Behav- digm may indicate an attentional or novelty reaction to ioral performance might also achieve a higher sensitivity the rare changes in item shape. The absence of similar than single neurons through averaging over indepen- additional responses to number fitted with the partici- dent neurons, or through selection of a small neuronal pants’ introspective reports that changes in item shape subpopulation with high sensitivity (Parker and New- were obvious, while changes in numerical quantity were some, 1998). Eventually, experiments with awake mon- rare and inconspicuous. keys will be needed to test more directly the proposed Our design enabled a direct comparison of behavioral link between neuronal tuning curves and fMRI adap- and fMRI responses to the same changes in numerical tation. quantity. Interestingly, parietal activation profiles as a While the important gap between human fMRI and function of log numerical ratio tended to be broader monkey electrophysiological recordings must be kept than behavioral profiles (compare Figures 2C, 3C, and in mind, the present results exhibit important parallels 3G). This observation was expected in our mathematical with the physiological recordings of number neurons in model, because the fMRI habituation signals reflect the the monkey parietal and frontal regions (Nieder et al., combined influence of the habituated neural population 2002; Nieder and Miller, 2003, 2004). Both human and and the activity evoked by the deviant target. Mathemat- monkey data yield tuning profiles that (1) depend only ically, this effect is equivalent to a convolution operation. on number independently of other parameters such as Hence, the fMRI curves should have a width scaled up shape, density, or spatial arrangement; (2) are smooth by 公2 relative to the actual neuronal Weber fraction. and monotonic in response to increasing degrees of With this simple correction, the fMRI curves yielded a deviation in number; (3) are increasingly broader when Weber fraction w ⫽ 0.18 for the left intraparietal region, plotted on a linear scale (Weber’s law); (4) can be ex-
Tuning Curves for Numerosity in the Human Brain
553

pressed as a simple Gaussian function of log number                  (Edinburgh Inventory) and had normal or corrected-to-normal vision.
ratio. This functional homology, together with the com-              The study was approved by the regional ethical committee (Hopital
                                                                     de Bicêtre, France).
patible anatomical localization, suggests that humans
                                                                     Procedure
and macaque monkeys have similar populations of intra-               Stimuli were presented for 150 ms, white against a black back-
parietal number-sensitive neurons. It provides important             ground, at a constant rate of one every 1200 ms. The majority were
support for the notion that all humans start in life with            sets of dots with a fixed number. Occasionally, a deviant set oc-
a nonverbal representation of approximate number in-                 curred randomly, with the constraint that two successive deviants
herited from our evolutionary history, as also supported             were separated by at least 3 and at most 11 habituation stimuli.
                                                                     Stimuli could deviate by a variable ratio (1.25, 1.5, or 2) from the
by studies in human adults (Barth et al., 2003; Cordes
                                                                     habituation number, in both the larger or smaller direction, or they
et al., 2001; Whalen et al., 1999), infants (Lipton and              could be equinumerous to the habituation number. Furthermore,
Spelke, 2003), nonhuman primates (Brannon and Ter-                   items in the deviant sets could be of the same shape (circles) or
race, 1998; Hauser et al., 2003), and human genetic                  different shape (triangles) than the habituation sets, thus defining
diseases (Molko et al., 2003). Our work leaves open                  orthogonal shape change and number change factors (see Figure 1).
the exact biological mechanisms by which numerical                      The experiment was divided in four blocks. Each block consisted
quantity is extracted. In our experiments, strict controls           of 384 stimuli, of which one-eighth were deviant. Two different habit-
                                                                     uation numbers were presented in counterbalanced blocks: 16 (with
over nonnumerical parameters ensured that neither the
                                                                     deviants 8, 10, 13, 16, 20, 24, and 32) and 32 (with deviants 16, 21,
behavioral nor the parietal responses to numerical devi-             26, 32, 40, 48, and 64). Each block started with the presentation
ation could be explained by any simple physical factor               of a small centered yellow fixation cross, which remained visible
other than number. Still, it is possible that participants           throughout. Accurate fixation was controlled using a MR-compatible
were using combinations of physical parameters to esti-              eye tracker (ASL 5000 LRO system; Applied Science Laboratories,
mate number, for instance by estimating the ratio of                 Bedford, MA).
                                                                        To avoid decision and response confounds, fMRI participants
total luminance by individual item luminance or of total
                                                                     were simply instructed to fixate and to pay attention to the stimuli.
occupied area by the square of the average interitem                 They were not informed of the aim of the experiment or told to focus
spacing (Allik and Tuulmets, 1991). Parietal maps for                on any specific dimension of the stimuli but were told that the
object location, once normalized for object size and                 experimenter would later ask them questions about the displays.
identity, can also be summed to yield an estimate of                 During informal questioning at the end, all participants spontane-
number (Dehaene and Changeux, 1993).                                 ously reported noticing the changes in objects’ shape as well as
   Finally, while humans and macaques may share a                    details of their size, spacing, and configuration. The changes in
                                                                     number tended to be less conspicuous, as they were mostly re-
principle of compressed number coding, there may be
                                                                     ported only after explicit questioning.
interesting species differences in the precision of this             Stimuli
code. At the neural level, our results are not incompatible          Stimuli were designed so that, aside from the number change, all
with monkey physiology, since we found Weber frac-                   deviant stimuli were equally novel with respect to all physical param-
tions of 0.18 in left parietal and 0.24 in right parietal            eters. Total luminance and total occupied area (extensive parame-
cortex, while Nieder and Miller (2003) observed a value              ters) were equated across the deviant stimuli (see Supplemental
                                                                     Figure S1 at http://www.neuron.org/cgi/content/full/44/3/547/DC1/).
of 0.24 in macaque neurons. Behaviorally, however, we
                                                                     This means that larger deviant numbers had on average smaller
observed a Weber fraction of about 0.17, in line with                individual item sizes and smaller interitem spacing. However, the
other psychophysical studies of human numerosity                     latter parameters (intensive parameters) were varied randomly and
judgments (Cordes et al., 2001; Whalen et al., 1999) but             equated on average across the habituation stimuli: habituation stim-
about twice better than the value of 0.35 reported by                uli were generated randomly, with item size and interitem spacing
Nieder and Miller (2003) for numerosity discrimination               values drawn randomly from fixed distributions that spanned all the
in macaque monkeys (for compatible data, see also                    range of values used for the deviant stimuli. As a result, all of the
                                                                     parameter values that occurred in the deviants had already been
Brannon and Terrace, 1998; Hauser et al., 2003). Such
                                                                     presented equally often during habituation and were equally non-
comparisons must be made cautiously, because the                     novel. Therefore, the only novel aspect of the deviant stimuli was
Weber fractions are measured using different experi-                 number. An automated program generated random configurations
mental methods. Nevertheless, they consistently sug-                 within those constraints, so that stimuli were never repeated identi-
gest a higher precision in humans than in other primates.            cally during the experiment. The use of large numbers further pre-
The Weber fraction is also known to vary considerably                vented any possibility of using pattern recognition as a cue.
                                                                     fMRI Parameters
in humans within the first year of life: 6-month-old infants
                                                                     The experiment was performed on a 3T fMRI system (Bruker, Ger-
discriminate numbers in a 2:1 ratio (e.g., 8 versus 16),             many). Functional images sensitive to blood oxygen level-depen-
but only 9-month-olds are able to discriminate numbers               dent contrast were obtained with a T2*-weighted gradient echo-
in a 3:2 ratio (e.g., 8 versus 12) (Lipton and Spelke,               planar imaging sequence (repetition time [TR] ⫽ 2.4 s; echo time
2003). Prolonged brain maturation, greater experience                [TE] ⫽ 40 ms; angle ⫽ 90⬚; field of vision [FOV] ⫽ 192 ⫻ 256 mm;
with numerical quantity, and training with symbolic                  matrix ⫽ 64 ⫻ 64). The whole brain was acquired in 26 slices with
                                                                     a slice thickness of 4.5 mm. High-resolution images (3D gradient
codes may account for the increased precision of nu-
                                                                     echo inversion-recovery sequence; inversion time [TI] ⫽ 700 mm;
merical coding in humans. The present work provides                  TR ⫽ 2400 ms; FOV ⫽ 192 ⫻ 256 ⫻ 256 mm; matrix ⫽ 256 ⫻ 128 ⫻
a set of methods with which to track ontogenetic and                 256; slice thickness ⫽ 1 mm) were also acquired.
phylogenetic changes in this important parameter of                  Image Processing and Statistical Analysis
numerical cognition.                                                 Data were analyzed with SPM99 (http://www.fil.ion.ucl.ac.uk/spm/).
                                                                     The first 4 volumes were discarded. All other volumes were realigned
Experimental Procedures                                              using the first volume as reference, then normalized to the standard
                                                                     template of the Montreal Neurological Institute using an affine trans-
fMRI Experiment                                                      formation, spatially smoothed (6 mm), and low-pass (4 s) and high-
Participants                                                         pass (140 s) filtered. Activations were modeled by a linear com-
Twelve healthy human adults (mean age 23) participated in the fMRI   bination of eight functions derived by convolution of the standard
study after giving written informed consent. All were right handed   hemodynamic function with the known onsets of the different types
Neuron
554
of deviants. Time derivatives were added to capture variance in Barth, H., Kanwisher, N., and Spelke, E. (2003). The construction of
activation timing. Random effect analyses were then applied to two large number representations in adults. Cognition 86, 201–221.
contrasts: main effect of item shape change and linear effect of Brannon, E.M., and Terrace, H.S. (1998). Ordering of the numerosi-
deviation ratio. Data are reported at p ⬍ 0.05 corrected for multiple ties 1 to 9 by monkeys. Science 282, 746–749.
comparisons at the cluster level, p ⬍ 0.01 at the voxel level.
Cordes, S., Gelman, R., Gallistel, C.R., and Whalen, J. (2001). Vari-
ability signatures distinguish verbal from nonverbal counting for
Psychophysical Experiments both large and small numbers. Psychon. Bull. Rev. 8, 698–707.
Same-Different Judgment Dehaene, S. (1997). The Number Sense (New York: Oxford Univer-
Eight healthy human adults participated (mean age 29). After a fixa- sity Press).
tion cross appeared for 1050 ms, stimuli were presented at the same
Dehaene, S., and Changeux, J.P. (1993). Development of elementary
rate as in fMRI, but now in short series of four. The first three
numerical abilities: A neuronal model. J. Cogn. Neurosci. 5, 390–407.
were habituation stimuli containing either 16 or 32 dots (in different
blocks) and were taken randomly from the set of habituation stimuli Dehaene, S., Spelke, E., Pinel, P., Stanescu, R., and Tsivkin, S.
used in the fMRI experiment. The fourth stimulus was a deviant (1999). Sources of mathematical thinking: behavioral and brain-
identical to those used in the fMRI experiment. Immediately after, imaging evidence. Science 284, 970–974.
a question mark appeared and remained on the screen until the Dehaene, S., Piazza, M., Pinel, P., and Cohen, L. (2003). Three pari-
subject had pressed one of two keys to decide whether the number etal circuits for number processing. Cogn. Neuropsychol. 20,
of items had changed. Visual feedback was provided for 1500 ms 487–506.
(the word “correct” or “incorrect”). The participants were told that Desimone, R. (1996). Neural mechanisms for visual memory and
in 75% of trials the number would be different and that they had to their role in attention. Proc. Natl. Acad. Sci. USA 93, 13494–13499.
disregard changes in item shape. The experiment comprised four
Eger, E., Sterzer, P., Russ, M.O., Giraud, A.L., and Kleinschmidt, A.
counterbalanced blocks of 48 trials each.
(2003). A supramodal number representation in human intraparietal
Larger-Smaller Judgment
cortex. Neuron 37, 719–725.
Eight healthy human adults participated (mean age 26). On each
trial, a series of four sets was presented, three with the same number Grill-Spector, K., and Malach, R. (2001). fMR-adaptation: a tool for
of items (16 or 32, fixed in a given block) and a fourth with a different studying the functional properties of human cortical neurons. Acta
number of items. Participants judged whether the last set had a Psychol. (Amst.) 107, 293–321.
larger or smaller number of items than the preceding ones. This Grill-Spector, K., Kushnir, T., Edelman, S., Itzchak, Y., and Malach,
forced-choice task presented the advantage of eliminating the re- R. (1998). Cue-invariant activation in object-related areas of the
sponse criterion inherent in the same-different task and allowing a human occipital lobe. Neuron 21, 191–202.
fit of the data with a single free parameter w (the internal Weber Hauser, M.D., Tsao, F., Garcia, P., and Spelke, E. (2003). Evolutionary
fraction). Because performance was predicted to be better than that foundations of number: spontaneous representation of numerical
for same-different judgments (see the mathematical model in the magnitudes by cotton-top tamarins. Proc. R. Soc. Lond. B Biol. Sci.
Supplemental Data at http://www.neuron.org/cgi/content/full/44/3/ 270, 1441–1446.
547/DC1/), we selected target numbers closer to the reference value,
Kourtzi, Z., and Kanwisher, N. (2001). Representation of perceived
namely 12, 13, 14, 15, 17, 18, 19, and 20 when the reference was
object shape by the human lateral occipital complex. Science
16 and twice those amounts when the reference was 32. The distri-
293, 1506–1509.
bution of targets was symmetrical around the reference, thus re-
sponding to a possible criticism of the previous experiment, in which Lee, K.M. (2000). Cortical areas differentially involved in multiplica-
performance asymmetries might conceivably have been induced by tion and subtraction: A functional magnetic resonance imaging
the logarithmic distribution of targets. study and correlation with a case of selective acalculia. Ann. Neurol.
The experiment comprised 8 blocks of 40 trials each (four with 48, 657–661.
reference 16 and four with reference 32, in counterbalanced order). Lipton, J., and Spelke, E. (2003). Origins of number sense: Large
Timing, stimulus generation, and feedback were identical to the number discrimination in human infants. Psychol. Sci. 14, 396–401.
same-different task. On half the trials, the first three displays were Miller, E.K., Li, L., and Desimone, R. (1993). Activity of neurons in
generated using the parameters of fMRI habituation displays, and anterior inferior temporal cortex during a short-term memory task.
the fourth was generated using the parameters of fMRI deviant J. Neurosci. 13, 1460–1478.
displays. On the other half, this order was reversed. This manipula-
Molko, N., Cachia, A., Riviere, D., Mangin, J.F., Bruandet, M., Le
tion allowed the examination of the effect of nonnumerical variables
Bihan, D., Cohen, L., and Dehaene, S. (2003). Functional and struc-
on performance, since target number was correlated with different
tural alterations of the intraparietal sulcus in a developmental dys-
variables in the two sets (item size and interitem spacing in the first
calculia of genetic origin. Neuron 40, 847–858.
set, total luminance and total occupied area in the second set). The
similarity of performance and Weber fraction estimates in the two Naccache, L., and Dehaene, S. (2001). The priming method: Imaging
sets (Figure 2H), at least for dot patterns, supports our hypothesis unconscious repetition priming reveals an abstract representation
that participants attended to number rather to other physical param- of number in the parietal lobes. Cereb. Cortex 11, 966–974.
eters. Nieder, A., and Miller, E.K. (2003). Coding of cognitive magnitude.
Compressed scaling of numerical information in the primate prefron-
Acknowledgments tal cortex. Neuron 37, 149–157.
Nieder, A., and Miller, E.K. (2004). A parieto-frontal network for visual
Supported by INSERM; CEA; a Marie Curie fellowship of the Euro- numerical information in the monkey. Proc. Natl. Acad. Sci. USA
pean Community (QLK6-CT-2002-51635) (M.P.); and a McDonnell 101, 7457–7462.
Foundation centennial fellowship (S.D.). Nieder, A., Freedman, D.J., and Miller, E.K. (2002). Representation
of the quantity of visual items in the primate prefrontal cortex. Sci-
Received: July 9, 2004 ence 297, 1708–1711.
Revised: September 1, 2004 Parker, A.J., and Newsome, W.T. (1998). Sense and the single neu-
Accepted: September 27, 2004 ron: Probing the physiology of perception. Annu. Rev. Neurosci.
Published: October 27, 2004 21, 227–277.
Pesenti, M., Thioux, M., Seron, X., and De Volder, A. (2000). Neuroan-
References atomical substrates of Arabic number processing, numerical com-
parison, and simple addition: A PET study. J. Cogn. Neurosci. 12,
Allik, J., and Tuulmets, T. (1991). Occupancy model of perceived 461–479.
numerosity. Percept. Psychophys. 49, 303–314. Pinel, P., Dehaene, S., Riviere, D., and LeBihan, D. (2001). ModulationTuning Curves for Numerosity in the Human Brain 555 of parietal activation by semantic distance in a number comparison task. Neuroimage 14, 1013–1026. Pinel, P., Piazza, M., Le Bihan, D., and Dehaene, S. (2004). Distrib- uted and overlapping cerebral representations of number, size, and luminance during comparative judgments. Neuron 41, 983–993. Sawamura, H., Shima, K., and Tanji, J. (2002). Numerical representa- tion for action in the parietal cortex of the monkey. Nature 415, 918–922. Simon, O., Mangin, J.F., Cohen, L., Le Bihan, D., and Dehaene, S. (2002). Topographical layout of hand, eye, calculation, and lan- guage-related areas in the human parietal lobe. Neuron 33, 475–487. van Oeffelen, M.P., and Vos, P.G. (1982). A probabilistic model for the discrimination of visual number. Percept. Psychophys. 32, 163–170. Whalen, J., Gallistel, C.R., and Gelman, R. (1999). Non-verbal count- ing in humans: The psychophysics of number representation. Psy- chol. Sci. 10, 130–137.
You can also read