Transcriptomic-Proteomic Correlation in the Predation-Evoked Venom of the Cone Snail, Conus imperialis - MDPI
←
→
Page content transcription
If your browser does not render page correctly, please read the page content below
marine drugs
Article
Transcriptomic-Proteomic Correlation in the
Predation-Evoked Venom of the Cone Snail,
Conus imperialis
Ai-Hua Jin 1,† , Sébastien Dutertre 2,† , Mriga Dutt 1 , Vincent Lavergne 3 , Alun Jones 1 ,
Richard J. Lewis 1 and Paul F. Alewood 1, *
 1   Institute for Molecular Bioscience, The University of Queensland, St Lucia, QLD 4072, Australia;
     a.jin@imb.uq.edu.au (A.-H.J.); m.dutt@uq.edu.au (M.D.); a.jones@imb.uq.edu.au (A.J.);
     r.lewis@imb.uq.edu.au (R.J.L.)
 2   Institut des Biomolécules Max Mousseron, Département des acides amines, Peptides et Protéines,
     Unité Mixte de Recherche 5247, Université Montpellier 2—Centre Nationale de la Recherche Scientifique,
     Place Eugène Bataillon, 34095 Montpellier CEDEX 5, France; sebastien.dutertre@umontpellier.fr
 3   Léon Bérard Cancer Center, 28 rue Laennec, 69008 Lyon, France; vincent.lavergne@protonmail.com
 *   Correspondence: p.alewood@imb.uq.edu.au; Tel.: +61-7-3346-2982; Fax: +61-7-3346-2101
 †   These authors contributed equally to this work.

 Received: 5 February 2019; Accepted: 14 March 2019; Published: 19 March 2019

 Abstract: Individual variation in animal venom has been linked to geographical location, feeding
 habit, season, size, and gender. Uniquely, cone snails possess the remarkable ability to change venom
 composition in response to predatory or defensive stimuli. To date, correlations between the venom
 gland transcriptome and proteome within and between individual cone snails have not been reported.
 In this study, we use 454 pyrosequencing and mass spectrometry to decipher the transcriptomes and
 proteomes of the venom gland and corresponding predation-evoked venom of two specimens of
 Conus imperialis. Transcriptomic analyses revealed 17 conotoxin gene superfamilies common to both
 animals, including 5 novel superfamilies and two novel cysteine frameworks. While highly expressed
 transcripts were common to both specimens, variation of moderately and weakly expressed precursor
 sequences was surprisingly diverse, with one specimen expressing two unique gene superfamilies and
 consistently producing more paralogs within each conotoxin gene superfamily. Using a quantitative
 labelling method, conotoxin variability was compared quantitatively, with highly expressed peptides
 showing a strong correlation between transcription and translation, whereas peptides expressed at
 lower levels showed a poor correlation. These results suggest that major transcripts are subject to
 stabilizing selection, while minor transcripts are subject to diversifying selection.

 Keywords: conopeptide; conotoxin; mass spectrometry; venom transcriptome; 454 sequencing;
 iTRAQ; proteomics; transcriptomics; cone snail venom; Conus imperialis

1. Introduction
     Venom variation has been described for secretions produced by various venomous animals,
such as cone snails [1], scorpions [2,3], snakes [4,5], spiders [6,7], fire ants [8], and parasitic wasps [9].
The contributing factors leading to such variation comprise geographical location, feeding habits,
season, size, and gender [7,10–13]. Cone snails are marine molluscs that produce complex venom
to defend against predators and to capture prey [14]. Over the last decades, the occurrence of
individual variation of the dissected and injected venoms of cone snails has been well documented
using proteomic approaches [15,16]. Further complexity was added when we discovered that cone
snails possess a remarkable ability to inject venoms with differing components in response to predatory

Mar. Drugs 2019, 17, 177; doi:10.3390/md17030177                           www.mdpi.com/journal/marinedrugs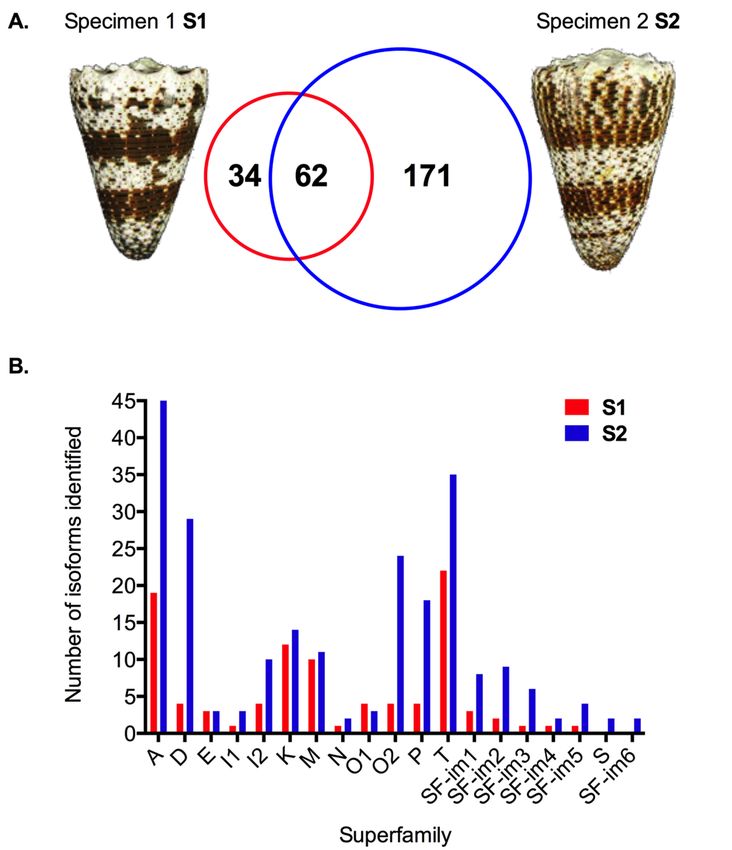
Mar. Drugs 2019, 17, 177                                                                          2 of 16

or defensive stimuli [17]. To date, such variation has only been examined at the whole venom gland
by proteomics approaches [15,16], whereas modulation of mRNA transcripts in the venom gland has
not been investigated as a contributor to toxin variability. While evidence for a direct link between
mRNA levels in the venom gland and peptide levels in the venom has not been demonstrated, it is
generally accepted that mRNA abundance grossly correlates with protein concentrations (correlation
coefficient ranging between 0.4 to 0.6) and combinations of post-transcriptional and post-translational
regulations have been invoked to account for the remaining ~50% observed variation [18]. With the
advent of high throughput sequencing technology and improvement in the sensitivity and throughput
of mass spectrometry, we can now directly address these issues. Recently, using an integrated venomics
approach, we revealed the occurrence of transcriptomic messiness and variable peptide processing in
various cone snail species that may contribute to the venom variation [19].
     In this study, we compare, for the first time, transcriptomic and proteomic venom expression
profiles of two adult Conus imperialis specimens, collected from the same location. C. imperialis is
a worm-hunting species that feeds exclusively on a group of polychaete marine worms known as
“fireworms” (Amphinomidae). Significant toxin variation was revealed at the transcriptomic sequence
level with broad overlap between superfamilies and frameworks. Although variation was observed at
both mRNA and peptide levels, a core of highly transcribed toxins was consistently detected in the
injected venoms of both specimens. Interestingly, sequences with high cDNA read levels correlated
well with the levels of peptides translated, whereas sequences with low level reads did not.

2. Results

2.1. Transcriptomic and Bioinformatic Data Analysis
     The 454 pyrosequencing run on the Roche GS FLX Titanium sequencer (1/4 of a plate equivalent
for each of the two specimens of C. imperialis) generated 220,516 (Specimen 1, S1) and 332,390 (Specimen
2, S2) cDNA reads after trimming and removal of low-quality sequences. Newbler and Trinity
assembled de-multiplexed read sequences that produced contigs with consistent length ranges, N50,
N75, and N90 values (Supplementary Table S3). The average length after assembly was not much
different compared to the raw reads, e.g., the trimmed raw reads average length ~390 bp, after the
Trinity assembly ~480 bp, and after Newbler assembly 430–460 bp.
     Sorting and classification into gene superfamilies of the raw cDNA reads was performed using
ConoSorter [20]. After motif searching using parameters generated from the ConoServer database [21],
a total of 267 unique conopeptide precursors were retrieved, including 96 from the specimen S1 and
233 from specimen S2, with 62 overlapping (Figure 1A and Supplementary Table S1). Assembled data
sets were also subjected to the same conotoxin sequence analysis, however, the number of conopeptide
sequences identified from the assembled contigs with ConoSorter remained low compared to the direct
analysis of the cDNA reads. From the 62 common sequences initially retrieved from the cDNA read
datasets of both specimens, only 15 (Newbler) and 18 (Trinity) presented after the assembly. Whereas
the low expressed sequences have been eliminated during the assembly as expected, it was quite
surprising that some highly expressed sequences were absent after the assembly (Supplementary
Table S4). Indeed, most algorithms are designed to reduce substitutions, deletions, and insertions
events, which, in the case of hypervariable genes such as conotoxins, will likely eliminate some minor
yet important true biological variations [22]. Comparison of conopeptide sequences measured at
the cDNA level allows for a clear distinction between high and low levels of expressed transcripts.
Therefore, this work from now on was carried out using the reads, not contigs, as the short sequences
of conotoxin precursors (70–100 a.a. on average) have been proven fully covered by most 454 reads
(average length 390 bp).
     Using a 75% signal peptide sequence identity cut-off [23,24], 17 superfamilies were found in
both specimens and 2 superfamilies (S and putative SF-im6) were identified only in S2 (Table 1 and
Figure 1B).
Mar. Drugs 2019, 17, 177                                                                                           3 of 16
 Mar. Drugs 2019, 17, x                                                                                              3 of 18

           Table
         Table 1. 1. Representative
                  Representative    signal
                                  signal   sequence
                                         sequence   and
                                                  and   cysteine
                                                      cysteine    framework
                                                               framework forfor
                                                                             C. C. imperialis
                                                                                imperialis    superfamilies.
                                                                                           superfamilies.
   Gene Superfamily 1 1                 Signal Sequence                         Cysteine Patterns           Framework
    Gene Superfamily                    Signal Sequence                         Cysteine Patterns       Framework
            A                    MGMRMMFTVFLLVVLATAVLP                               CC-C-C                        I
            DA                    MGMRMMFTVFLLVVLATAVLP
                                  MPKLEMMLLVLLILPLCYIDA                              CC-C-C
                                                                              C-C-C-CC-C-C-C-C-C              I Novel
             ED                   MPKLEMMLLVLLILPLCYIDA
                                    MMMRVFIAMFFLLALVEA                        C-C-C-CC-C-C-C-C-C
                                                                                C-C-C-C-C-C-C-C            Novel XXII
            I1 E                    MMMRVFIAMFFLLALVEA
                                    MKLALTFLLILMILPLMTG                        C-C-C-C-C-C-C-C
                                                                                 C-C-CC-CC-C-C              XXII XI
            I2I1                    MKLALTFLLILMILPLMTG
                                  MFRVTSVLLVIVLLNLVVLTNA                        C-C-CC-CC-C-C
                                                                                 C-C-CC-CC-C-C               XI XI
            K I2                  MFRVTSVLLVIVLLNLVVLTNA
                                 MIMRMTLTLFVLVVMTAASASG                         C-C-CC-CC-C-C
                                                                                   C-C-C-CC-C                XIXXIII
            MK                   MIMRMTLTLFVLVVMTAASASG
                                   MMSTLVVLLTICLLMLPLTA                           C-C-C-CC-C
                                                                                   CC-C-C-CC               XXIIIIII
            NM                     MMSTLVVLLTICLLMLPLTA
                                  MSTLGMMLLILLLLVPLATFA                           CC-C-C-CC
                                                                               C-C-CC-CC-C-C-C-C             IIINovel
           O1
               N                  MSTLGMMLLILLLLVPLATFA
                                  MKLRCMMIVAVLFLTASIFITA
                                                                              C-C-CC-CC-C-C-C-C
                                                                                   C-C-CC-C-C
                                                                                                           NovelVI/VII
              O1                  MKLRCMMIVAVLFLTASIFITA                          C-C-CC-C-C               VI/VII
           O2                       MKLTILLLVAALLVLTQA                             C-C-CC-C-C                   VI/VII
              O2                     MKLTILLLVAALLVLTQA                           C-C-CC-C-C               VI/VII
             P                 MHLSLASSAALMLLLLFALGNFVGVQP                         C-C-C-C-C-C                    IX
               P               MHLSLASSAALMLLLLFALGNFVGVQP                        C-C-C-C-C-C                IX
             T                      MRCLPVVVFLLLLLSAAA                                CC-CC                       V
               T                    MRCLPVVVFLLLLLSAAA                               CC-CC                   V
         SF-im1                    MARFLSILLCFAMATGLAAG                                C-C                         -
           SF-im1                  MARFLSILLCFAMATGLAAG                                C-C                    -
         SF-im2                 MRLTTMHSVILMLLLVFAFDNVDG                         C-C-C-C-C-C-CC                 Novel
           SF-im2               MRLTTMHSVILMLLLVFAFDNVDG                        C-C-C-C-C-C-CC             Novel
         SF-im3                    MSKSGMLLFVLLLLLPLAIP                        C-CC-C-CC-C-C-C-C                  XX
           SF-im3                  MSKSGMLLFVLLLLLPLAIP                       C-CC-C-CC-C-C-C-C              XX
         SF-im4
           SF-im4                MKFFTCLLLLLVVLTVVFDNVDA
                                 MKFFTCLLLLLVVLTVVFDNVDA                           C-C-C-CC-C
                                                                                  C-C-C-CC-C               XXIIIXXIII
         SF-im5
           SF-im5                  MKTGMIICLLLIAFMDADG
                                   MKTGMIICLLLIAFMDADG                             C-C-CC-C-C
                                                                                  C-C-CC-C-C                    VI/VII
                                                                                                           VI/VII
          S (S2)
            S (S2)                 MMLKMGAMFAILLLFALSSS
                                   MMLKMGAMFAILLLFALSSS                         C-C-C-C-C-C-C-C
                                                                               C-C-C-C-C-C-C-C              VIIIVIII
      SF-im6
        SF-im6 (S2)
                 (S2)            MGVFRCCLAAALVVVCLSRMGG
                                 MGVFRCCLAAALVVVCLSRMGG                              C-C-C-C
                                                                                    C-C-C-C                 XIVXIV
        1 The top 17 superfamilies were found in both specimens and the bottom 2 superfamilies (S and putative SF-im6)
     1 The  top 17 superfamilies were found in both specimens and the bottom 2 superfamilies (S and putative SF-im6)
     were identified
       were          only
            identified    in specimen
                       only           2, S2.
                             in specimen 2, S2.

     Figure 1. Venom duct transcriptomes of two specimens of C. imperialis. (A) Variation in the number of
       Figure 1. Venom duct transcriptomes of two specimens of C. imperialis. (A) Variation in the number
     transcripts. (B) Paralogs of known superfamilies and putative new superfamilies. Color codes: red
       of transcripts. (B) Paralogs of known superfamilies and putative new superfamilies. Color codes: red
     (Specimen 1, S1) and blue (Specimen 2, S2).
       (Specimen 1, S1) and blue (Specimen 2, S2).
     Among the 17 common gene superfamilies, 12 were already described (i.e., A, D, E, I1, I2, K, M, N,
       Among the 17 common gene superfamilies, 12 were already described (i.e., A, D, E, I1, I2, K, M,
O1, O2, P and T) and five were novel (coded SF-im1-5). The signal peptides and cysteine frameworks
  N, O1, O2, P and T) and five were novel (coded SF-im1-5). The signal peptides and cysteine
of the superfamilies are listed in Table 1. SF-im1 is not closely related to any known superfamily
  frameworks of the superfamilies are listed in Table 1. SF-im1 is not closely related to any known
(45% M sequence identity) and contains only two cysteine residues in the predicted mature region.
  superfamily (45% M sequence identity) and contains only two cysteine residues in the predicted
  mature region. Both SF-im2 and SF-im5 are related to superfamily O3 (56% and 54% sequence
Mar. Drugs 2019, 17, 177 4 of 16
Both SF-im2 and SF-im5 are related to superfamily O3 (56% and 54% sequence identity, respectively),
though they appear clearly different from each other. Superfamily SF-im3 is related to superfamily D
(56%) and SF-im4 is related to superfamily I2 (58%). In addition, superfamily S was uniquely found in
specimen 2, along with another new superfamily (SF-im6, 40% I3). Overall, the six most abundant
superfamilies in the venom of C. imperialis are A, D, T, I2, O2, and K. The total number of paralogs and
cDNA reads for each superfamily are listed and compared in Table 2.
Table 2. The total number of paralogs and cDNA reads for each superfamily in individual specimen.
Gene Superfamily Total Reads Total Paralogs Common Paralogs
A 5826 52 15
D 2421 29 4
E 204 3 3
I1 55 3 1
I2 1426 10 4
K 1032 22 6
M 498 17 4
N 34 2 1
O1 76 6 1
O2 1038 25 3
P 400 18 4
S 19 2 0
T 2166 46 11
SF-im1 85 10 1
SF-im2 81 10 1
SF-im3 73 6 1
SF-im4 37 2 1
SF-im5 25 4 1
SF-im6 11 2 0
2.2. Transcriptomic Intraspecific Variation
Striking variation was observed at the transcriptomic level. Indeed, many more paralogs were
found for almost every superfamily in S2 than in S1 (Figure 1B). Further, specimen S2 produced more
than 1.5 times as many cDNA reads as that of S1. Whereas the top 2–3 ranking paralogs within each
superfamily (based on read frequency) appear remarkably conserved between the two individuals,
there are some notable exceptions. First, there are cases where the ranking order for the lowest to
the most highly expressed sequence is changed, as follows: Within the superfamily M, the 2nd (41
reads), 3rd (19), and 4th (5) most highly expressed paralogs in S1, become the 3rd (25), 2nd (43),
and 5th (5) in S2, respectively (Supplementary Table S1). More striking, some well-known sequences
(e.g., α-conotoxin ImI [25] and Lys conopressin-G [26]), though present within S2 at low abundance
(1 read), are undetectable in S1. In fact, from the well-characterized conotoxins in C. imperialis venom,
only ImIIA is found to be abundant in these two specimens (>200 reads). The PCR amplified product
α-conotoxin ImII [27], on the other hand, is missing in both individuals.
2.3. Proteomic Intraspecific Variation
The predation-evoked venoms of the two same specimens of C. imperialis were collected 3 days
prior to mRNA extraction and analyzed using standard LC-ESI-MS and the mass lists were extracted
and compared using dedicated bioinformatic tools. When overlaid, the TIC profiles appear grossly
similar between individuals (Figure 2A) due to the presence of ~10–15 abundant peptides (Figure 2B).
However, when all extracted masses are taken into consideration, there is only 30%–50% overlap
between these two animals (232 masses) (Figure 2A). Interestingly, although the venom gland
transcriptome of S2 generated more sequences, it produced less complex predation-evoked venom
than S1 (476 masses versus 645 masses).Mar. Drugs 2019, 17, 177 5 of 16
Mar. Drugs 2019, 17, x 5 of 18
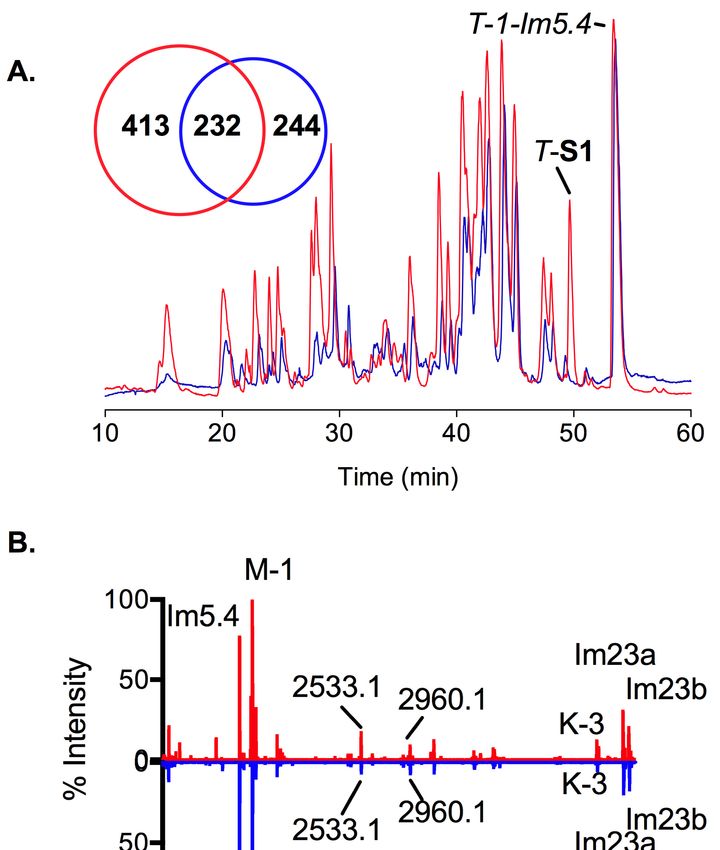
Figure 2. 2.Predation-evoked
Figure injectedvenoms
Predation-evoked injected venomsofofboth
bothC. C. imperialis
imperialis specimens.
specimens. (A) Overlaid
(A) Overlaid LC-MSLC-MS
profiles of the two specimens. The diagram illustrates the number of masses detected per
profiles of the two specimens. The diagram illustrates the number of masses detected per specimen. specimen.
T-S1
T-S1 and
and T-1-Im5.4ininspecimen
T-1-Im5.4 specimen11 are
are labeled
labeled on
ontop.
top.(B)
(B)AAnormalized
normalized figure based
figure on the
based on intensity
the intensity of
of the detected masses. Color codes: red (Specimen 1, S1) and blue (Specimen
the detected masses. Color codes: red (Specimen 1, S1) and blue (Specimen 2, S2). 2, S2).
2.4.2.3. Proteomic Intraspecific
Transcription Variation
and Translation
To The predation-evoked
determine venoms of the
if the relationship two same
between specimens ofand
transcription C. imperialis werecontributed
translation collected 3 days
to venom
prior to mRNA extraction and analyzed using standard LC-ESI-MS and the mass lists were extracted
variation, the T superfamily was analyzed in detail, as it provided a convenient case study. Indeed,
and compared using dedicated bioinformatic tools. When overlaid, the TIC profiles appear grossly
the precursor of ImVC (T-S1), the second most highly expressed superfamily T peptide (1570.66 Da;
similar between individuals (Figure 2A) due to the presence of ~10–15 abundant peptides (Figure
FLNTICCWSRACCG-NH
2B). However, when all2 ),extracted
was found in the
masses arevenom
taken gland transcriptomethere
into consideration, of S1,is but
onlynot in S2, and this
30%–50%
peptide was
overlap relatively
between theseabundant in the
two animals (232predation-evoked
masses) (Figure 2A).venom of S1 butalthough
Interestingly, remarkably absent from
the venom
thegland
corresponding venom
transcriptome of S2ofgenerated
S2. Quantitatively, the transcriptomic
more sequences, it produced lessratio between
complex ImVC and the most
predation-evoked
highly expressed
venom superfamily
than S1 (476 T peptide
masses versus (Im5.4) is 1:12 and the peptide precursor intensity ratio is 1:4,
645 masses).
with the difference of the ratio for tandem mass spectrometry (MSMS) identification likely due to the
2.4. Transcription
stronger ionizationand Translation
of an arginine residue instead of a glycine at position 10 (see Table 3).
To determine if the relationship between transcription and translation contributed to venom
Correlation
Table 3. the
variation, of twowas
T superfamily conopeptides between
analyzed in detail, mRNA and peptide
as it provided levels within
a convenient the same
case study. animal
Indeed,
the precursor1,of
(specimen ImVC (T-S1), the second most highly expressed superfamily T peptide (1570.66 Da;
S1).
FLNTICCWSRACCG-NH2), was found in the venom gland transcriptome of S1, but not in S2, and
cDNA Reads MSMS Precursor Intensity
this
Namepeptide was relatively
Mature Peptideabundant
Sequencein the predation-evoked venom of S1 but remarkably absent
Full Precursor Mature Peptide RM
from the corresponding venom of S2. Quantitatively, the transcriptomic ratio between Only ImVCRM and
and the
Digested
most
T_S1 highly expressed
(ImVC) FLNTICCWSR 1
superfamily T peptide
ACCG-NH (Im5.4)
41 is 1:12 and the
137peptide precursor
1839217 intensity22,290
ratio
2
T_1_Im5.4 FLNTICCWSGACCG-NH2 491 1297 7,744,866 1,248,633
Ratio 12 9 4 56
1 Arginine in position 10 is in red.Mar. Drugs 2019, 17, 177 6 of 16
2.5. Correlation between mRNA and Peptide Levels
To quantitatively determine the relationship between mRNA and peptide levels, we employed
an iTRAQ labelling proteomic strategy involving tandem LC-ESI-MSMS to compare the relative
abundance of conotoxins versus their cDNA read number. The injected venom was reduced and
alkylated prior to tryptic digestion [28] and 8-plex labelled samples were pooled and analyzed.
A control run without iTRAQ labelling was analyzed for each of the milked samples with or without
alkylation and tryptic digestion. Figure 3 shows the comparison of the ratio of iTRAQ-detected
conopeptides (peptide level) and the number of cDNA reads (mRNA level) between the two animals.
In general, highly expressed peptides show a good correlation between mRNA and peptide level
abundance, whereas peptides expressed at low levels do not. Further details relating to the conotoxin
precursors, mature peptides, and cysteine frameworks are given below.
2.6. Representative Conotoxin Precursors, Mature Peptides, and Cysteine Frameworks by Gene Superfamily
2.6.1. Superfamily A
The number of cDNA reads and conotoxin variants were most abundant in this superfamily,
with a total of 5826 cDNA reads and 52 paralogs identified. A_1 and A_2 (Table 4) were the two most
abundant sequences, which both contained only a single cysteine residue in their sequences and likely
represent a new pharmacological class. Surprisingly, despite their high read number neither peptide
was found in the proteome. In contrast, one typical α-conotoxin (A_3, known as ImIIA/Bn1.3) was
identified with the classic framework I (CC-C-C). MSMS identified A_3 (ImIIA) in the venom with
a common amidated C-termini and one hydroxyproline (Supplementary Table S2).
2.6.2. Superfamily D
Superfamily D had a total 2421 cDNA reads and 29 paralogs were identified. The highly abundant
D_1 (Table 4) had previously been observed in the venom of C. litteratus (cDNA work, Lt15.5) [21]
and was highly expressed in both specimens (438 reads, S1 and 1856 reads, S2). The predicted mature
peptide had a unique framework (C-C-C-CC-C-C-C-C-C) that differed from other D-superfamily
members with framework XX (C-CC-C-CC-C-C-C-C) [29]. MSMS analysis confidently identified D_1
after tryptic digestion. The ratio of peptide intensity (S1:S2 = 1:4.8) correlated well with the ratio of
mRNA (S1:S2 = 1:4.2) between the two specimens (Figure 3A).Mar. Drugs 2019, 17, 177 7 of 16
Table 4. Representative conotoxin precursors, mature peptides and cysteine frameworks. The predicted mature peptides are in bold. Cysteine frameworks are
highlighted in orange. Sequences have been published in NCBI database (GenBank KT377395-KT377426).
Name Seq No. Precursor Sequence
A_1 im001 MGMRMMFTVFLLVVLATTVVPITLASATDGRNAAADARMSPLISKFKK-DYCHKYGYTIG
A_2 im002 MGMRMMFTVFLLVVLATTVVPITLASATDGRNAAANARVSPVISKFSKK-WCHPNPYTVG
A_3_Bn1.3 im003 MGMRMMFTVFLLVVLATAVLPVTLDRASDGRNAAANAKTPRLIAPFIRDYCCHRGPCMVWCG
D_1_Lt15.5 im004 MPKLEMMLLVLLILPLCYIDAVGPPPPWNMEDEIIEHWQKLHCHEISDLTPWILCSPEPLCGGKGCCAQEVCDCSGPVCTCPPCL
E_1 im005 MMMRVFIAMFFLLALVEAGWPRLYDKNCKKNILRTYCSNKICGEATKNTNGELQCTMYCRCANGCFRGQYIDWPNQQTNLLFC
I1_1 im006 MKLALTFLLILMILPLMTGEKTSDDLELRGVESLRAIFRDRRCSDNIGATCSDRFDCCGSMCCIGGQCVVTFAECS
I2_1 im007 MFRVTSV–LLVIV-LLNLVVLTNACHMD—CSKMT-CCSGICCFY-CGRPMCPGTRRALLQRLVGHQR
I2_2 im008 MFRLTSVGCILLVIAFLNLVGLTNACTSEGYSCSSDSNCCKNVCCWNVCESH-CRHPGKRTRLQGFFKHRR
K_1_Im23b im009 MIMRMTLTLFVLVVMTAASASGDALTEAKRIPYCGQTGAECYSWCIKQDLSKDWCCDFVKTIARLPPAHICSQ
K_2_Im23a im010 MIMRMTLTLFVLVVMTAASASGDALTEAKRIPYCGQTGAECYSWCIKQDLSKDWCCDFVKDIRMNPPADKCP
K_3 im011 MIMRMTLTLFVLVVMTAASASGDALTEAKRVPYCGQTGAECYSWCKEQHLIR–CCDFVKYVGMNPPADKCR
M_1 im012 MMSTLVVLLTICLLMLPLTARQLDADQLADQLAERMEDISADQNRWFDPVKRCCMRPICM—–CP-CCVNG
M_2_Eu3.3 im013 MMSKLGVLLAICLLMLPLTALPLDGDQPQER—KEDGKSAALQPWFDPVKRCCQAA-CSPWL–CLPCCG
M_3_Bt3.1 im014 MMSTLGVLLTIGLLLFPLTALPLDGDQPADQPAERLQDISPKEIPGSDPFKRCCHAPYCTPPHLGC-PCCGK
M_4 im015 MSKVGVVPLIFLVLLSIAALQNGDDPRRQRDEKQSPQGDILRSTLTKYSYNIQRRCWAGGSPCHLCSSSQVCIAPTGHPAIMCGRCVPILT
N_1 im016 MSTLGMMLLILLLLVPLATFADDGPTMRGHRSAKLLAHTTRDSCPSGTNCPSKICCNGNCCSKSSCRCETNQATKERVCVC
O1_1_Conotoxin3 im017 MKLRCMMIVAVLFLTASIFITADNSRNGIENLPRMRRHEMKKPKASKLNKRGCLPDEYFCGFSMIGALLCCSGWCLGICMT
O2_1_im6.2 im018 MKLTILLLVAALLVLTQARTERRRVKSRKTSSTYDDEMATFCWSYWNEFQYSYPYTYVQPCLTLGKACTTNSDCCSKYCNTKMCKINWEG
O2_3 im019 MEKLTILLLVTAVLMSTQALMQSGIEKRQRAKIKFFSKRKTTAER———-WWEGECYDWLRQCSSPAQCCSGNCGAH-CKAW
P_1 im020 MHLSLASSAALMLLLLFALGNFVGVQPGQIRDLNKGQLKDNRRNLQSQRKQMSLLKSLHDRNG-CNGNTCSNSP-CPNNCY-CDTEDD—CHPDRREH
P_2 im021 MHLSTASSVALMFFLLFAFYGVQPELMTRDVDNGQLTDNRRNLRSRVKPTGLFKSRK–PSED-C-GKTCETAENCPDDCSSCLSVEGTYRCA
P_3 im022 MHRSLAGSAVLMLLLLFALGNFVGVQPGLVTRDADNGQLMDNRRNLRLERKTMSLFKSLDKRADCSTY-CFGMGICQSGCY-CGPGHA—CMPNGR
T_1_Im5.4 im023 MRCLPVVVFLLLLLSAAAAPGVGSKTERLPGLTSSGDSDESLP—FLNTICCWSGA-CCGG
T_2 im024 MCCIPVFFILLLLIPSAPSILAQPTTKGDVALASSYDDAKRTLQRLSIKYSCCPGIVSCCVIP
SF-im1_1 im025 MARFLSILLCFAMATGLAAGIRYPDRVLGRCSTHDLSKMEIDTNLDGVYSPHRSFCTCGSGEVYFTAKDRRNHSNYRVYVCGMPTEFCTAENPVRDP
SF-im2_1 im026 MRLTTMHSVILMLLLVFAFDNVDGDEPGQTARDVDNRNFMSILRSEGKPVHFLRAIKKRDCTGQACTTGDNCPSECVCNEHHFCTGKCCYFLHA
SF-im3_1 im027 MSKSGMLLFVLLLLLPLAIPELAPAGRSVTHHFRDFGAKRSVPISCVNPSTPNLQGSWQDKKCCSTKLCSPTNCCESSTCSCVEGSCQCL
SF-im4_1 im028 MKFFTCLLLLLVVLTVVFDNVDACDRSCTGVMGHPSCATCCACFTSAGKRHADGQHSRMKVRTGAKNLLKRMPLH
SF-im5_1 im029 MKTGMIICLLLIAFMDADGSPGDTLYSQKTADTDSGMKRFQKTFQKRRCVFCPKEPCCDGDQCMTAPGTGPFCG
S_1 im030 MMLKMGAMFAILLLFALSSSQQEGDVQARKIRLRNDFLRTSRMIFTRGCGGSCHTSPGCGGNCECNSPVPCYCSGTETCVCVCSG
SF-im6_1 im031 MGVFRCCLAAALVVVCLSRMGGTEPLESNHEDERRADDTSGDDCVDTNEDCVNWASTGQCEANPSYMRENCRKabundant D_1 (Table 4) had previously been observed in the venom of C. litteratus (cDNA work,
Lt15.5) [21] and was highly expressed in both specimens (438 reads, S1 and 1856 reads, S2). The
predicted mature peptide had a unique framework (C-C-C-CC-C-C-C-C-C) that differed from other
D-superfamily members with framework XX (C-CC-C-CC-C-C-C-C) [29]. MSMS analysis
confidently identified D_1 after tryptic digestion. The ratio of peptide intensity (S1:S2 = 1:4.8)
Mar. Drugs 2019, 17, 177 8 of 16
correlated well with the ratio of mRNA (S1:S2 = 1:4.2) between the two specimens (Figure 3A).
2.6.3.
2.6.3. Superfamily
Superfamily E E
Superfamily
Superfamily E, recently
E, recently identified
identified in C.
in C. marmoreus
marmoreus at very
at very lowlow abundance
abundance [23],
[23], waswas found
found to be
to be
relatively
relatively abundant
abundant in in
thethe venom
venom of of
C. C. imperialis,
imperialis, with
with a total
a total of of
204204 reads
reads andand 3 paralogs
3 paralogs identified.
identified.
Interestingly, E_1 (Table 4) contained no propeptide region and the mature peptide
Interestingly, E_1 (Table 4) contained no propeptide region and the mature peptide with framework with framework
XXII
XXII (C-C-C-C-C-C-C-C)
(C-C-C-C-C-C-C-C) waswas directly
directly cleaved
cleaved offoff
thethe signal
signal sequence
sequence after
after a SignalP
a SignalP predicted
predicted L--K
L–K
cleavage
cleavage site.
site. MSMS
MSMS analysis
analysis confirmed
confirmed this
this sequence
sequence at at
thethe peptide
peptide level.
level. TheThe ratio
ratio of of peptide
peptide
intensity
intensity (S1:S2
(S1:S2 = 1:2.0)
= 1:2.0) correlated
correlated well
well with
with thethe ratio
ratio of of
mRNAmRNA (S1:S2
(S1:S2 = 1:1.6)
= 1:1.6) between
between thethe
twotwo
specimens
specimens (Figure
(Figure 3A).
3A).
A. High level reads conopeptides B. Correlation between
6 transcriptome and proteome
I2 6
D
Peptide ratio (S2 : S1)
5
5 r2 = 0.9669
4
4
Ratio
3
K K E 3
2
M 2
1
1
0
0
b
5
K3
_1
_1
1
0 1 2 3 4 5 6
5.
23
E_
12
M
t1
Im
Transcripts ratio (S2 : S1)
_L
1_
_1
K_
D
C. D.
Low level reads conopeptides Correlation between
transcriptome and proteome
6 SF-im4 6
SF-im5
Peptide ratio (S2 : S1)
5 M I2 5
4 N 4
Ratio
3 3
2 2
1 1
0 0
0 1 2 3 4 5 6
_4
_1
_1
1
1
5_
4_
Transcripts ratio (S2 : S1)
I2
N
M
-im
-im
SF
SF
Figure 3. Correlation of mRNA and peptide. (A) Abundant conopeptides at mRNA and peptide
Figure
levels. 3. Correlation
(B) Highly expressed of peptides
mRNA and show peptide. (A) Abundant
a good correlation conopeptides
between mRNA levelat mRNA and level.
and peptide peptide
(C)levels. (B) Highly
Low level expressed
conopeptides peptides
of mRNAs andshow a good
peptides. (D)correlation between
Poor correlation mRNA level
for low-level and peptide
conopeptides.
level.
Color (C) Low
codes: blue level
(ratio conopeptides
of transcriptsofS2:S1)
mRNAsand and
blackpeptides.
(ratio of (D) Poor S2:S1).
peptides correlation for on
Labels low-level
top
conopeptides.
indicate Color codes: blue (ratio of transcripts S2:S1) and black (ratio of peptides S2:S1). Labels
superfamilies.
on top indicate superfamilies.
2.6.4. Superfamily I1
Mar. Drugs 2019, 17, x; doi:
The I1 superfamily had only 55 cDNA reads and 3 paralogs identified. Conopeptides from this
www.mdpi.com/journal/marinedrugs
superfamily have been found to induce an excitatory effect when injected into mice [30]. I1_1 (Table 4)
was transcribed in both specimens at relatively low levels (cDNA reads 6 and 28). The mature peptide
had 34 amino acids and 4 disulfide bonds (framework XI, C-C-CC-CC-C-C). MSMS showed that this
sequence was translated in both animals, although the ratio at peptide level (S1:S2 = 1:1.0) did not
correlate well with the cDNA level (S1:S2 = 1:4.7) (Figure 3B).Mar. Drugs 2019, 17, 177 9 of 16
2.6.5. Superfamily I2
Compared to the I1 superfamily, I2 was highly abundant with a total of 1426 cDNA reads and 10
paralogs identified. As expected for I2 members, the predicted mature peptides were placed between
the signal peptide and the propeptide regions. The cysteine framework was the same as in the I1
superfamily (XI, C-C-CC-CC-C-C). I2_1 (Table 4) was identified with 141 S1 and 740 S2 cDNA reads.
The ratio of peptide intensity (S1:S2 = 1:5.4) correlated well with the ratio of mRNA (S1:S2 = 1:5.2)
between the two specimens (Figure 3A). I2_2 was also identified at the peptide level (Supplementary
Table S2).
2.6.6. Superfamily K
The K superfamily has recently been characterized at the peptide level and the mature conotoxin
shows a double helical structure within framework XXIII (C-C-C-CC-C) [31]. The K superfamily
is abundant in the venom of C. imperialis, with a total of 1032 reads and 22 paralogs identified.
K_1 (known as Im23b) was identified with 155 S1 and 348 S2 cDNA reads. The ratio of peptide
intensity (S1:S2 = 1:2.0) correlated well with the ratio of mRNA (S1:S2 = 1:2.2) between the two
specimens (Figure 3A). K_2 (known as Im23a) was also identified at the proteomic level though no
correlation was determined as the sequence identified for quantitation overlaid with K_1. K_3 is
another relatively abundant paralog with 60 S1 and 109 S2 cDNA reads. The ratio of peptide intensity
(S1:S2 = 1:1.4) correlated well with the ratio of mRNA (S1:S2 = 1:1.8) between the two specimens
(Figure 3A).
2.6.7. Superfamily M
Superfamily M comprised a moderate proportion of total conotoxin transcripts, with a total of
498 cDNA reads and 16 paralogs identified. The most abundant, M_1(Table 4), was identified with
238 S1 and 343 S2 cDNA reads and it contained an obvious pre-sequence cleavage site (KR), resulting
in a short mature peptide of 14 amino acids and a cysteine framework III (CC-C-C-CC). The ratio of
peptide intensity (S1:S2 = 1:1.4) correlated well with the ratio of mRNA (S1:S2 = 1:1.4) between the two
specimens (Figure 3A). Two conopeptides M_2 (known as Eu3.3) and M_3 (known as Bt3.1) were also
identified in both transcriptomes. Although they had 20–40 cDNA reads, their mature sequences were
not detected in the milked venoms. M_4 contained an RR cleavage site and cysteine framework IX
(C-C-C-C-C-C) and was identified by only 2 S1 and 9 S2 cDNA reads. Although the mature sequence
for M_4 was confirmed by MSMS analysis of both specimens, the ratio at peptide level (S1:S2 = 1:1.9)
did not correlate well with the cDNA level (S1:S2 = 1:4.5) (Figure 3B).
2.6.8. Superfamily N
Superfamily N, first been discovered in C. marmoreus venom, was found in the venom of C.
imperialis in low abundance, with a total of 34 reads and 2 paralogs identified. N_1 was identified
with 16 S1 and 6 S2 cDNA reads and contained an L–R cleavage site. The predicted mature peptide
contained a novel framework (C-C-CC-CC-C-C-C-C). MSMS analysis indicated that this sequence was
translated in both specimens, although the ratio at peptide level (S1:S2 = 1:3.6) did not correlate with
the cDNA level (S1:S2 = 1:0.4) (Figure 3B).
2.6.9. Superfamily O1
Surprisingly, though O1 is one of the most widespread superfamily in cones and found in early
diverging taxa such as C. californicus [32], the number of cDNA reads and conotoxin variants were low
in both transcriptomes, with a total of only 76 cDNA reads and 6 paralogs found. O1_1 (known as
conotoxin-3) contained a pre-sequence cleavage site (KR), resulting in the predicted mature peptides
containing 30 amino acids and a Type VI/VII (C-C-CC-C-C) framework (Table 4). No MSMS evidence
was found for this sequence in the milked venom.Mar. Drugs 2019, 17, 177 10 of 16
2.6.10. Superfamily O2
Compared to O1, superfamily O2 was much more abundant with a total of 1038 reads and
25 paralogs found. No quantitation of peptide segments could be retrieved by iTRAQ from this
superfamily, although two paralogs O2_1 (known as Im6.2) and O2_3 with a VI/VII (C-C-CC-C-C)
framework were identified at the peptide level (Table 4, Supplementary Table S2).
2.6.11. Superfamily P
A total of 400 cDNA reads and 18 paralogs were identified for this superfamily. No quantitation
of peptide segments could be identified by iTRAQ from this superfamily. Although three paralogs
(P_1-P_3) (Table 4) were identified with a RK cleavage site and cysteine framework IX (C-C-C-C-C-C),
only P_3 was confidently identified at the peptide level by MSMS (Supplementary Table S2).
2.6.12. Superfamily S
Superfamily S was only found in S2 with total reads of 19 and 2 paralogs identified. Paralog S_1
(Table 4) contained a signal peptide with 80% sequence identity to the classic S superfamily. S_1 was
identified in S2 with moderate cDNA reads (S1, 0 and S2, 10) and contained a pre-sequence cleavage
site (R-R) that resulted in a predicted mature peptide of 37 amino acids and 4 disulfide bonds with
a Type VIII (C-C-C-C-C-C-C-C) framework. No MSMS evidence was found for this sequence in the
milked venom.
2.6.13. Superfamily T
Superfamily T was the third most abundant superfamily behind A and O2, with total reads of 2166
and 46 paralogs identified. Surprisingly given the high transcriptomic expression levels, iTRAQ was
unable to quantify this peptide. Paralogs T_1 (known as Im5.4) and T_2 both have an elongated
N-terminal tail and a classic T superfamily cysteine framework V (CC-CC). The sequence of T_1 was
identified confidently at the peptide level by MSMS (Supplementary Table S2).
2.6.14. Superfamily SF-im1
Whereas this novel signal peptide has some similarity to that of the superfamily M (45%
homologous), the mature sequences differ greatly with a different cysteine framework. The total
number of reads for this superfamily was 85 for the 10 paralogs identified. The full precursor of
SF-im1_1 was identified with 7 S1 and 25 S2 cDNA reads. The precursor was long and contained
a pre-sequence cleavage site (RR) and a post-cleavage site (KK), resulting in predicted mature peptides
of 27 amino acids containing only a single disulfide bond. The mature peptide was identified by MSMS
after tryptic digestion (Supplementary Table S2).
2.6.15. Superfamily SF-im2
This novel superfamily contained a signal peptide distantly related to the superfamily O3 (56%
sequence identity). The total reads for this superfamily were 81 with 10 paralogs identified. SF-im2_1
was identified with 494 S1 and 1027 S2 cDNA reads but could not be quantified by iTRAQ. It contained
a novel cysteine framework with 8 cysteine residues (C-C-C-C-C-C-CC) and predicted pre-cleavage
sites after KR that would generate mature peptides of 35 amino acids. The mature peptide was
validated by MSMS after tryptic digestion (Supplementary Table S2).
2.6.16. Superfamily SF-im3
This superfamily contained a signal peptide, with 56% sequence identity to the D superfamily,
that was distinct from SF-im1 and SF-im2 signal peptides and their corresponding cysteine frameworks.
There were 73 cDNA reads and 6 paralogs identified. SF-im3_1 was identified with moderate cDNA
reads (S1, 4 and S2, 55). It contained a pre-sequence cleavage site (KR) that resulted in a predictedMar. Drugs 2019, 17, 177 11 of 16
mature peptide of 50 amino acids and 5 disulfide bonds with a classic XX (C-CC-C-CC-C-C-C-C)
framework. No MSMS evidence was found for this sequence.
2.6.17. Superfamily SF-im4
The total read numbers for this superfamily were 37 for the 2 paralogs identified. Similar to
superfamily I2 (58% sequence identity), the propeptide was located at the end of the precursor instead
of intervening between the signal peptide and mature sequence. SF-im4_1 was identified with 5 S1 and
27 S2 reads. The predicted mature peptide had 25 amino acids with 3 disulfide bonds. It is interesting to
note that this superfamily contained the same XXIII (C-C-C-CC-C) framework as the K superfamily [31],
but with a much shorter mature sequence. iTRAQ MSMS identified this sequence, although the ratio
at peptide level (S1:S2 = 1:2.1) did not correlate well with the cDNA level (S1:S2 = 1:5.4) (Figure 3B).
2.6.18. Superfamily SF-im5
This novel superfamily contained a signal peptide with 54% sequence identity to the O3
superfamily. The total reads for this superfamily were 25 with 4 paralogs identified. SF-im5_1
was identified with 2 S1 and 10 S2 cDNA reads. It contained a classic VI/VII cysteine framework
(C-C-CC-C-C), with a predicted cleavage site (RR) that generated mature peptides of 25 amino acids
with an amidated C-terminus. iTRAQ MSMS identified SF-im5_1, although the ratio at peptide level
(S1:S2 = 1:2.3) did not correlate well with the cDNA level (S1:S2 = 1:5.0) (Figure 3B).
2.6.19. Superfamily SF-im6
This superfamily contained a signal peptide with only 40% sequence identity to the I3 superfamily
and was uniquely found in S2, with total reads of 19 and 2 paralogs identified. SF-im6_1 was
identified with 0 S1 and 6 S2 reads. The predicted mature peptide of SF-im6_1 had 36 amino acids,
2 disulfide bonds, and a framework of XIV (C-C-C-C). MSMS validated this sequence at the peptide
level (Supplementary Table S2).
3. Discussion
Venom variation occurs widely among venomous animals and appears to be multifactorial in
origin [7,10–13]. Since venom peptides are encoded by small genes and transcribed into mRNA
in the venom gland, the relationships between venom variation and toxin mRNA levels may be
directly compared within the same animal. The present study utilized a combined transcriptomic
and proteomic approach to delineate venom variation and correlate mRNA abundance across two
specimens of C. imperialis. Transcriptomic analyses revealed 19 conotoxin gene superfamilies, including
17 that were common to both specimens and 6 novel superfamilies (SF-im1 to SF-im6). This is similar
to our study of Conus tulipa [33], where broad overlap was observed at the gene superfamily level,
with two individual specimens having 16 gene superfamilies in common. Consistent with observations
for C. tulipa, striking individual differences were observed at the sequence level, where a total of 267
conopeptides were identified, with only 62 sequences common to both specimens of C. imperialis.
These 267 sequences fall within thirteen cysteine-rich frameworks, including 2 new frameworks.
Interestingly, of the 46 conopeptide sequences [21,34] described previously in C. imperialis venom,
only 13 were identified in this study, further highlighting the extent of variation between the venoms
of individual cone snails. These “missing” conotoxins included the well-studied ImI [25] and
conopressin G [26], suggesting that the toxin expression profile might be linked to many factors,
such as geographical variation, as our Conus imperialis specimens were collected from pristine reefs
in the southern part of the Great Barrier Reef (Australia), in contrast to the previously investigated
specimens collected from degraded reefs in the Philippines [25,26].
This is the first time that the predation-evoked venom of a worm-hunting cone snail has been
investigated and it shows more complexity (Figure 2A) compared to the simpler predation-evoked
venom from piscivorous cone snails, such as C. striatus or C. consors [15,16,35]. Interestingly,Mar. Drugs 2019, 17, 177 12 of 16
a defense-evoked venom could not be obtained from these specimens, despite repeated attempts.
We hypothesize that some worm-hunting cone snails may rely on strong heavy shells for protection
and only deploy a defense-evoked venom in response to extreme threats. Alternatively, aquarium
conditions may have blunted their defensive response. Consistent with the high level of transcriptomic
variability, the toxin profile for the readily obtained predation-evoked milked venom was different
between the two animals, confirming observations on extracted venom [36]. However, similar
contributions of ~10 major conotoxins from the K and T superfamilies suggest these have been
positively selected for prey capture. Despite their potential importance, these toxins have undefined
mammalian pharmacology, suggesting they may selectively target worm receptors.
Extending our Conus tulipa work, we investigated the relationship between the mRNA levels and
peptide levels within the same animal and the levels of translation between the two specimens. ImVC,
which was uniquely expressed by S1, was identified only in its corresponding venom duct, but not in
the venom of S2 (Table 3). iTRAQ identified four of the ten most abundant conopeptide gene precursors
but missed another four, despite their detection in unlabeled venom. Intriguingly, the two most
abundant conopeptide gene precursors (A_1 and A_2) remained undetected, possibly due to unusual
post-translational modifications that were missed by our current search criteria. However, given that
cone snails can inject different venom in defense and predation [17], this suggests these peptides
may have a defensive, rather than predatory role. In contrast, the eight other highly transcribed
and translated conopeptides showed a strong correlation between the mRNA and predatory venom
peptide levels, suggesting these are now subject to stabilizing selection and likely essential for prey
capture. However, this correlation failed to extend to peptides transcribed at low and moderate levels,
suggesting these conopeptides are not subject to stabilizing selection and alternatively may be subject
to diversifying selection.
In this venomic study, we characterized the C. imperialis transciptome and predatory venom
proteome. Building on our recent study of variability in C. tulipa venom, we examined the extent
and nature of individual variation and directly correlated transcription to translation within the
same animal. We confirmed that 8 of the 10 most abundant mRNA gene precursors are largely
shared by the two specimens and translated to represent the major peptides in the predation-evoked
venom, suggesting they are under stabilizing selection for predation. In contrast, transcripts expressed
at lower levels showed high levels of variation between specimens and no correlation between
transcription and translation within specimens. These results demonstrate that analysis of single
specimen provides a unique view of complexity that is lost in pooled samples. The importance
of investigating individual venom composition extends beyond cone snails, with a recent venomic
study of the venom of rear-fanged snakes demonstrating that pooling of samples masks important
individual variation [37]. Presently, the origins of transcriptomic variation and the nature of the various
mechanisms involved remain unresolved.
4. Materials and Methods
4.1. Venom Sample Preparation and RNA Extraction
Two adult specimens of C. imperialis collected from the Southern Great Barrier Reef (Queensland,
Australia) measuring 6 cm (specimen 1) and 7 cm (specimen 2) were housed in our UQ aquarium
facility. The temperature was set to 23–24 ◦ C and a 12:12 light-dark cycle was applied. C. imperialis
feeds exclusively on a group of polychaete marine worms known as “fireworms” (Amphinomidae)
and a milking procedure was adapted from published methods [23,38], employing a live fireworm
as a lure and a microcentrifuge tube covered with a piece of the external worm tegument to initiate
stinging and collect the predation-evoked venom. Whereas C. imperialis has been described previously
to release the fired radula tooth immediately upon venom injection [39], we consistently observed
that our specimens held onto the radula and reeled back the envenomed worm into their rostrum,
reminiscent of hook-and-line fish-hunters (see Supplementary movie). Furthermore, the quantity ofMar. Drugs 2019, 17, 177 13 of 16
venom injected was remarkable, exceeding previously reported volumes for any cone snail species.
Indeed, C. imperialis injects up to 180 µL of thick greenish venom, which is different from the translucent
venom of hook-and-line fish-hunters or the milky venom of mollusc-hunters. Interestingly, this species
was observed to inject venom up to three times within a 30 min trial period. Following the predatory
milking procedure, the collected venom was immediately stored at −20 ◦ C. Three days after the
milking, the two specimens were dissected on ice. The whole venom duct was quickly removed and
placed in a 1.5 mL tube with 1 mL of TRIZOL reagent (Invitrogen). The extraction of total RNA was
carried out following the manufacturer’s instructions. The mRNA was purified from the total RNA
using a Qiagen mRNA extraction kit. Next generation sequencing using a Roche GS FLX Titanium
sequencer was subsequently conducted by AGRF (Australian Genomic Research Facility). The same
amount of mRNA (200 ng) was sequenced for both specimens.
Standard Flowgram Format, FASTA, and quality files from 454 containing de-multiplexed read
sequences were submitted independently to two different de novo assemblers, Newbler v2.6 (Life
Science, Frederick, CO, USA) with default parameters (notably, minimum contig length for all contigs
= 100, minimum contig length for large contigs = 500, minimum length of reads to use in assembly
= 50) and Trinity v2.4.0 [40] in its default configuration and with minimum assembled contig length
of 100.
Sorting of cDNA reads and contigs was performed with ConoSorter [20]. Manual validation
of conopeptide sequences was then carried out from the retrieved data. Gene superfamilies,
signal peptides, and cleavage sites were predicted using the ConoPrec [21] tool, implemented in
ConoServer [24]. ConoPrec identifies the signal sequence region using the signal P algorithm [21,41].
The cut-off value for assigning a signal peptide to a gene superfamily was set to >75% sequence
identity, as extrapolated from a recent analysis of all precursors deposited in ConoServer [23,24].
Novel superfamilies that showed sequence identity between 50–75% to any known superfamily were
considered closely related, whereas no relationship was considered for a sequence identity below 50%.
4.2. Proteomic Analysis
Underivatized peptides in the venom samples were analyzed using the SCIEX QStar (Framingham,
MA, USA); no concentration-normalization step was undertaken for these TOF scan only samples
to ensure a real-time concentration was observed for the milked samples. LC-ESI-MS reconstruction
was carried out using Analyst LCMS reconstruct BioTools. The mass range was set between 800 and
12000 Da. Mass tolerance was set as 0.2 Da and S/N threshold was set as 20. The MS level matching of
the data was carried out using the ConoMass tools [21]. The precision level was set as 0.5 Da for the
automatic matching search. Reconstructed mass lists from the two specimens were compared.
4.3. Reduction-Alkylation and Enzyme Digestion
Reduction and alkylation of the cystine bonds was carried out as previously described [28].
Sigma proteomics sequencing grade trypsin and endoproteinase Glu-C were used to digest the reduced
and alkylated venom samples and the enzymes were activated in 40 mM NH4 HCO3 buffer. A ratio of
1:100 (w/w) of enzyme to venom peptides was used. The digestion was carried out overnight at 37 ◦ C
and enhanced in a microwave apparatus for 4 min on the lowest power setting.
4.4. iTRAQ Labelling, Relative, and Absolute Quantitation of the Injected Venom Samples
The total protein concentration of the two injected venoms was measured using a NanoDrop
spectrophotometer (Thermo Fisher Scientific Inc, USA) at 280 nm wavelength. The same calculated
amount of total protein (50 µg) was used for each sample (i.e., 2.9 µL of injected venom from specimen
1 and 14.5 µL of injected venom from specimen 2), in order to aid correlation of the protein level of
individual conotoxins with the mRNA level and to allow comparison between the two specimens.
Reduction, alkylation, and tryptic digestion was carried out as described above, except for the buffer
where triethyl ammonium bicarbonate (TEAB) was used instead of ammonium bicarbonate to avoidMar. Drugs 2019, 17, 177 14 of 16
interference to subsequent labelling. After lyophilization, peptides were labeled with iTRAQ 8-plex
reagent (113 for specimen 1 and 115 for the specimen 2) following the manufacturer’s protocol.
Individually labeled samples were cleaned up using a cation exchange cartridge, then the two
labeled milked venom samples were combined and analyzed using iTRAQ IDA methods [42].
The unlabeled milked venom samples (reduced/alkylated with and without digestion) for each
individual were also analyzed by LC-MSMS on the SCIEX 5600 (Framingham, MA, USA). Protein
Pilot v4.0.0 software (SCIEX, Framingham, MA, USA) was used for peaklist-generation, sequence
identification, and quantitation by searching the LC-ESI-MSMS spectra against a database containing
the extracted conopeptides from this work plus published conopeptide sequences (1752 entries).
With the alkylated samples, the fixed modification was set as iodoethanol for cysteine alkylation.
A total of 9 different types of variable modifications, which have been identified on conopeptides,
were considered including the following: Amidation, deamidation, hydroxylation of proline and
valine, oxidation of methionine, carboxylation of glutamic acid, cyclization of N-terminal glutamine
(pyroglutamate), bromination of tryptophan, and sulfation of tyrosine. The mass tolerance was set as
0.05 Da for precursor ions and 0.1 Da for the fragment ions. Tandem mass spectra were only acquired
for the 2 to 5 charged ions. The threshold score for accepting individual peptide spectra was 99.
The detected peptide sequences were manually inspected and validated.
5. Conclusions
In this study, we analyzed, for the first time, the predation-evoked venom from a vermivorous
species of cone snail and systematically compared two individuals at both transcriptomic and
proteomic levels. We demonstrate that transcriptomic sequences expressed at high levels translate
to the major peptides in the predatory-evoked venom, while those expressed at low levels correlate
poorly with levels of peptide expression. This study contributes to the understanding of the molecular
origins of venom variability in cone snails.
Supplementary Materials: The following are available online at http://www.mdpi.com/1660-3397/17/3/177/s1,
Supplementary Table S1: 62 sequences common between two C. imperialis specimens. Supplementary Table S2:
Sequences validated by MS/MS. Supplementary Table S3: Assembly of C imperialis venom duct for specimen 1
(S1) and specimen 2 (S2). Supplementary Table S4: Comparison of assembled and raw data from two assemblers.
Supplementary report: AGRF RNA quality measurement (2100 expert_mRNA Pico_DE54700697). Video S1: Conus
imperialis predatory behavior.
Author Contributions: Conceptualization, A.-H.J. and S.D.; methodology, A.-H.J. and S.D.; formal analysis,
A.-H.J. and M.D.; investigation, V.L. and A.J.; resources, P.F.A. and R.J.L.; writing—original draft preparation,
A.-H.J. and S.D.; writing—review and editing, funding acquisition, P.F.A. and R.J.L.
Funding: This research was funded by an NHMRC Program Grant APP1072113. The AB SCIEX 5600 mass
spectrometer was supported by an ARC LIEF grant. PFA and RJL acknowledge NHMRC Fellowships.
Acknowledgments: The authors thank Stephen Rudd for expert advice on assembly related issues, members of
the Brisbane Shell Club for providing the specimens of C. imperialis used in this study, and Valentin Dutertre for
his help with collecting the predation-evoked venoms.
Conflicts of Interest: The authors declare no conflict of interest.
References
1. Bingham, J.-P.; Jones, A.; Lewis, R.; Andrews, P.; Alewood, P. Conus venom peptides: Inter-species,
intra-species and within individual variation revealed by ionspray mass spectrometry. In Biochemical
Aspects of Marine Pharmacology; Lazarovici, M.S., Zlotkin, E., Eds.; Alaken Inc.: Anchorage, AK, USA, 1996.
2. Ruiming, Z.; Yibao, M.; Yawen, H.; Zhiyong, D.; Yingliang, W.; Zhijian, C.; Wenxin, L. Comparative venom
gland transcriptome analysis of the scorpion Lychas mucronatus reveals intraspecific toxic gene diversity and
new venomous components. BMC Genom. 2010, 11, 452. [CrossRef] [PubMed]
3. Abdel-Rahman, M.A.; Omran, M.A.; Abdel-Nabi, I.M.; Ueda, H.; McVean, A. Intraspecific variation in the
Egyptian scorpion Scorpio maurus palmatus venom collected from different biotopes. Toxicon 2009, 53, 349–359.
[CrossRef] [PubMed]Mar. Drugs 2019, 17, 177 15 of 16
4. Sunagar, K.; Undheim, E.A.; Scheib, H.; Gren, E.C.; Cochran, C.; Person, C.E.; Koludarov, I.; Kelln, W.;
Hayes, W.K.; King, G.F.; et al. Intraspecific venom variation in the medically significant southern pacific
rattlesnake (Crotalus oreganus helleri): Biodiscovery, clinical and evolutionary implications. J. Proteom. 2014,
99, 68–83. [CrossRef] [PubMed]
5. Castro, E.N.; Lomonte, B.; del Carmen Gutierrez, M.; Alagon, A.; Gutierrez, J.M. Intraspecies variation in
the venom of the rattlesnake Crotalus simus from mexico: Different expression of crotoxin results in highly
variable toxicity in the venoms of three subspecies. J. Proteom. 2013, 87, 103–121. [CrossRef] [PubMed]
6. Lopes, P.H.; Bertani, R.; Goncalves-de-Andrade, R.M.; Nagahama, R.H.; van den Berg, C.W.; Tambourgi, D.V.
Venom of the brazilian spider Sicarius ornatus (araneae, sicariidae) contains active sphingomyelinase d:
Potential for toxicity after envenomation. PLoS Neglect. Trop. Dis. 2013, 7, e2394. [CrossRef] [PubMed]
7. Cristina de Oliveira, K.; Goncalves de Andrade, R.M.; Giusti, A.L.; Dias da Silva, W.; Tambourgi, D.V.
Sex-linked variation of loxosceles intermedia spider venoms. Toxicon 1999, 37, 217–221. [CrossRef]
8. Brand, J.M.; Blum, M.S.; Barlin, M.R. Fire ant venoms: Intraspecific and interspecific variation among castes
and individuals. Toxicon 1973, 11, 325–331. [CrossRef]
9. Colinet, D.; Mathe-Hubert, H.; Allemand, R.; Gatti, J.L.; Poirie, M. Variability of venom components in
immune suppressive parasitoid wasps: From a phylogenetic to a population approach. J. Insect Physiol. 2013,
59, 205–212. [CrossRef]
10. Dix, M.W. Snake food preference: Innate intraspecific geographic variation. Science 1968, 159, 1478–1479.
[CrossRef]
11. Gregory-Dwyer, V.M.; Egen, N.B.; Bosisio, A.B.; Righetti, P.G.; Russell, F.E. An isoelectric focusing study of
seasonal variation in rattlesnake venom proteins. Toxicon 1986, 24, 995–1000. [CrossRef]
12. Bordenstein, S.R.; Drapeau, M.D.; Werren, J.H. Intraspecific variation in sexual isolation in the jewel wasp
nasonia. Evol. Int. J. Organic Evol. 2000, 54, 567–573. [CrossRef]
13. Tibbetts, E.A.; Skaldina, O.; Zhao, V.; Toth, A.L.; Skaldin, M.; Beani, L.; Dale, J. Geographic variation in the
status signals of Polistes dominulus paper wasps. PLoS ONE 2011, 6, e28173. [CrossRef] [PubMed]
14. Lewis, R.J.; Dutertre, S.; Vetter, I.; MacDonald, J.C. Conus venom peptide pharmacology. Pharmacol. Rev.
2012, 64, 259–298. [CrossRef] [PubMed]
15. Dutertre, S.; Biass, D.; Stocklin, R.; Favreau, P. Dramatic intraspecimen variations within the injected venom
of conus consors: An unsuspected contribution to venom diversity. Toxicon 2010, 55, 1453–1462. [CrossRef]
16. Jakubowski, J.A.; Kelley, W.P.; Sweedler, J.V.; Gilly, W.F.; Schulz, J.R. Intraspecific variation of venom injected
by fish-hunting conus snails. J. Exp. Biol. 2005, 208, 2873–2883. [CrossRef] [PubMed]
17. Dutertre, S.; Jin, A.H.; Vetter, I.; Hamilton, B.; Sunagar, K.; Lavergne, V.; Dutertre, V.; Fry, B.G.; Antunes, A.;
Venter, D.J.; et al. Evolution of separate predation- and defence-evoked venoms in carnivorous cone snails.
Nat. Commun. 2014, 5, 3521. [CrossRef]
18. Vogel, C.; Marcotte, E.M. Insights into the regulation of protein abundance from proteomic and transcriptomic
analyses. Nat. Rev. Genet. 2012, 13, 227–232. [CrossRef]
19. Jin, A.H.; Dutertre, S.; Kaas, Q.; Lavergne, V.; Kubala, P.; Lewis, R.J.; Alewood, P.F. Transcriptomic messiness
in the venom duct of Conus miles contributes to conotoxin diversity. Mol. Cell. Proteom. 2013, 12, 3824–3833.
[CrossRef]
20. Lavergne, V.; Dutertre, S.; Jin, A.H.; Lewis, R.J.; Taft, R.J.; Alewood, P.F. Systematic interrogation of the
Conus marmoreus venom duct transcriptome with conosorter reveals 158 novel conotoxins and 13 new gene
superfamilies. BMC Genom. 2013, 14, 708. [CrossRef]
21. Kaas, Q.; Yu, R.; Jin, A.H.; Dutertre, S.; Craik, D.J. Conoserver: Updated content, knowledge, and discovery
tools in the conopeptide database. Nucleic Acids Res. 2012, 40, D325–D330. [CrossRef]
22. Allam, A.; Kalnis, P.; Solovyev, V. Karect: Accurate correction of substitution, insertion and deletion errors
for next-generation sequencing data. Bioinformatics 2015, 31, 3421–3428. [CrossRef] [PubMed]
23. Dutertre, S.; Jin, A.H.; Kaas, Q.; Jones, A.; Alewood, P.F.; Lewis, R.J. Deep venomics reveals the mechanism
for expanded peptide diversity in cone snail venom. Mol. Cell. Proteom. 2013, 12, 312–329. [CrossRef]
[PubMed]
24. Kaas, Q.; Westermann, J.C.; Craik, D.J. Conopeptide characterization and classifications: An analysis using
conoserver. Toxicon 2010, 55, 1491–1509. [CrossRef] [PubMed]You can also read