An Optimized Method for Skin Cancer Diagnosis Using Modified Thermal Exchange Optimization Algorithm
←
→
Page content transcription
If your browser does not render page correctly, please read the page content below
Hindawi
Computational and Mathematical Methods in Medicine
Volume 2021, Article ID 5527698, 11 pages
https://doi.org/10.1155/2021/5527698

Research Article
An Optimized Method for Skin Cancer Diagnosis Using Modified
Thermal Exchange Optimization Algorithm

          Liu Wei ,1 Su Xiao Pan ,2 Y. A. Nanehkaran ,3 and V. Rajinikanth                                      4

          1
            Gannan University of Science & Technology, Ganzhou, Jiangxi 341000, China
          2
            Ganzhou 851, Ganzhou, Jiangxi 341000, China
          3
            School of Informatics, Xiamen University, Xiamen, 361005 Fujian, China
          4
            Department of Electronics and Instrumentation Engineering, St. Joseph’s College of Engineering, Chennai 600119, India

          Correspondence should be addressed to V. Rajinikanth; v.rajinikanth@ieee.org

          Received 19 January 2021; Revised 12 April 2021; Accepted 31 May 2021; Published 19 June 2021

          Academic Editor: Markos G. Tsipouras

          Copyright © 2021 Liu Wei et al. This is an open access article distributed under the Creative Commons Attribution License, which
          permits unrestricted use, distribution, and reproduction in any medium, provided the original work is properly cited.

          Skin cancer is the most common cancer of the body. It is estimated that more than one million people worldwide develop skin
          cancer each year. Early detection of this cancer has a high effect on the disease treatment. In this paper, a new optimal and
          automatic pipeline approach has been proposed for the diagnosis of this disease from dermoscopy images. The proposed
          method includes a noise reduction process before processing for eliminating the noises. Then, the Otsu method as one of the
          widely used thresholding method is used to characterize the region of interest. Afterward, 20 different features are extracted
          from the image. To reduce the method complexity, a new modified version of the Thermal Exchange Optimization Algorithm is
          performed to the features. This improves the method precision and consistency. To validate the proposed method’s efficiency, it
          is implemented to the American Cancer Society database, its results are compared with some state-of-the-art methods, and the
          final results showed the superiority of the proposed method against the others.

1. Introduction                                                         stages of development is a challenging task, even for derma-
                                                                        tologists. Melanoma is known as the 19th prevalent cancer
Cancer, as a difficult disease to treat, has long occupied the            in men and women. There were about 300,000 new cases in
human mind [1]. Cancer occurs when cells in a part of the               2018.
body grow uncontrollably, divide rapidly, invade different                   The data gathered by the World Health Organization
tissues in the body, and spread throughout the body [2]. A              (WHO) in 2018 showed that there were 17852 melanoma
set of these uncontrollable cells is called a tumor [3]. One            cases in the United Kingdom [5]. This organization predicted
of the deadliest sorts of cancers is skin cancer. Skin cancer           that the number of melanoma cases will grow by 9% to 19513
has grown significantly over the past decades, and the impor-            with deaths growing by 13% to 3119 by 2025.The growth of
tance of its early treatment is increasing day by day [4].              skin cancer begins when damage to skin cells (often caused
    Melanoma is the third most common type of skin cancer               by ultraviolet light) causes mutations that rapidly multiply
and one of the malignant cancers. Melanoma is also referred             in skin cells and form malignant tumors.
to as malignant melanoma, which changes the color of the                    Normally, skin cells grow in a controlled and regular way.
skin due to the abnormal function of pigment-producing                  However, some newly produced cells may grow out of con-
cells. The disease is formed by the accumulation of melanin             trol and form a mass of cancer cells. Changes in the shape,
granules and its spread to the outermost layer of the skin.             size, and color of a person’s mole are often the first signs of
Despite significant mortality, melanoma is often treatable in            melanoma [6]. Melanoma has a black or bluish-black border;
the early stages of diagnosis. At the same time, distinguishing         melanoma also appears as new black spots with an abnormal
between melanoma and other benign moles in the early                    appearance [7]. These pigment-producing tumors are
2                                                                     Computational and Mathematical Methods in Medicine

present in the surface layer of the skin (epidermis [1]). Based   cancers, and the other one determined the deadliest skin can-
on the WHO reports, melanoma with 15000 cases is ranked           cer identification. The results indicated high efficacy for the
as the fourth prevalent cancer and with 1900 cases is the         suggested method.
ninth deadliest cancer [8].                                           It is clear from the literature that several applications of
    Diagnosis of skin cancer is difficult to distinguish due to     the deep learning in skin cancer detection still have lots of
the appearance of different types of skin lesions, especially      space. Therefore, in this paper, a new optimized method
melanoma and nevi. Even with dermoscopy, a noninvasive            has been proposed for skin lesion diagnosis with higher per-
experimental technique, the accuracy of melanoma diagnosis        formance based on a new modified version of the Thermal
by dermatologists is 84-75%. Sampling, however, provides a        Exchange Optimization Algorithm.
better diagnosis that is only possible based on surgery, which        The next parts of this study are structured as follows. In
can lead to an unpleasant experience for the patient.             “Noise Reduction from the Images,” the method of NLM
    To prevent unnecessary sampling, researchers have             based on the Yaroslavsky filter is used as a beneficial noise
reviewed several noninvasive methods for diagnosing mela-         reduction tool. In “Image Segmentation,” the method of
noma. These methods usually involve three steps: (1) skin         image segmentation which is based on the Otsu thresholding
boundary identification, (2) feature extraction, and (3) classi-   and mathematical morphology is explained. In “Methodol-
fication [9]. The border-detection process detects the tumor       ogy,” the proposed Modified Thermal Exchange Optimiza-
in skin-related images, which is essential for the accurate       tion Algorithm along with its application for optimal
classification of skin lesions. The feature extraction process     feature selection is mentioned. In “Classification,” the classi-
uses visual properties such as color, mass shape, and texture     fication method of the study which is based on the support
information to classify [10]. The classification process also      vector machine is stated. In “Results and Discussions,” the
extracts the type of skin lesions from the image features         simulation results and their discussion are explained, and
and performs classification operations.                            finally, the paper is concluded in “Conclusions.”
    Navid and Ghadimi [11] proposed a method for mela-
noma detection in the images. Edge detection and smoothing        2. Noise Reduction from the Images
technique were used for eliminating extra scales. Then, the
segmentation method was performed. During the segmenta-           Preprocessing is used to correct problems in images taken
tion, mathematical morphological was used for eliminating         that may occur during medical imaging, such as noise or
the extra information on the melanoma boundary area. The          light. In medical imaging, there may be disturbances due to
classification of the method was performed by an optimized         high-frequency reception, different brightness in the field,
Artificial Neural Networks (ANN) based on World Cup                and problems due to distant orientation, which are corrected
Optimization (WCO) algorithm to minimize the root mean            by artificial intelligence and image processing, and usually by
square error between the network output and the desired           default on all images before the main processing. In this
output. The final results indicated that the suggested tech-       paper, two modifications have been used as image prepro-
nique develops the method’s efficacy. Recently, several             cessing to improve the system performance [16]. Due to the
research works are introduced for the early diagnosis of skin     stochastic physical nature of imaging systems, noise in the
cancers [12]. For example, Sugiarti et al. [13] introduced a      image is unavoidable, making it difficult to perform various
method for the early diagnosis of melanoma cancer. The fea-       image processes such as segmentation, detection, and inter-
ture extraction method of the first order was utilized for fea-    pretation [17]. The important point during the noise reduc-
ture extraction to achieve higher precision. The classification    tion is that the original image and especially its details are
was performed by the Artificial Neural Network (ANN). The          not damaged as much as possible and the structure of the
final results indicated that that using the proposed method        original image is preserved. Based on this, various methods
provides a satisfied result for the analyzed images.               have been proposed to eliminate noise. In this study, we used
    Zhi et al. [14] presented a CAD system for early detection    the newly introduced NLM method for this purpose.
of skin cancer. The method uses a median filter for noise               The NLM filter is an extended version of the Yaroslavsky
reduction. Image segmentation was done based on Convolu-          filter [18], which uses nonlocal averaging of similar pixels
tional Neural Network (CNN) that is optimized by Satin            (pixels with a closer brightness level) to retrieve the actual
Bowerbird Optimization (SBO). Afterward, feature extrac-          amount of pixels being processed. The main advantage of
tion and feature selection were done to extract the valuable      the NLM method compared to this method is that it has a
information from the segmented image. The feature selection       more stable similarity criterion in the presence of noise,
was based on the SBO algorithm. Final features were fed to a      because, in addition to comparing the pixels intensity levels,
Support Vector Machine (SVM) classifier for final recogni-          a neighbor of them has also a role in determining the degree
tion. The results were validated by applying them to the          of similarity. The NLM method has a good performance in
American Cancer Society database and comparing them with          reducing most noise models, especially if the noise can be dis-
some different techniques from the literature.                     tributed collectively. The NLM method is based on the
    Esteva et al. [15] suggested a diagnosis technique for        weight of all the pixels in the image, in proportion to the sim-
lesion segmentation using deep learning. The analysis of the      ilarity of their neighbors; in other words, the more similar the
proposed method is validated by 21 clinical images to classify    image pixel neighbors are to the pixel neighbor being proc-
them into two groups of malignant and benign classes. The         essed, the higher the weight assigned to them. The amount
study analyzed two cases: the first identified the prevalent        of pixels being processed is calculated using the total weight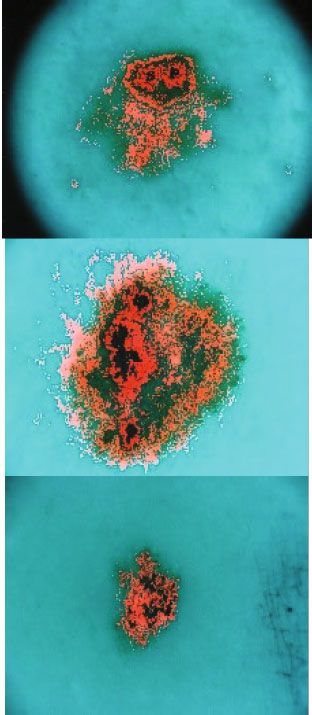
Computational and Mathematical Methods in Medicine                                                                                                 3

found from the other pixels. The neighborhood criterion
similarity in the NLM method is the weighted Euclidean
principle with the Gaussian kernel, which is shown in
Equation (1).
                                 vffiffiffiffiffiffiffiffiffiffiffiffiffiffiffiffiffiffiffiffiffiffiffiffiffiffiffiffiffiffiffiffiffi
                        2 u  uN

         d = vðηi Þ − v η j  = t 〠 wk xik − x jk 2 ,                ð1Þ
                                   2ρ       k=1
                                                                                             (a)                                      (b)
where vðηi Þ describes the pixel neighborhood vector under                  Figure 1: Image noise reduction: (a) before and (b) after processing.
process, other pixels’ neighborhood vector, and k:k22ρ
represents the weighted Euclidean distance operator with                    is used to reveal hidden details in the image. Therefore, after
Gaussian kernel.                                                            noise reduction in the previous section, for highlighting the
    In other words, in calculating the similarity of neighbor-              brain region, image thresholding has been used. One of the
hoods, the central pixel has a higher value, and by moving                  most popular and classic methods for finding the best thresh-
through the central pixel, the effect of the pixels decreases.               old value is the Otsu method.
                           0                2 1                             The Otsu method provides global thresholding for the

                 1       B  iv ð η Þ − v  ηj  C                         input image. It uses the image histogram for maximizing
                       exp B
                                                  2ρ C                      the “between-class variance” of the segmented classes which
        W Mi, M j =
                    Zi     @−            h 2         A,               ð2Þ
                                                                            consequently minimizes the “within-class variance” of the
                                                                            segmented classes. However, maximizing “between-class var-
                                                                            iance” needs less computational complexity than minimizing
where                                                                       “within-class variance.” During the Otsu thresholding, we
                          0                                                look forward to a threshold level to minimize the class
                                             2 1
                                                                          variance, i.e.
                          B   v ð ηi Þ − v  ηj  C
               Z i = 〠 expB
                                                  2ρ C
                          @−             h 2         A                ð3Þ
                                                                                             σ2ω ðt Þ = ω1 ðt Þσ21 ðt Þ + ω2 ðt Þσ22 ðt Þ,        ð5Þ
                     j

                                                                                σ2b ðt Þ = σ2 − σ2ω ðt Þ = ω1 ðt Þω2 ðt Þðμ1 ðt Þ − μ2 ðt ÞÞ2 ,   ð6Þ
where Z i is a normalization parameter that guarantees the
utilized sum of weights equals 1. h describes the main param-               where ωi signifies the probability for two separate classes with
eter of the NLM that determines the filtering intensity. If h is
                                                                            a threshold value of t, σ2i describes the variance of the classes,
selected small, the value of the filtering in the image is small,
                                                                            and μi ðtÞ represents the mean value of the class and is
and the noise effect has been not removed properly, but a
                                                                            updated alternately.
large value for h makes an overfiltering for the image, and
                                                                                The Otsu thresholding can be briefly considered as
the reconstructed image is completely blurred and devoid
                                                                            follows:
of fine structural details. The final equation of the NLM filter
with computed weighted coefficients can be formulated as
                                                                                (1) Calculate the histogram and the probabilities for each
follows:
                                                                                    intensity level:

                  NLMðM i Þ = 〠 W M i , M j M j ,                     ð4Þ            (1.1) Initialize the ωi ð0Þ and μi ð0Þ for all possible
                                    j
                                                                                           threshold levels
    Although all pixels must be weighed in retrieving each                           (1.2) Update ωi and μi
pixel image, this operation is very time-consuming, so a spe-
cific area called the search window around each pixel being                           (1.3) Calculate σ2b ðtÞ
processed is used for the weighting operation. As explained                     (2) The optimal threshold is the maximum of σ2b ðtÞ.
before, NLM is a parameter filter with the following parame-
ters: search window radius, similarity window radius, and
smoothing parameter (h). Figure 1 shows a sample of noise                   3.2. Morphological Operations. After performing the thresh-
reduction for this case.                                                    olding stage, mathematical morphology has been used to
                                                                            abolish the spare parts of the region of interest in skin cancer
3. Image Segmentation                                                       images [19]. Mathematical morphology is based on applying
                                                                            a structural element (e) to the considered image. Here, a 5 × 5
3.1. Image Thresholding. The thresholding method is used to                 identity matrix is used for structure element. In this study,
remove unnecessary information and focus on the basic                       mathematical filling, opening, and closing have been
information in the image. Also, if the objects in the image                 employed for this purpose. The first operation is to use math-
and the “background” have similar gray levels, this method                  ematical filling. This operation is used to fill the empty holes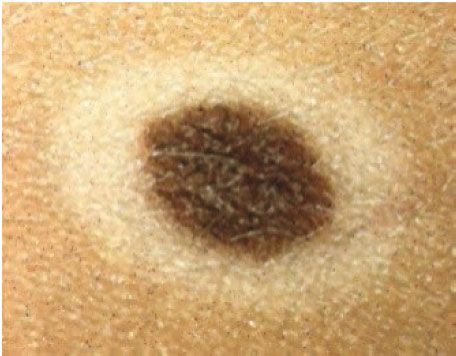
4 Computational and Mathematical Methods in Medicine
in the threshold image. This operator can be achieved by the
following equation:
X k = ðX k−1 ⊕ eÞ ∩ Ac , k = 1, 2, 3 ⋯ , ð7Þ
where A and e represent the area and the structure element,
respectively.
After filling the holes, the mathematical opening opera-
tion has been performed to the image to eliminate the lighter
details without deploying other gray surfaces. This is done by
the following equation:
A ∘ e = ðA ⊖ eÞ ⊕ e: ð8Þ
The last process is to perform the mathematical closing to
connect the narrow parts. The formula for this operation is (a) (b)
given below:
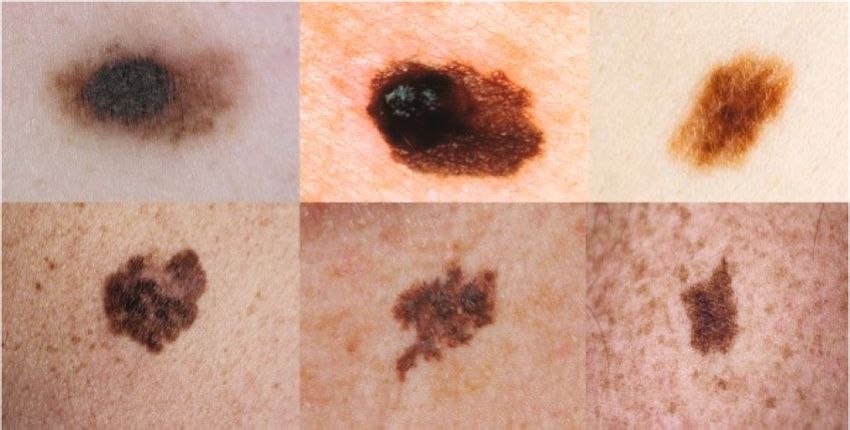
Figure 2: A sample for skin cancer segmentation based on the
explained method: (a) input image and (b) segmented.
A•e = ðA ⊕ eÞ ⊖ e: ð9Þ
system. This TEO algorithm is a metaheuristic technique that
Figure 2 shows a sample for skin cancer segmentation
is derived by the temperature behavior for the objects and
based on the explained method.
their location which is exchanged between warm and cold
parts and specifies the updated locations. More explanations
4. Methodology are explained in the following.
In this study, a new modified metaheuristic has been pro- 4.1.1. The Newton Law of Cooling. The Newton law of cooling
posed, and then, it has been applied for providing an optimal states that the rate at which a body temperature changes is
feature selection to get better results of diagnosing. approximately proportional to the difference in temperature
4.1. The Modified Thermal Exchange Optimization between the body and its surroundings. This was first discov-
Algorithm. Achieving the optimal state has been one of the ered by Newton. When the temperature difference between
most fundamental issues in the world since the creation of the body and its surroundings is small, the average amount
the universe. The scope of application of optimization- of heat exchanged between the body and its surroundings
related topics is very wide. Mathematics, computer science, due to conduction, convection, and infrared radiation is
engineering, physics, and economics are just some of these approximately proportional to the difference in temperature
topics. In this type of problem, the goal is to get the best deci- of the body and the environment. Newton’s law of cooling
sion mode from several different modes [20]. Metaheuristic is the solution of a differential equation of the Fourier law
algorithms can be considered one of the most important clas- which is formulated as follows:
ses of optimization solutions for these types of issues. These
dQ
algorithms have a lot of variety [21]. The great variety of = α × A × ðT s − T a Þ, ð10Þ
these algorithms in solving different problems, as well as dt
the introduction of new algorithms with different titles, has
made choosing a suitable algorithm for the user who intends where Q defines the heat, A signifies the body area surface
to use them a difficult and complex task [22]. On the other which transmits heat, α represents the heat transfer coeffi-
hand, each of these algorithms obtains the optimal solution cient which depends on several cases such as heat transfer
with certain accuracy and speed. Therefore, it seems neces- mode, surface state, and object geometry, and T b and T a
sary to have a structure that can well identify the differences describe the body temperature and the ambient temperature.
between these algorithms and make their comparison easier. Based on the equation, the time for losing heat is α × A
On the other hand, the implementation of each algorithm × ðT a − TÞ dt which determines the change in reserved heat
typically requires complete knowledge of that algorithm as the temperature falls dT, i.e.
and professional programming knowledge. Some examples
V × ρ × c × dT = −α × A × ðT − T b Þdt, ð11Þ
of these algorithms are like the Chimp Optimization Algo-
rithm (ChOA) [23], Black Hole (BH) [24], Crow Search
Algorithm (CSA) [25], Water Strider Algorithm (WSA) where c represents the specific heat (J/kg/K), ρ describes the
[26], Ant Lion Optimizer (ALO) algorithm [27], and Ther- density (kg/m3 ), and V specifies the volume (m3 ).
mal Exchange Optimization (MTEO) [28]. In this study, a Hence
modified version of this algorithm called the Modified Ther-
T − Tb −α × A × t
mal Exchange Optimization (MTEO) algorithm is proposed = exp , ð12Þ
to achieve optimal results for different parts of the diagnosis TM − Tb V ×ρ×c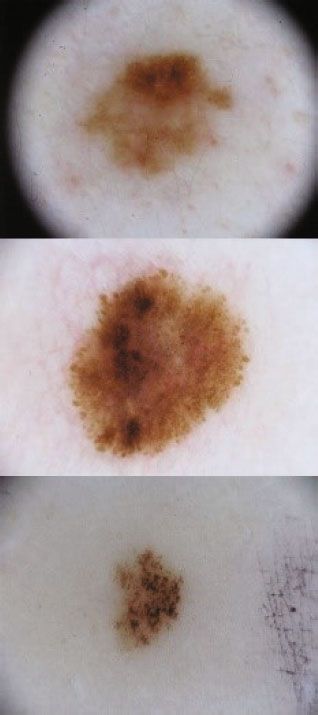
Computational and Mathematical Methods in Medicine                                                                                 5

where T M represents the early high temperature. The above             For increasing the global searching in the algorithm,
equation is correct when α × A × t/V × ρ × c is has not            environmental temperature changing has been considered
depended to T:                                                     that can be considered as follows:
                                                                                                                           e
                               α×A                                          T ei = ð1 − ðm1 + m2 × ð1 − t Þ × randÞÞ × T i′ ,   ð19Þ
                         ζ=          ,                     ð13Þ
                              V ×ρ×c
                                                                            e
                                                                   where T i′ describes the previous temperature of the object
   Hence, by assuming ζ as a constant                              modified by T ei and m1 and m2 represent the control vari-
                                                                   ables, respectively.
                     T − Tb                                            Considering the past models, the object new temperature
                            = exp ð−ζt Þ:                  ð14Þ
                    TM − Tb                                        can be mathematically updated by the following equation:

                                                                                                  i − T i exp ð−ζt Þ:
                                                                                  T +i = T ei + T old                           ð20Þ
                                                                                                        e
   Accordingly

              T = ðT M − T b Þ × exp ð−γt Þ + T b :        ð15Þ        The final case which is considered in this algorithm is Pr.
                                                                   This term shows that a component changes in the cooling
4.1.2. The Algorithm. In Thermal Exchange Optimization             objects or not.
Algorithm, some individuals are considered cooling sub-                The Pr individuals have been compared with RðiÞ which
stances, and the other leftover individuals are considered         has a random value in the range [0, 1]. If RðiÞ < Pr, one
the environment, and then, the reverse process is performed.       dimension of the ith individual has been randomly selected,
Like any other metaheuristic algorithm, the TEO algorithm          and the value is rewritten in the following:
starts with initializing a definite number of randomly distrib-
uted individuals as the solution candidates. This can be pre-
sented as follows:                                                           T i, j = T min
                                                                                        j   + rnd T max
                                                                                                    j   − T min
                                                                                                            j     exp ð−ζt Þ,   ð21Þ

              T 0i = T min + δ × ðT max − T min Þ,                 where T i, j describes the jth variable of the individual number i
                                                           ð16Þ
                i = 1, 2, ⋯, n,                                    and T min
                                                                          j    and T max
                                                                                     j   represent the lower and the upper bounds
                                                                   of the variable number j, respectively. Finally, the algorithm
where T 0i describes the initial population of the algorithm for   will be terminated if stopping criteria have been met.
the ith object, δ represents a random value limited in the         4.1.3. Modified Thermal Exchange Optimization Algorithm.
range [0, 1], and T min and T max describe the minimum and         From the literature, the method is compared with DE, ECBO,
maximum boundaries.                                                CBO, PSO, GWO, GA, and lots of other optimization
    The cost value of all randomly generated individuals is        methods (20 other methods). The results showed that the
then evaluated to indicate the cost of each algorithm. Then,       original TEO has better convergence than most of the algo-
the best T candidate vector positions have been stored as          rithms with a satisfied solution value. Then, the original
thermal memory (TM) to employ for developing the algo-             paper concluded that TEO can be employed as a search
rithm performance with less complexity. Some best TM can-          engine in most of the optimization problems [28]. Also, it
didates are then added to the individuals, and the same            might be a source of inspiration for future algorithms or
numbers of them that have the worst values are removed.            improved and hybridized with other methods. In this section,
Therefore, individuals have two equal types of environment,        the details of the suggested modified Thermal Exchange
and the heat and cooling transfer objects can be seen in           Optimization Algorithm, named MWSA, have been pre-
Figure 3.                                                          sented. In a general form, metaheuristic algorithms should
    To get a better conception, T 1 defines the environment         be efficient in two significant terms, exploitation and explora-
object for T ðn/2Þ+1 cooling object, and contrariwise. If the      tion, such that it can found an appropriate trade-off between
object gives a lower value than ζ, the temperature exchanges       them for better performance. The algorithm has the advan-
gradually. In this situation, ζ has been achieved as follows:      tage of fast convergence and excellent local search capability,
                                                                   although it tends to fall into a local optima point rather than
                          Cos ðobjectÞ                             finding the global optimum [29–31]. In order to develop the
                   γ=                      :               ð17Þ    algorithm efficiency by giving a proper balance between
                        Cos ðworst objectÞ
                                                                   exploration and exploitation terms, a modification has been
    This algorithm uses time as another significant term for        applied to it in this study. Opposition-based learning and
the simulation. This term directly depends on iteration num-       chaos map are two modification mechanisms that are used
ber. This can be mathematically formulated as follows:             here for improving algorithm efficiency.
                                                                       The first mechanism, the opposition-based learning
                                                                   (OBL) mechanism, was first presented by Tizhoosh [32].
                            iteration                              This mechanism contains a strong mathematical concept
                      t=                 :                 ð18Þ
                           Max:iteration                           for improving the global searching of the algorithm. As
6                                                                                        Computational and Mathematical Methods in Medicine

                                              T1       T2      …        Tn/2         Tn/2+1   Tn/2+2 …      Tn

                                 Figure 3: The pairs of environment and the heat and cooling transfer objects.

                                              Table 1: The information about the utilized test functions.

No.                                           Test function                                        Minimum value                             Boundary
                                                      N
1                                              F 1 = 〠 x2n                                                  0                               −∞ ≤ x ≤ ∞
                                                      n=1
                                  N−1
                                                              2
2                           F 2 = 〠 100 × xn+1 − x2n              + ½1 − xn 2                              0                              −∞ ≤ xn ≤ ∞
                                  n=1
                                        N                   pffiffiffiffiffiffiffiffiffiffiffiffi
3                               F 3 = 〠 jxn j − 10 cos        j10xn j                                       0                              −∞ ≤ xn ≤ ∞
                                        n=1

4                                F 4 = x sin ð4xÞ + 1:1y sin ð2yÞ                                      -18.5547                             0 ≤ x, y ≤ 10
                                          "       #
                                               N
5                                   F 5 = 〠 nx4n + N n ð0, 1Þ                                            Varies                             −∞ ≤ x ≤ ∞
                                              n=1

                                                  N
6                             F 6 = 10N + 〠 x2n − 10 cos ð2πxn Þ                                            0                              −∞ ≤ xn ≤ ∞
                                               n=1
                                              N
                                             x2n      Y N
7                               F7 = 1 + 〠        −            cos ðxn Þ                                    0                              −∞ ≤ xn ≤ ∞
                                        n=1 4000      n=1
                                                 pffiffiffiffiffiffiffiffiffiffiffiffiffiffi
                                      1 sin2 x2 + y2 − 0:5
8                                 F8 = +                                                                 -0.5231                           −∞ ≤ x, y≤∞
                                      2      1 + 0:1ðx2 + y2 Þ

aforementioned, the initializing step in TEO is completely                           employing chaotic variables instead of random ones in meta-
random, and the aim is to find the best points in the solution                        heuristics, better exploration has been generated for the solu-
space. Here, if the generated variables have a proper value                          tion space because of the dynamic behavior of the sequence
close to the solution space, the proper solution will be                             [34]. Several functions have been introduced as chaos func-
achieved. But, if the algorithm starts with values too distant                       tions [35]. This study employed a sinusoidal chaotic map
from the optimal solution, the time for finding the global                            function to modify the convergence speed of the TEO and
value will be extended or even makes a premature conver-                             make a balance between its exploitation and exploration
gence in some cases. The OBL is a mechanism to modify this                           terms. By considering the sinusoidal map in the TEO algo-
issue by generating opposite values from the originally gener-                       rithm, environmental temperature changing is considered:
ated population. So, for every single solution, its original cost
                                                                                                                                              e
value and its opposite cost value have been compared, the                                     T ei = ð1 − ðm1 + m2 × ð1 − t Þ × ki+1 ÞÞ × T i′ ,     ð23Þ
best one will have remained, and the other will be removed.
This can be mathematically formulated as follows:
                                                                                                         ki+1 = α × k2i sin ðπ:ki Þ,                 ð24Þ
                    T̂ i
                       +
                           = T max + T min − T +i ,                           ð22Þ
                                                                                     where ki+1 describes a chaotic random number made by cur-
                                                                                     rent iteration and ki describes the chaotic random number
where T̂ i describes the opposite position of T +i and T min and
        +
                                                                                     made by the previous iteration. P = 2:3 defines the control
T max describe the variables upper and the lower bounds in                           parameter, and the k0 is considered a random value in the
the problem, respectively.                                                           range [0, 1].
    The new position provides a higher opportunity to get
the best solution. The second mechanism is the chaos map.                            4.1.4. Algorithm Authentication. In this paper, in order to
This mechanism utilizes chaotic conception to generate                               demonstrate the effectiveness of the suggested MTEO, eight
unpredictable variables instead of random variables. This                            standard benchmark functions have been selected which
mechanism accomplishes simple searches at a higher conver-                           are listed in Table 1. To provide a comprehensive analysis
gence rate than probability-based random searches [33]. By                           on the optimization performance, the results of the proposed
Computational and Mathematical Methods in Medicine 7
Table 2: The parameters setting utilized for the comparative diagnosis. In this study, three groups of features, i.e., geomet-
algorithms utilized in this study. ric features, statistical features, and texture features, are
utilized. In the following, the formulation of the utilized
Algorithm Parameter Value Algorithm Parameter Value features is explained:
!
Phabit 1 A [-1.5, 1.5]
Pimig T′
1 M N
[0,1] [1, 1000] Mean = 〠 〠 pði, jÞ, ð25Þ
MN i=1 j=1
Step size 1 M 2
BBO [36] EPO [38]
E 1 f [2, 3]
1 M N
I 1 S [0, 1.5] Variance = 〠 〠ðpði, jÞ − μÞ, ð26Þ
MN i=1 j=1
Pmutation 0.005 l [1.5, 2]
! pffiffiffiffiffiffiffiffiffiffiffiffiffiffiffiffiffi
F 0.6 M [0.5, 1] Std = variance, ð27Þ
LS [37] L 1 SHO [39] ! M N
h [5, 0]
g 20 Contrast = 〠 〠 p2 ði, jÞ, ð28Þ
i=1 j=1
M N
MTEO have been compared with some different new state- Area = 〠 〠 pði, jÞ, ð29Þ
of-the-art metaheuristics, including the Biogeography- i=1 j=1
Based Optimizer (BBO) [36], Locust Swarm Optimization
Area
(LS) [37], Emperor Penguin Optimizer (EPO) [38], Spotted Rectangularity = , ð30Þ
Hyena Optimize (SHO) [39], and original Thermal Exchange a×b
Optimization Algorithm [40]. Table 1 indicates the informa- pffiffiffiffiffiffiffiffiffiffi
2 Area
tion about the utilized test functions. Elongation = pffiffiffi , ð31Þ
The experiment environments are MATLAB 2019b, the a π
Core™ i7-4720HQ with 1.60 GHz CPU, 16 GB RAM with 4π × Area
Windows 10. Table 2 indicates the parameters setting utilized Irregularity index = , ð32Þ
Perimeter2
for the comparative algorithms utilized in this study.
This study, considers two important measures including Area
Form Factor = , ð33Þ
mean value and standard deviation value results from the a2
applying optimization algorithms on the benchmark functions 0:5
after 35 independent runs. To achieve a fair comparison Eccentricity = 2a−1 a2 − b2 , ð34Þ
between the proposed MTEO and the comparative algo- M N
rithms, the population size for all of them and the iteration Entropy = 〠 〠 pði, jÞ log pði, jÞ, ð35Þ
number are considered 100 and 200, respectively [41]. i=1 j=1
Table 3 illustrates the performance analysis of the comparison.
M N
As can be observed from Table 3, the proposed MTEO
algorithm provides the smallest value for the mean value of Perimeter = 〠 〠 bp ði, jÞ, ð36Þ
i=1 j=1
the benchmark functions. This shows that the proposed
MTEO algorithm has the highest accuracy compared with M N
pði, jÞ
the other algorithms. Also, the standard deviation value Homogeneity = 〠 〠 , ð37Þ
achieved by the algorithms shows the minimum value based i=1 j=1 1+∣i −j∣
on the MTEO algorithm that shows consequently the higher
M N
reliability of the proposed method against the other com-
Energy = 〠 〠 p2 ði, jÞ, ð38Þ
pared methods. i=1 j=1
4.2. Feature Extraction and Selection. After segmentation of M N
pði, jÞ − μr μc
the region of interest from the input images, the main infor- Correlation = 〠 〠 , ð39Þ
i=1 j=1 σr σc
mation (features) has been extracted from the images to
reduce the complexity of the diagnosis process by consider-
φ1 = η20 + η02 ,
ing only vital characteristics. In other words, feature extrac-
tion provides an easy way for demonstrating and analyzing φ2 = ðη20 − η02 Þ2 + 4η211 ,
the images. Recently, several algorithms have been per- ð40Þ
formed for proper feature extraction of the images. During φ3 = ðη30 − 3η12 Þ2 + ð3η21 − μ03 Þ2 ,
the feature extraction with different methods, all of the pat- φ4 = ðη30 + 3η12 Þ2 + ð3η21 + μ03 Þ2 ,
terns in the features should be searched and determined. In
this study, 20 different features are employed to extract the where bp signifies the external side length of the boundary
beneficial features from the segmented skin cancer for the pixel, pði, jÞ represents the pixel intensity value at point ði, jÞ,8 Computational and Mathematical Methods in Medicine
Table 3: The performance analysis of the comparative algorithms applied to studied standard benchmarks.
Algorithm
BBO [36] LS [37] EPO [38] SHO [39] TEO MTEO
Function
Min 2.615e-25 1.1100e-29 -3.2688e-26 2.3086e-27 2.4400e-30 9.2082e-32
f1
Std 1.448e-20 3.3826e-28 4.0754e-27 1.8827e-28 1.0062e-32 3.2681e-33
Min 6.0652e-4 8.3420e-3 5.6024e-3 1.4527e-4 2.4352e-5 7.6700e-5
f2
Std 4.1073e-5 3.0718e-4 1.0056e-4 2.4807e-5 3.0537e-6 1.0142e-5
Min -6.1442 -9.0464 -9.86 -8.0826 -9.86 -9.86
f3
Std 0.31 0.42 0.23 0.11 0.11 0.06
Min -6.1735 -17.020 -16.0035 -15.2816 -17.0095 -17.0572
f4
Std 3.015 1.183 2.280 4.089 1.520 0.980
Min 12.35e-10 1.486e-15 3.0765e-8 4.0802e-8 1.7085e-22 2.6827e-23
f5
Std 7.831e-11 3.0862e-16 1.1832e-9 5.4403e-9 3.7786e-24 6.0826e-25
Min 5.165e-10 3.1842e-11 1.0856e-20 1.0846e-9 3.0008e-20 4.5013e-22
f6
Std 8.186e-11 2.4253e-13 5.1738e-22 4.7080e-11 1.2058e-21 2.5387e-23
Min 3.512e-14 2.2621e-9 4.0305e-8 2.6517e-10 1.5670e-9 7.2837e-16
f7
Std 1.056e-15 3.0856e-11 3.8253e-9 2.1825e-12 2.0834e-10 3.1175e-18
Min 0.0056 -0.1361 -0.2381 -0.4735 -0.4680 -0.4162
f8
Std 0.542 0.356 0.274 0.704 0.141 0.089
MN describes best the image size, a and b represent the major
and the minor axis, respectively, and μ and σ represent the
mean value and the standard deviation value, respectively.
Because of the higher volume of feature information and
the presence of some useless features, some of these features
should be then eliminated before the classification stage. This
is done by using a method, called feature selection. To
achieve an optimal diagnosis system, the suggested modified
Thermal Exchange Optimization Algorithm has been utilized
that is explained in the following.
Feature selection is the process of reducing the data Figure 4: Some examples of the American Cancer Society (ACS)
dimension by choosing the best features and eliminating database [43].
the others. Furthermore, however, some features are useless,
but once they blend with other features, they have been
beneficial. This study uses a definite cost function where by dimensional space of data which indicates the class bound-
minimizing it, the optimal features can be selected. The cost aries and organizes them and can be altered with the rear-
function is formulated in the following: rangement of one of these two cases. The SVM provides the
best results for separating the data with the criterion for
placement of the support vectors. This classifier organizes
ðTP × TN Þ − ð FP × FN Þ the best separation surface by the following equation:
CF = pffiffiffiffiffiffiffiffiffiffiffiffiffiffiffiffiffiffiffiffiffiffiffiffiffiffiffiffiffiffiffiffiffiffiffiffiffiffiffiffiffiffiffiffiffiffiffiffiffiffiffiffiffiffiffiffiffiffiffiffiffiffiffiffiffiffiffiffiffiffiffiffiffiffiffiffiffiffiffiffiffiffiffiffiffiffiffiffiffiffiffiffiffiffiffiffiffiffiffiffiffi ,
ðTN + FPÞ × ðTP + FPÞ × ðTP + FN Þ × ðTN + FN ÞÞ
!
ð41Þ N
y = sgn 〠 yi αi K ðx, xi Þ + b , ð42Þ
i=1
where TP, FP, TN, and FN represent the true positive, false
positive, true negative, and false negative, respectively.
The main idea is to minimize the above function. This is where Kðx, xi Þ describes a kernel function, x signifies a test
performed by the proposed modified Thermal Exchange set vector with d dimensions, xi describes the ith training
Optimization Algorithm. set vector, y represents the output class by labeling -1 or 1,
N is the number of the training set, and b and α = ½α1 ⋯ αN
5. Classification represent the model parameters, respectively.
The present study uses SVM for the classification of the
The classification in this study is based on the Support Vector extracted features achieved by the feature selection in the pre-
Machine (SVM). The SVM consists of a set of points in the n- vious stage into two parts of healthy and cancerous groups.Computational and Mathematical Methods in Medicine 9
Input skin Noise Image Morphological
Start
cancer images reduction thresholding operation
Classification Feature selection by Feature
End Final results
by SVM MTEO algorithm extraction
Figure 5: The pipeline of the proposed methodology.
Table 4: The validation results of the compared method for skin including PPV, NPV, specificity, accuracy, and sensitivity
cancer diagnosis. are used for validation that is formulated as follows:
Performance metric correctly detected skin cancer cases
Method
NPV PPV Specificity Accuracy Sensitivity PPV = , ð43Þ
detected skin cancer cases
PSO 93.69 89.19 88.29 88.29 90.99
m-Skin Doctor 83.87 65.76 61.26 81.98 83.78 correctly detected healthy skin cases
NPV = , ð44Þ
GFAC 88.28 77.48 82.88 86.48 89.19 detected healthy skin cases
ANN 82.88 58.56 56.76 67.57 81.98
correctly detected healthy skin cases
GA 85.58 74.77 79.28 81.08 79.28 Specificity = , ð45Þ
total healthy skin cases
Proposed
93.69 85.58 89.19 92.79 90.99
method correctly detected cases
Accuracy = , ð46Þ
total cases
correctly detected skin cancer cases
6. Results and Discussions Sensitivity = : ð47Þ
Total skin cancer cases
The main purpose of this study is to present a computer-
To give a fair analysis on the proposed method, its results
aided automatic method for optimal diagnosis of skin cancer
have been compared with some different state-of-the-art
from the dermoscopy images. The idea is to utilize a
methods including the Particle Swarm Optimization- (PSO-)
metaheuristic-based method to achieve the best feature selec-
based method [44], m-Skin Doctor [45], GFAC [46], ANN
tion, and consequently the best diagnosis.
[47], and Genetic Algorithm (GA) [42]. The results of the
validation are tabulated in Table 4.
6.1. Database. To validate the proposed skin cancer diagnosis It can be observed from Table 4 that the proposed opti-
system, the so-called American Cancer Society (ACS) data- mized methodology with 92.79% accuracy has the highest
base has been employed. This database contains 68 pairs of precision against the other comparative methods. Similarly,
XLM and TLM images that are collected from the Nevoscope with 90.99% sensitivity, it has proper reliability compared
system. 51 XLM images and 60 TLM images have been man- with the other methods. This is also proved for the specificity,
ually classified by a dermatologist since other images do not NPV, and PPV compared with the others. The higher value
show pigmentation [42]. Therefore, the validation has been of NPV and PPV including 93.69% and 85.58%, respectively,
based on comparing our results with these manually seg- which are the highest among the comparative methods, pro-
mented results. For giving less complexity to the analysis, vides the higher prevalence of the condition to diagnose the
all of the images are resized to 256 to 256 pixels. Some exam- likelihood of a test cancer diagnosis system. Finally, the better
ples of this database are given in Figure 4 [43]. results of the sensitivity and specificity for the proposed
method indicate the suggested method’s higher prevalence-
6.2. Simulation Results. The present study in this subsection independent results.
has been verified on the ACS database, and the results have
been validated based on some different state-of-the-art tech- 7. Conclusions
niques. Simulations have been validated by the MATLAB
2019b environment with the following hardware configura- Skin cancer is one of the most dangerous diseases among dif-
tion: Core™ i7-4720HQ 1.60 GHz with 16 GB RAM. The ferent cancers in the world. However, early detection of this
overall procedure of the suggested method is illustrated in disease can be so beneficial for cancer treatment. In the pres-
Figure 5. ent study, a new hierarchical methodology was proposed for
The present study uses 85% of the data for training and the optimal diagnosis of skin cancer from dermoscopy
15% for testing the data. The training stage is based on apply- images. According to the suggested method, after performing
ing 750 iterations and is iterated 20 times independently to noise reduction of the input dermoscopy images, the consid-
achieve a guaranteed result. Five measurement indicators ered area has been segmented based on a simple Otsu. Then,10 Computational and Mathematical Methods in Medicine
feature extraction has been performed to the processed image of disease (GBD),” European Journal of Public Health, vol. 30,
to extract valuable features from the images. To provide an no. 5, pp. 1026-1027, 2020.
optimized result, the best features have been selected by a [6] R. Pugalenthi, M. Rajakumar, J. Ramya, and V. Rajinikanth,
modified metaheuristic method, called the Modified Thermal “Evaluation and classification of the brain tumor MRI using
Exchange Optimization Algorithm to modify the network machine learning technique,” Journal of Control Engineering
performance in terms of precision and consistency. Final and Applied Informatics, vol. 21, no. 4, pp. 12–21, 2019.
results were obtained by applying support vector machine [7] V. Rajinikanth and S. C. Satapathy, “Segmentation of ischemic
as the final classifier. To give a proper validation, the results stroke lesion in brain MRI based on social group optimization
of the proposed method were applied to the American Can- and Fuzzy-Tsallis entropy,” Arabian Journal for Science and
cer Society (ACS) database, and its results were compared Engineering, vol. 43, no. 8, pp. 4365–4378, 2018.
with some different methods including Particle Swarm Opti- [8] A. Costa, Y. Kieffer, A. Scholer-Dahirel et al., “Fibroblast het-
mization- (PSO-) based method, m-Skin Doctor, GFAC, erogeneity and immunosuppressive environment in human
breast cancer,” Cancer cell, vol. 33, no. 3, pp. 463–479. e10,
ANN, and Genetic Algorithm (GA). The final results indi-
2018.
cated that according to different measurement indicators,
[9] U. R. Acharya, S. L. Fernandes, J. E. WeiKoh et al., “Automated
the proposed methodology has the best results for the other
detection of Alzheimer’s disease using brain MRI images–a
compared methods. As can be observed from the explana- study with various feature extraction techniques,” Journal of
tions, the proposed method has good results for skin cancer Medical Systems, vol. 43, no. 9, p. 302, 2019.
detection. However, this can be an inspiration to our future
[10] N. S. M. Raja, S. Fernandes, N. Dey, S. C. Satapathy, and
work to use different hybrid and developed versions of differ- V. Rajinikanth, “Contrast enhanced medical MRI evaluation
ent new computational intelligence algorithms like the using Tsallis entropy and region growing segmentation,” Jour-
Monarch Butterfly Optimization (MBO) [48], Earthworm nal of Ambient Intelligence and Humanized Computing, pp. 1–
Optimization Algorithm (EWA) [49], Elephant Herding 12, 2018.
Optimization (EHO) [50], Moth Search (MS) algorithm [11] F. R. S. Navid and R. N. Ghadimi, “A hybrid neural network–
[51], Slime Mold Algorithm (SMA) [52], and Harris hawks world cup optimization algorithm for melanoma detection,”
optimization (HHO) [53] to improve the system efficiency. Open Medicine, vol. 13, pp. 9–16, 2018.
[12] R. Navid, A. Mohsen, K. Maryam et al., “Computer-aided
Data Availability diagnosis of skin cancer: a review,” Current Medical Imaging,
vol. 16, no. 7, pp. 781–793, 2020.
The authors of this paper thank the contributors of the PH2 [13] Y. Sugiarti, J. Na’am, D. Indra, and J. Santony, “An artificial
skin cancer database. The major part of the data considered neural network approach for detecting skin cancer,” TEL-
to support the findings of this study is collected from the KOMNIKA Telecommunication Computing Electronics and
PH2 database. Control, vol. 17, no. 2, pp. 788–793, 2019.
[14] Y. Zhi, W. Weiqing, W. Haiyun, and R. Navid, “New
Conflicts of Interest approaches for regulation of solid oxide fuel cell using
dynamic condition approximation and STATCOM,” Interna-
The authors declare that they have no conflicts of interest. tional Transactions on Electrical Energy Systems, vol. 31, article
e12756, 2021.
Acknowledgments [15] A. Esteva, B. Kuprel, R. A. Novoa et al., “Dermatologist-level
classification of skin cancer with deep neural networks,”
This research is supported by the Educational Science Nature, vol. 542, no. 7639, pp. 115–118, 2017.
Foundation of Jiangxi Province (# 41562019). [16] S. C. Satapathy, N. S. M. Raja, V. Rajinikanth, A. S. Ashour,
and N. Dey, “Multi-level image thresholding using Otsu and
chaotic bat algorithm,” Neural Computing and Applications,
References vol. 29, no. 12, pp. 1285–1307, 2018.
[1] N. Razmjooy, V. V. Estrela, and H. J. Loschi, “Entropy-based [17] V. Rajinikanth and M. Couceiro, “RGB histogram based color
breast cancer detection in digital mammograms using world image segmentation using firefly algorithm,” Procedia Com-
cup optimization algorithm,” International Journal of Swarm puter Science, vol. 46, pp. 1449–1457, 2015.
Intelligence Research (IJSIR), vol. 11, no. 3, pp. 1–18, 2020. [18] J. Salmon, R. Willett, and E. Arias-Castro, “A two-stage
[2] Q. Liu, Z. Liu, S. Yong, K. Jia, and R. Navid, “Computer-aided denoising filter: the preprocessed Yaroslavsky filter,” in 2012
breast cancer diagnosis based on image segmentation and IEEE Statistical Signal Processing Workshop (SSP), pp. 464–
interval analysis,” Automatika, vol. 61, no. 3, pp. 496–506, 467, Ann Arbor, MI, USA, 2012.
2020. [19] R. Navid, B. S. Mousavi, B. Sadeghi, and M. Khalilpour, “Image
[3] A. Hu and R. Navid, “Brain tumor diagnosis based on meta- thresholding optimization based on imperialist competitive
heuristics and deep learning,” International Journal of Imaging algorithm,” in 3rd Iranian Conference on Electrical and Elec-
Systems and Technology, vol. 31, no. 2, pp. 657–669, 2020. tronics Engineering (ICEEE2011), Qom, Iran, 2011.
[4] Z. Xu, F. R. Sheykhahmad, N. Ghadimi, and R. Navid, “Com- [20] R. Navid, M. Ashourian, and Z. Foroozandeh, Metaheuristics
puter-aided diagnosis of skin cancer based on soft computing and Optimization in Computer and Electrical Engineering,
techniques,” Open Medicine, vol. 15, no. 1, pp. 860–871, 2020. Springer International Publishing, 2021.
[5] C. Mattiuzzi and G. Lippi, “Cancer statistics: a comparison [21] R. Navid, V. V. Estrela, H. J. Loschi, and W. Fanfan, “A Com-
between world health organization (WHO) and global burden prehensive Survey of New Meta-Heuristic Algorithms,” inComputational and Mathematical Methods in Medicine 11
Recent Advances in Hybrid Metaheuristics for Data Clustering, [38] G. Dhiman and V. Kumar, “Emperor penguin optimizer: a
Wiley Publishing, 2019. bio-inspired algorithm for engineering problems,” Knowl-
[22] M. Ramezani, D. Bahmanyar, and R. Navid, “A new optimal edge-Based Systems, vol. 159, pp. 20–50, 2018.
energy management strategy based on improved multi- [39] G. Dhiman and V. Kumar, “Spotted hyena optimizer: a novel
objective antlion optimization algorithm: applications in smart bio-inspired based metaheuristic technique for engineering
home,” SN Applied Sciences, vol. 2, no. 12, pp. 1–17, 2020. applications,” Advances in Engineering Software, vol. 114,
[23] M. Khishe and M. R. Mosavi, “Chimp optimization algo- pp. 48–70, 2017.
rithm,” Expert Systems with Applications, vol. 149, article [40] M. Jamil and X.-S. Yang, “A literature survey of benchmark
113338, 2020. functions for global optimisation problems,” International
[24] A. Hatamlou, “Black hole: a new heuristic optimization Journal of Mathematical Modelling and Numerical Optimisa-
approach for data clustering,” Information Sciences, vol. 222, tion, vol. 4, no. 2, pp. 150–194, 2013.
pp. 175–184, 2013. [41] M. S. Doshi, Automated Segmentation of Skin Cancer Images,
[25] A. Askarzadeh, “A novel metaheuristic method for solving University of Houston, 2004.
constrained engineering optimization problems: crow search [42] Q. U. Ain, H. Al-Sahaf, B. Xue, and M. Zhang, “A genetic pro-
algorithm,” Computers & Structures, vol. 169, pp. 1–12, 2016. gramming approach to feature construction for ensemble
[26] A. Kaveh, A. D. Eslamlou, and N. Khodadadi, “Dynamic water learning in skin cancer detection,” in Proceedings of the 2020
strider algorithm for optimal design of skeletal structures,” Genetic and Evolutionary Computation Conference,
Periodica Polytechnica Civil Engineering, vol. 64, no. 3, pp. 1186–1194, Cancun, Mexico, 2020.
pp. 904–916, 2020. [43] ACS, Skin Cancer Database, 2019, https://www.cancer.org/.
[27] M. Mani, O. Bozorg-Haddad, and X. Chu, “Ant lion optimizer [44] T. Y. Tan, L. Zhang, S. C. Neoh, and C. P. Lim, “Intelligent skin
(ALO) algorithm,” in Advanced Optimization by Nature- cancer detection using enhanced particle swarm optimiza-
Inspired Algorithms, pp. 105–116, Springer, 2018. tion,” Knowledge-Based Systems, vol. 158, pp. 118–135, 2018.
[28] A. Kaveh and A. Dadras, “A novel meta-heuristic optimization [45] M. A. Taufiq, N. Hameed, A. Anjum, and F. Hameed, “m-Skin
algorithm: thermal exchange optimization,” Advances in Engi- Doctor: a mobile enabled system for early melanoma skin can-
neering Software, vol. 110, pp. 69–84, 2017. cer detection using support vector machine,” in eHealth 360°,
[29] A. Kaveh and A. Dadras, “Structural damage identification pp. 468–475, Springer, 2017.
using an enhanced thermal exchange optimization algorithm,” [46] T. Sreelatha, M. Subramanyam, and M. G. Prasad, “Early
Engineering Optimization, vol. 50, no. 3, pp. 430–451, 2018. detection of skin cancer using melanoma segmentation tech-
[30] A. Kaveh, A. Dadras, and T. Bakhshpoori, “Improved thermal nique,” Journal of medical systems, vol. 43, no. 7, p. 190, 2019.
exchange optimization algorithm for optimal design of skeletal
[47] T. Kanimozhi and A. Murthi, “Computer aided melanoma
structures,” Smart Structures and Systems, vol. 21, no. 3,
skin cancer detection using artificial neural network classifier,”
pp. 263–278, 2018.
Singaporean Journal of Scientific Research (SJSR), Journal of
[31] Z. Xing and H. Jia, “Modified thermal exchange optimization Selected Areas in Microelectronics (JSAM), vol. 8, no. 2,
based multilevel thresholding for color image segmentation,” pp. 35–42, 2016.
Multimedia Tools and Applications, vol. 79, no. 1-2,
[48] G.-G. Wang, S. Deb, and Z. Cui, “Monarch butterfly optimiza-
pp. 1137–1168, 2020.
tion,” Neural Computing and Applications, vol. 31, no. 7,
[32] H. R. Tizhoosh, “Opposition-based learning: a new scheme for pp. 1995–2014, 2019.
machine intelligence,” in International conference on computa-
tional intelligence for modelling, control and automation and [49] G.-G. Wang, S. Deb, and L. D. S. Coelho, “Earthworm optimi-
international conference on intelligent agents, web technologies sation algorithm: a bio-inspired metaheuristic algorithm for
global optimisation problems,” International Journal of Bio-
and internet commerce (CIMCA-IAWTIC'06), vol. 1, pp. 695–
Inspired Computation, vol. 12, no. 1, pp. 1–22, 2018.
701, Vienna, Austria, 2005.
[33] G. Zhang, C. Xiao, and R. Navid, “Optimal parameter extrac- [50] G.-G. Wang, S. Deb, and L. D. S. Coelho, “Elephant herding
tion of PEM fuel cells by meta-heuristics,” International Jour- optimization,” in 2015 3rd International Symposium on Com-
nal of Ambient Energy, pp. 1–10, 2020. putational and Business Intelligence (ISCBI), pp. 1–5, Bali,
Indonesia, 2015.
[34] Z. Yuan, W. Wang, H. Wang, and R. Navid, “A new technique
for optimal estimation of the circuit-based PEMFCs using [51] D. Pelusi, R. Mascella, L. Tallini, J. Nayak, B. Naik, and
developed Sunflower Optimization Algorithm,” Energy Y. Deng, “An Improved Moth-Flame Optimization algorithm
Reports, vol. 6, pp. 662–671, 2020. with hybrid search phase,” Knowledge-Based Systems, vol. 191,
p. 105277, 2020.
[35] M.-W. Tian, S.-R. Yan, S.-Z. Han, S. Nojavan,
K. Jermsittiparsert, and R. Navid, “New optimal design for a [52] S. Li, H. Chen, M. Wang, A. A. Heidari, and S. Mirjalili, “Slime
hybrid solar chimney, solid oxide electrolysis and fuel cell mould algorithm: a new method for stochastic optimization,”
based on improved deer hunting optimization algorithm,” Future Generation Computer Systems, vol. 111, pp. 300–323,
Journal of Cleaner Production, vol. 249, article 119414, 2020. 2020.
[36] D. Simon, “Biogeography-based optimization,” IEEE Transac- [53] A. A. Heidari, S. Mirjalili, H. Faris, I. Aljarah, M. Mafarja, and
tions on Evolutionary Computation, vol. 12, no. 6, pp. 702–713, H. Chen, “Harris hawks optimization: algorithm and applica-
2008. tions,” Future Generation Computer Systems, vol. 97,
[37] E. Cuevas, F. Fausto, and A. González, “The Locust Swarm pp. 849–872, 2019.
Optimization Algorithm,” in New Advancements in Swarm
Algorithms: Operators and Applications, pp. 139–159,
Springer, 2020.You can also read