Multi-institutional TSA-amplified Multiplexed Immunofluorescence Reproducibility Evaluation (MITRE) Study - Journal for ImmunoTherapy of Cancer
←
→
Page content transcription
If your browser does not render page correctly, please read the page content below
Open access Original research
Multi-institutional TSA-amplified
J Immunother Cancer: first published as 10.1136/jitc-2020-002197 on 15 July 2021. Downloaded from http://jitc.bmj.com/ on October 19, 2021 by guest. Protected by copyright.
Multiplexed Immunofluorescence
Reproducibility Evaluation
(MITRE) Study
Janis M Taube,1 Kristin Roman,2 Elizabeth L Engle,1 Chichung Wang,2
Carmen Ballesteros-Merino,3 Shawn M Jensen,3 John McGuire,2 Mei Jiang,4
Carla Coltharp,2 Bethany Remeniuk ,2 Ignacio Wistuba,4 Darren Locke,5
Edwin R Parra,4 Bernard A Fox,3 David L Rimm ,6 Cliff Hoyt2
To cite: Taube JM, ABSTRACT Conclusions Assay optimization yielded highly sensitive,
Roman K, Engle EL, et al. Background Emerging data suggest predictive reproducible mIF characterization of the PD-1/PD-L1 axis
Multi-institutional TSA- biomarkers based on the spatial arrangement of cells across multiple sites. High concordance was observed
amplified Multiplexed across sites for measures of density of specific IC subsets,
or coexpression patterns in tissue sections will play an
Immunofluorescence
important role in precision immuno-oncology. Multiplexed measures of coexpression and proximity with single-cell
Reproducibility Evaluation
(MITRE) Study. Journal for immunofluorescence (mIF) is ideally suited to such resolution.
ImmunoTherapy of Cancer assessments. Standardization and validation of an end-
2021;9:e002197. doi:10.1136/ to-end workflow that supports multisite trials and clinical
jitc-2020-002197 laboratory processes are vital. Six institutions collaborated BACKGROUND
to: (1) optimize an automated six-plex assay focused on PD-1/PD- L1 immune checkpoint inhibi-
►► Additional supplemental the PD-1/PD-L1 axis, (2) assess intersite and intrasite tion has revolutionized cancer treatment.
material is published online only. reproducibility of staining using a locked down image However, the majority of patients unfortu-
To view, please visit the journal analysis algorithm to measure tumor cell and immune cell
online (http://dx.d oi.org/10.
nately still do not respond. There is a need
(IC) subset densities, %PD-L1 expression on tumor cells
1136/j itc-2020-0 02197). for predictive assays that can be used to deter-
(TCs) and ICs, and PD-1/PD-L1 proximity assessments.
Methods A six-plex mIF panel (PD-L1, PD-1, CD8, CD68, mine which therapeutic regimen is most
Accepted 13 June 2021 FOXP3, and CK) was rigorously optimized as determined likely to benefit a given patient. The most
by quantitative equivalence to immunohistochemistry commonly used approach for preselecting
(IHC) chromogenic assays. Serial sections from tonsil patients for anti-PD-(L)1 therapy is single-
and breast carcinoma and non-small cell lung cancer stain chromogenic immunohistochemistry
(NSCLC) tissue microarrays (TMAs), TSA-Opal fluorescent (IHC) for PD-L1 expression. There are now
detection reagents, and antibodies were distributed to numerous FDA-approved assays that test for
the six sites equipped with a Leica Bond Rx autostainer PD-L1 expression within the pretreatment
and a Vectra Polaris multispectral imaging platform. tumor microenvironment (TME).1
Tissue sections were stained and imaged at each site and
PD-L1 IHC assays enrich for response to
delivered to a single site for analysis. Intersite and intrasite
PD-1/L1 blockade; however, PD- L1 IHC
reproducibility were assessed by linear fits to plots of cell
densities, including %PDL1 expression by TCs and ICs in is imperfect. Approximately 10%–15% of
the breast and NSCLC TMAs. patients with PD- L1-
negative tumors may
Results Comparison of the percent positive cells for each respond to therapy, and ~50% patients with
marker between mIF and IHC revealed that enhanced PD-L1+ tumors do not respond.2 There are
amplification in the mIF assay was required to detect also other challenges associated with the
low-level expression of PD-1, PD-L1, FoxP3 and CD68. current PD- L1 testing environment. The
© Author(s) (or their Following optimization, an average equivalence of 90% numerous PD-L1 IHC assays in use employ
employer(s)) 2021. Re-use was achieved between mIF and IHC across all six assay different scoring algorithms. Some score
permitted under CC BY-NC. No markers. Intersite and intrasite cell density assessments
commercial re-use. See rights membranous PD- L1 expression on tumor
showed an average concordance of R2=0.75 (slope=0.92)
and permissions. Published by cells (TCs) only, some focus on immune cell
BMJ.
and R2=0.88 (slope=0.93) for breast carcinoma,
(IC) PD-L1 expression, while yet others assess
respectively, and an average concordance of R2=0.72
For numbered affiliations see
(slope=0.86) and R2=0.81 (slope=0.68) for NSCLC. a combination of these features.3 Notably,
end of article. pathologists have poor interobserver concor-
Intersite concordance for %PD-L1+ICs had an average R2
Correspondence to value of 0.88 and slope of 0.92. Assessments of PD-1/PD- dance when attempting to score PD- L1
Janis M Taube; L1 proximity also showed strong concordance (R2=0.82; expression on ICs, especially in low expres-
jtaube1@jhmi.e du slope=0.75). sion ranges.4 PD-L1 can also be expressed in
Taube JM, et al. J Immunother Cancer 2021;9:e002197. doi:10.1136/jitc-2020-002197 1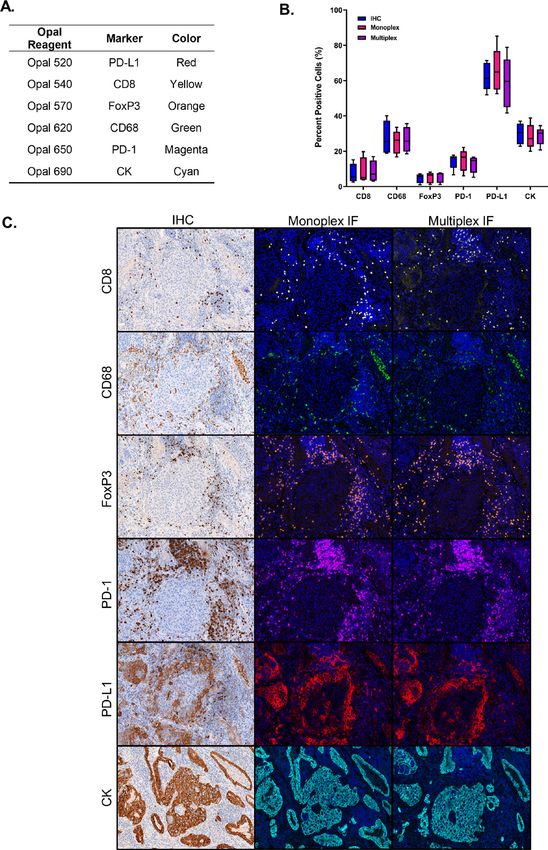
Open access
the TME by both adaptive and constitutive mechanisms,5 and TMAs for breast cancer and NSCLC were distributed
J Immunother Cancer: first published as 10.1136/jitc-2020-002197 on 15 July 2021. Downloaded from http://jitc.bmj.com/ on October 19, 2021 by guest. Protected by copyright.
and it is thought that anti-PD-1/PD-L1 acts primarily on to each site. Each laboratory stained their allotment of
those cases with an adaptive mechanism of display.6 Such slides in two different staining batches to facilitate assess-
an adaptive pattern of PD-L1 expression is typically repre- ments of intrasite as well as intersite reproducibility. Slides
sented in the TME by detecting PD-1 adjacent to PD-L1, were imaged at each site in order to qualitatively confirm
and accordingly, biomarkers representing their combined successful staining. Stained slides were then shipped to a
expression in close proximity show improved predictive single site for final multispectral image acquisition and
ability compared with those that measure PD-L1 expres- subsequent quantitative data analysis. The image analysis
sion alone.7 8 was conducted in a blinded fashion to avoid potential bias
Multispectral, multiplex immunofluorescent (mIF) related to study site.
imaging approaches are capable of characterizing the
TME in a way that overcomes the limitations detailed Pathology specimens
above. Multispectral mIF allows for the simultaneous Formalin-fixed paraffin-embedded tissue (FFPE) sections
quantitative characterization of six to eight markers from archival tonsil tissue and the breast and NSCLC
across a single formalin-fixed paraffin-embedded tissue TMAs were cut in 4 µm serial sections onto positively
section. Application of this technology to characterizing charged slides. The NSCLC TMA block consisted of 144
PD-1/PD-L1 axis expression can thus aid in the accurate cores, and the breast cancer TMA block contained 168
quantification of %PD- L1 expression across the TME cores. Each core was 0.6 mm in diameter and represented
as well as identify whether it is a TC or IC expressing an individual patient. Three of the cores on each of
PD-L1. It also allows for characterization of the ‘spatial the two TMAs were used as on-slide controls for setting
biology’ of a tumor sample, such as interrogating PD-1/ thresholds of PD-L1 positivity. TMAs were supplied by
PD-L1 cell-to-
cell spatial interactions within the TME. Yale Pathology Tissue Services (New Haven, Connecticut,
Initial studies from individual institutions on tumor USA). Each of the six study sites received 10 tonsil slides,
specimens from patients with non-small cell lung cancer two slides from the breast cancer TMAs, and two slides
(NSCLC),9 10 head and neck squamous cell carcinoma,11 from the NSCLC TMAs. For a detailed description of
Hodgkin lymphoma,12 Merkel cell carcinoma,8 13 and tissue section serialization and distribution, please see
melanoma,7 14 15 among others, reinforce the potential online supplemental table 1.
of mIF to detect spatially resolved immunoactive features
within the TME and associating these findings with clin- mIF assay reagents
ical outcomes. Primary antibodies included those to CD8, CD68, FoxP3,
Before mIF technology could potentially be translated pan-CK (clone AE1/3), PD-1, and PD-L1 (table 1). All
into clinical practice, it is vital to standardize and validate sites used primary antibodies from the same lot. For CD8
an end-to-end workflow that supports multisite trials and and CK: Akoya’s Opal Polymer anti-mouse and -rabbit
clinical laboratory processes. To that end, an optimized HRP (1:5, ARH1001EA) was used for secondary detec-
six-
plex mIF assay for characterizing the PD-1/PD- L1 tion. Leica Biosystems PowerVision Poly-HRP antimouse
axis was developed. The assay included markers for PD-1, was used for FoxP3 and CD68 (50%, PV6114, Leica Biosys-
PD-L1, CD8, FoxP3, cytokeratin (CK) (tumor marker), tems) and Poly-HRP anti-rabbit was used for PD-1 and
and CD68 and was optimized using rigorous, quantitative PD-L1 (50%, PV6119, Leica). Each site received an Opal
assessments of equivalence to chromogenic IHC staining, 7-color Automated IHC Detection Kit (NEL821001KT,
that is, the current clinical ‘gold standard’.16 A total of Akoya Biosciences, Marlborough, Massachusetts, USA)
six laboratories participated, including Johns Hopkins containing the following TSA fluorophores: Opal 520,
University, Yale University, MD Anderson Cancer Center, Opal 540, Opal 570, Opal 620, Opal 650, Opal 690, and
Earle A. Chiles Research Institute, Akoya Biosciences, and spectral DAPI. All fluorophores and DAPI were prepared
Bristol-Myers Squibb. Reproducibility was assessed within according to manufacturer guidelines.
and across sites using control tissues and tissue microar-
rays (TMAs) of breast carcinoma and NSCLC. Concor- mIF Assay Development and Staining
dance was tested for measurements of cell densities, The six-plex mIF assay was optimized as previously
%PD-L1 coexpression by cell type (TC vs IC), and PD-1/ described.15 In brief, for each antibody, staining parame-
PD-L1 proximity. ters were first optimized using single stain, chromogenic
IHC on tonsil sections. Next, each primary antibody was
paired to a select TSA fluorophore and single stain, that is,
METHODS ‘monoplex’ IF staining was performed. TSA fluor-marker
Study design pairings were based on known brightness rankings, with
Six laboratories participated in the development and more abundant markers paired with less bright fluoro-
assessment of intersite and intrasite staining reproduc- phores (Opals 570, 620, and 690). TSA dilutions started
ibility and six-plex mIF assay concordance for quantifying at 1:150 and were titrated to achieve the recommended
the PD-1/PD- L1 axis. Each site was supplied with the target range of 10–30 in normalized brightness counts,
same assay reagents, and serial sections from tonsil tissue provided that a sensitivity equivalent to chromogenic IHC
2 Taube JM, et al. J Immunother Cancer 2021;9:e002197. doi:10.1136/jitc-2020-002197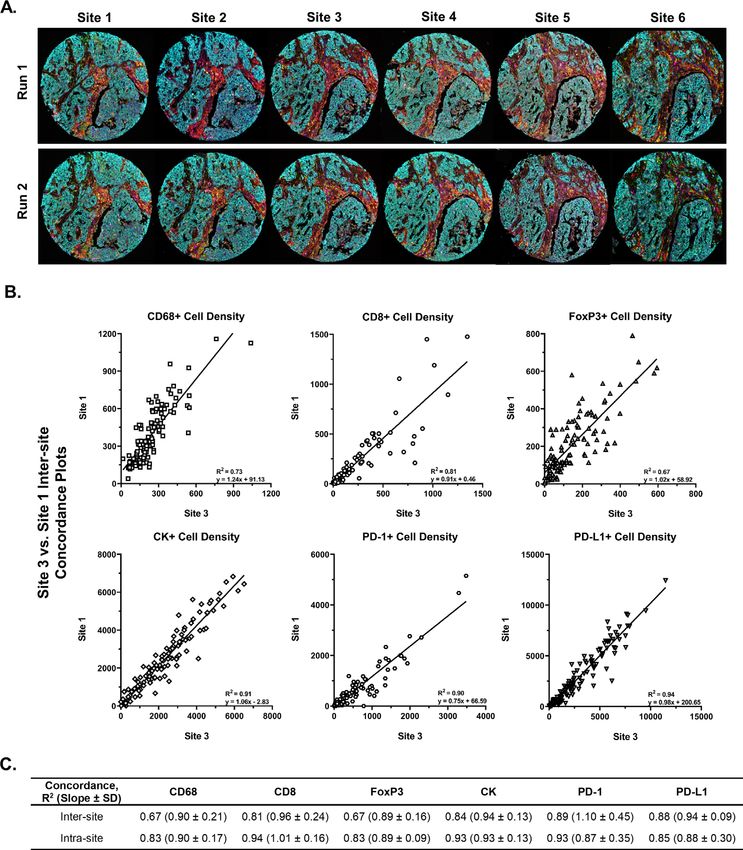
Open access
was maintained. Ten multispectral 20× high power fields
J Immunother Cancer: first published as 10.1136/jitc-2020-002197 on 15 July 2021. Downloaded from http://jitc.bmj.com/ on October 19, 2021 by guest. Protected by copyright.
Dilution
(HPFs) were then acquired from five archival NSCLC
1:150
1:150
1:150
1:150
1:150
1:300
specimens (total of 50 HPFs) using the Vectra Polaris.
The HPFs were carefully aligned across serial sections for
equivalence assessments of IF to IHC to ensure measure-
Lot number
ments were of the same tissue morphological regions.
2 566 920
2 556 626
2 553 339
2 567 659
2 581 789
2 566 905
Equivalency was based on image analysis-based counts of
cells positively stained for each of the six markers/total
cells in each HPF, that is, % positive cells for each marker,
using the inForm Tissue Finder cell phenotyping func-
tion. Of note, the cell counting algorithm for the chro-
TSA-Opal
mogenic IHC images was different from the algorithm
trained to count cells in the monoplex and multiplex IF
570
620
650
690
520
540
because the imagery differs based on how it was acquired.
For markers FoxP3, CD68, PD-1, and PD-L1, it was neces-
Opal Polymer
Opal Polymer
sary to change the secondary detection system from Opal
PowerVision
PowerVision
PowerVision
PowerVision
Polymer anti-mouse and -rabbit HRP to the Leica Power-
Vision Poly-HRP IHC Detection system to achieve equiva-
2° HRP
†This antibody is not purified and is supplied as crude tissue culture supernatant. As such, the antibody concentration is not available.
lent sensitivity to chromogenic IHC.
Following the successful conversion of the chromogenic
protocols to immunofluorescence, all the monoplex
immunofluorescence protocols were combined to form
Incubation (min)
a complete six-plex, seven-color assay panel. The stan-
dard seven-color TSA protocol template on the BOND
RX was used with modifications. Modifications included
that tissues underwent an initial antigen retrieval step
Final, optimized six-plex mIF assay conditions for characterizing the PD-1/PD-L1 axis
60
60
60
30
30
30
of ER2 at 100°C for 40 min, a double dispensing of the
TSA reagents (incubation time of 0 and 10 min), and that
diamidino-2-phenylindole (DAPI) was double dispensed
Novus Biologicals
Life Technologies
at a volume of 150 µL. Adjustments to the staining order
were made based on quantitative assessment of equiva-
lency to the monoplex imagery. The final protocol used
Vendor
Abcam
Abcam
to stain the tissues is provided in table 1.
Dako
CST
mIF Staining, Multispectral Image Acquisition and Quantitative
Analysis
*All antibodies were diluted using Akoya’s antibody diluent/blocking buffer.
Concentration*
All tonsil sections and TMAs underwent an initial 3-hour
baking step at 65°C. During this initial baking step, slides
were held in a slide rack in a vertical manner for the first
(µg/mL)
1.5 hours. They were then rotated to sit horizontally for
N/A†
4.97
5.83
300
0.8
0.5
the second 1.5 hours. A second bake and de-wax step was
then performed using a dewax solution (AR9222, Leica
Biosystems) on the BOND RX to ensure that all paraffin
EPR4877(2)
was removed.
AE1/AE3
236A/E7
PGM-1
Slides were then stained using the aforementioned
E1L3N
Clone
4B11
optimized, automated mIF staining protocol. Multispec-
tral images were acquired using the Vectra Polaris Auto-
mated Quantitative Pathology Imaging System. A set of
antibody
library slides were created in order to achieve accurate
FoxP3
PD-L1
spectral unmixing and data quantification of each Opal
CD68
PD-1
CD8
CK
fluorophore in inForm. Specifically, a library was gener-
1°
ated by staining serial sections of tonsil tissue with CD20
(clone L26, PM0044AA, Biocare Medical) and each indi-
Staining order
vidual fluorophore. Additionally, a tonsil serial section
was stained with DAPI and added to the library. Such an
Table 1
approach facilitates the capture of pure emission spectra,
which are then used in the unmixing process. Lastly, a
section that did not have any stain applied was used to
3
4
5
6
1
2
Taube JM, et al. J Immunother Cancer 2021;9:e002197. doi:10.1136/jitc-2020-002197 3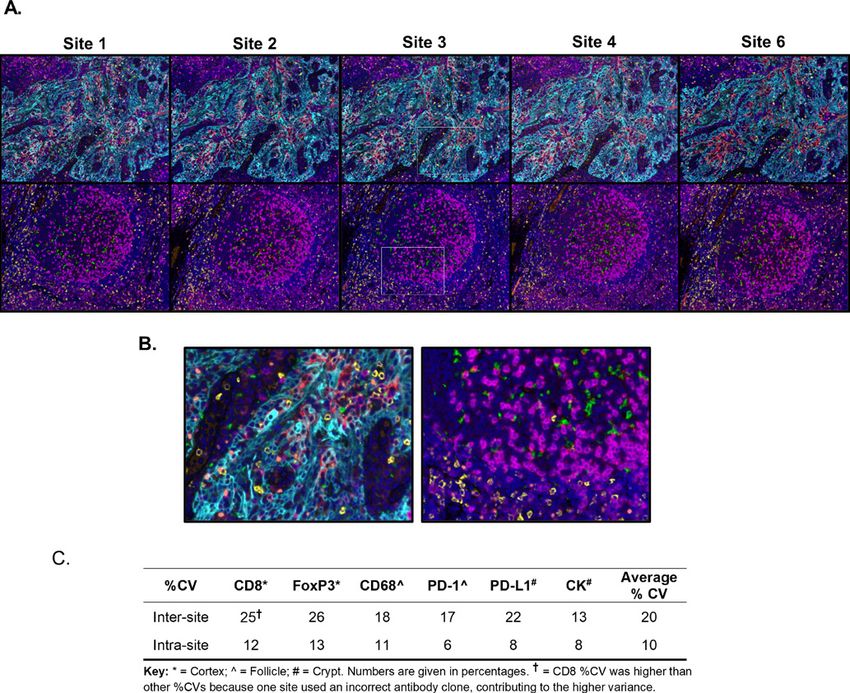
Open access
capture the background tissue autofluorescence. Prior to FoxP3 cells in each core from the breast and NSCLC
J Immunother Cancer: first published as 10.1136/jitc-2020-002197 on 15 July 2021. Downloaded from http://jitc.bmj.com/ on October 19, 2021 by guest. Protected by copyright.
processing, all images were assessed for quality control. TMAs were determined for each batch for each site.
Criteria for rejection included poor tissue quality, such Intersite concordance assessments were determined by
as tissue folds or missing tissue sections, and staining arti- averaging the cell densities for run 1 and run 2 for each
facts, including signal dropout and air bubbles. TMA core for each site. Averaged TMA core cell densities
For each project, all HPF images were processed and were then plotted against their respective counterparts
analyzed with inForm software (V.2.4.10). A single algo- for every site. Linear regression analysis was run, and the
rithm for spectral unmixing, cell segmentation, cell clas- slope, intercept, and R2 values were calculated. Any TMA
sification, that is, ‘phenotyping’, and quantification of core data that did not have an accompanying counter-
expression intensity was developed for each tissue type part was excluded from the analysis. The total intersite
(tonsil, breast and NSCLC), and the same algorithm was R2 value and slope concordance for each marker were
applied by a single site to all the cores within and across calculated by averaging all R2 values and slopes from each
TMAs for each tumor type. As a part of this process, cells site-to-site comparison.
were segmented into cytoplasmic, nuclear, and membrane Intrasite concordance compared the same TMA cores
compartments. For the purposes of determining whether for each site using run 1 data points as X and run 2 data
a cell was positive for a given marker, signal levels for points as Y. A simple linear regression was plotted onto
CD8, PD-L1, and PD-1 were measured in the membrane the data to determine the slope, intercept, and R2 value.
compartment, while CD68 and CK were measured in the Any cores that did not have both run 1 and run 2 data
cytoplasmic compartment. Lastly, FoxP3 signal levels were were removed from subsequent analysis. The total intr-
measured in the nuclear compartment. Once all images asite R2 value and slope were determined by averaging
were processed, the data were exported for further anal- across all sites for each marker.
ysis of IC densities, PD-L1 expression by cell type, and
PD-1/PD-L1 proximity in the R-script package phenoptr- Intersite concordance of percent PD-L1 expression and PD-1/
Reports (Akoya BioSciences). PD-L1 proximity analysis
The number of cells displaying the following markers and
mIF staining reproducibility on tonsil serial sections
marker combinations were determined for each TMA core:
Following an overview scan, 12 matching 20× HPFs were
PD-L1+ cells, PD-1+ cells, CD68+ cells, CK+ cells, CD68+/
selected on the 60 tonsil serial sections: four from the
PD-L1+ cells, and CK+/PD-L1+ cells. For the combinations,
cortex, four from the crypt/mantel, and four from the
a threshold was applied to the measured PD-L1 signal in
follicle. These microanatomic regions were selected to
each CK+ phenotype and each CD68+ phenotype to assign
capture areas enriched for the markers of interest, that
a cell as PD-L1+ versus PD-L1−. Three cores on each slide
is, cortex: CD8 and FoxP3; crypt: PD-L1 and CK; and the
of the breast and the lung TMAs were selected to serve
follicle: CD68 and PD-1. Cells phenotyped as ‘positive’ for
as on-slide controls. The threshold was normalized to the
each marker per HPF were aggregated, and the average
on-slide tissue controls to adjust for potential batch-to-batch
of the top quartile of signal intensity was determined. This
variation across sites and set thresholds of positivity. Percent
approach was chosen for its sensitivity in highlighting
PD-L1 positivity was calculated by the following calculation
potential variability in staining performance.
for each TMA core [(colocalized phenotype/single pheno-
Intersite and intrasite percent coefficients of variation
type) * 100]. Site-to-site percentages for %PD-L1 expression
(%CV) were determined for each marker. First, an average
by CK+ TCs and CD68+ macrophages were graphed, and
cell number/HPF for each marker was calculated for four
HPFs on each slide. The average cell numbers per slide using simple linear regression, the R2 value and slope were
were then used to calculate intersite and intrasite %CVs. interpolated. The total R2 and slope for %PD-L1/CD68+
The intersite %CV for each marker was determined by and %PD-L1/CK+ were calculated by averaging all intersite
first calculating the %CV of average cell numbers in six values.
serial sections distributed across the six sites (one slide The number of PD-1 cells within a 25 µm radius of a
per site), for a total of five groups. The %CVs for each PD-L1 cell was determined for every TMA core from each
marker were then averaged across the five groups, and site using phenoptrReports. Intersite concordance agree-
an intersite %CV was calculated for each marker (online ment was evaluated by determining the slope and fit (R2)
supplemental figure S1A). Intrasite %CV for each marker of a linear regression to scatter plots of data. The average
was determined by first calculating the %CV for average fit and slope were calculated by averaging all intersite
cell number per HPF across five serial sections from each values.
site. The %CVs from each site were then averaged (online
supplemental figure S1B). Statistical analysis
All data were analyzed and graphed using both Excel and
Intersite and intrasite concordance for cell density GraphPad Prism (V.8.3.0, GraphPad Company, San Diego,
assessments using TMAs California, USA). Data analysis was performed using R soft-
Densities (number of cells expressing a given marker/ ware V.3.6.3 with built-in packages and custom routines. P
tissue area (mm2)) of PD-L1, PD-1, CD68, CD8, CK, and valuesOpen access
J Immunother Cancer: first published as 10.1136/jitc-2020-002197 on 15 July 2021. Downloaded from http://jitc.bmj.com/ on October 19, 2021 by guest. Protected by copyright.
Figure 2 Intersite and intrasite reproducibility for the six-
plex mIF assay in tonsil tissue. (A) Representative low power
images from tonsil serial sections stained at each site.*
Yellow=CD8, orange=FoxP3, green=CD68, magenta=PD-1,
red=PD-L1 and cyan=CK (tumor marker). (B) High power
photomicrographs corresponding to white boxes in low-
power images showing staining patterns in the tonsillar
crypts (left) and follicles (right). (C) Average intersite and
intrasite CVs for each marker, as well as an average %CV
for all markers. These comparisons were performed on
only the top quartile of cells for each marker to provide
a sensitive measure of potential variability. *Site 5 was
excluded from this comparison due to a combination of mIF
assay run failure and delayed data submission. mIF, multiplex
immunofluorescent.
Figure 1 The multiplex immunofluorescent (mIF) assay IHC. Four of the six markers (CD68, FoxP3, PD-1, and
is comparable with monoplex IF and ‘gold standard’
PD-L1) required the use of Leica’s Powervision HRP
chromogenic IHC staining. (A) Six-plex mIF assay reagents
including the TSA-Opal and marker pairings, as well as secondary to achieve the same sensitivity as the optimized
the clone used for detecting each target. (B) Quantitative chromogenic IHC. The markers were then combined
comparison of percentage of cells phenotyped as ‘positive’ into the multiplex format, and the percent positive cells
for each marker by staining approach (chromogenic IHC, for each marker between chromogenic DAB, monoplex
monoplex IF, and multiplex IF). For each marker, 10 HPFs IF, and mIF demonstrated equivalence across all three
per sample (n=5 NSCLC archival specimens) were acquired, staining modalities (figure 1B and C). The assay took
and the % positive cells were averaged. Plot shows median approximately 3–4 months to optimize by the lead site.
and IQR, with whiskers showing min to max for each After it was optimized, the protocol was provided to the
marker. (C) Representative images for each marker showing
other five laboratories, where it was used without addi-
comparable staining patterns and cell densities on sequential
NSCLC slides stained with chromogenic IHC stains, tional modification.
monoplex IF, and the mIF assay. HPFs, high power fields; IF,
immunofluorescent; IHC, immunohistochemistry; NSCLC, Intersite and intrasite reproducibility of mIF assay in tonsil
non-small cell lung cancer. sections
Serial sections of tonsil stained with mIF by each of the
RESULTS six sites were evaluated for expression of each marker in
Multiplex fluorescence assay staining and validation against the assay (figure 2A and B). The average intersite staining
conventional chromogenic IHC coefficient of variation (CV) across all sites was 20% for
The objective of this step was to optimize a multispec- the top quartile of expression intensity, with CD8 and
tral mIF panel to achieve equivalent sensitivity to chro- FoxP3 displaying higher %CVs compared with the other
mogenic IHC for each individual marker. Markers were markers (figure 2C). Staining assessment revealed an
paired with Opal fluorophores that complimented their average total intrasite %CV of 10% across all six markers,
abundance and spatial location (figure 1A), and mono- with a maximum CV of 13% (figure 2C), indicating
plex IF stains were tested for equivalence to chromogenic minimal variability of staining within each site.
Taube JM, et al. J Immunother Cancer 2021;9:e002197. doi:10.1136/jitc-2020-002197 5Open access
J Immunother Cancer: first published as 10.1136/jitc-2020-002197 on 15 July 2021. Downloaded from http://jitc.bmj.com/ on October 19, 2021 by guest. Protected by copyright.
Figure 3 Strong intersite and intrasite concordance was observed for the cell lineages markers assessed in breast carcinoma
TMA. (A) A breast carcinoma TMA was cut into 12 serial sections. Two slides were provided to each of the six sites, with one
slide stained each of 2 days at each site. Images show the serial sections from a representative TMA core stained at each
site over 2 days and highlight the visual consistency of automated mIF assay staining results. (B) Representative intersite cell
density concordance plots for each marker, CD68, CD8, FOXP3, PD-1, PD-L1, and CK (tumor cells). The remaining intersite
and intrasite comparisons are shown in online supplemental figure S2. (C) Average intersite and intrasite concordance plots
densities of each cell lineage. Data shown as R2 (slope and SD of slope). The intersite and intrasite concordance results for cell
lineage markers assessed in the NSCLC TMA are shown in online supplemental figure S3. P values for all concordance values
are statistically significant. CK, cytokeratin; mIF, multiplex immunofluorescent ; NSCLC, non-small cell lung cancer; TMA, tissue
microarray.
Intersite and intrasite concordance for assessments of cell Intersite concordance plots for cell densities of PD-L1,
densities in tumor TMA sections PD-1, CD68, CD8, FoxP3, and CK were generated and
Once intersite and intrasite agreement was achieved consistent agreement was observed across all sites for
on tonsil, two serial sections of breast cancer TMAs each marker and in both tumor types (figure 3B and
and lung cancer TMAs were stained at each of the six C, online supplemental figures S2 and S3). The one
sites in two separate batches (run 1 and run 2). Strong exception was intersite and intrasite reproducibilities for
concordance in mIF staining patterns in tumor tissues CD68 in NSCLC, which showed an average R2 value of
was observed across all sites and batches (figure 3A). 0.47 and a slope of 0.54 and R2 of 0.67 and slope of 0.60,
6 Taube JM, et al. J Immunother Cancer 2021;9:e002197. doi:10.1136/jitc-2020-002197Open access
respectively. This is most likely due to the challenges of high reproducibility across six different laboratories for
J Immunother Cancer: first published as 10.1136/jitc-2020-002197 on 15 July 2021. Downloaded from http://jitc.bmj.com/ on October 19, 2021 by guest. Protected by copyright.
segmenting and subsequent enumeration of the CD68+ these key metrics.
macrophages, which often display irregular cell shapes. The first step in this muli-institutional effort was the
The intrasite concordances were slightly higher than the optimization of a robust, six-plex mIF assay for character-
intersite concordances. For example, the average intrasite ization of the PD-1/PD-L1 axis. The mIF assay described
agreement on the breast TMA among CD68 and FoxP3 herein was performed on a Leica Bond Rx autostainer.
was R2=0.83 (slopes=0.90 and 0.89), with PD- L1, PD-1, The six-plex assay can be performed on 30 slides at a
CK and CD8 having R2 values of 0.85 (slope=0.88), 0.93 time and takes approximately 12–13 hours to perform.
(slope=0.87), 0.93 (slope=0.93) and 0.94 (slope=1.01), As such, it fits into a daily schedule that includes sample
respectively (figure 3C). The average intersite concor- and instrument prep at the end of the day and running
dance for PD-L1, PD-1, CD68, CD8, and FoxP3 had R2 batches overnight, with sample imaging the subsequent
values ranging from 0.67 to 0.89 (slopes of 0.89–1.10), day. A guiding principle behind assay optimization was
with PD-1 displaying the strongest fit. The NSCLC TMA that the sensitivity of the mIF panel should be quantita-
core imagery, intrasite, and intersite concordance cell tively benchmarked against optimized conventional chro-
density data are provided in online supplemental figures mogenic IHC staining for each individual marker.15 16 19 20
S3. We found that with considered selection of secondary
antibodies for some of our markers, we were able to meet
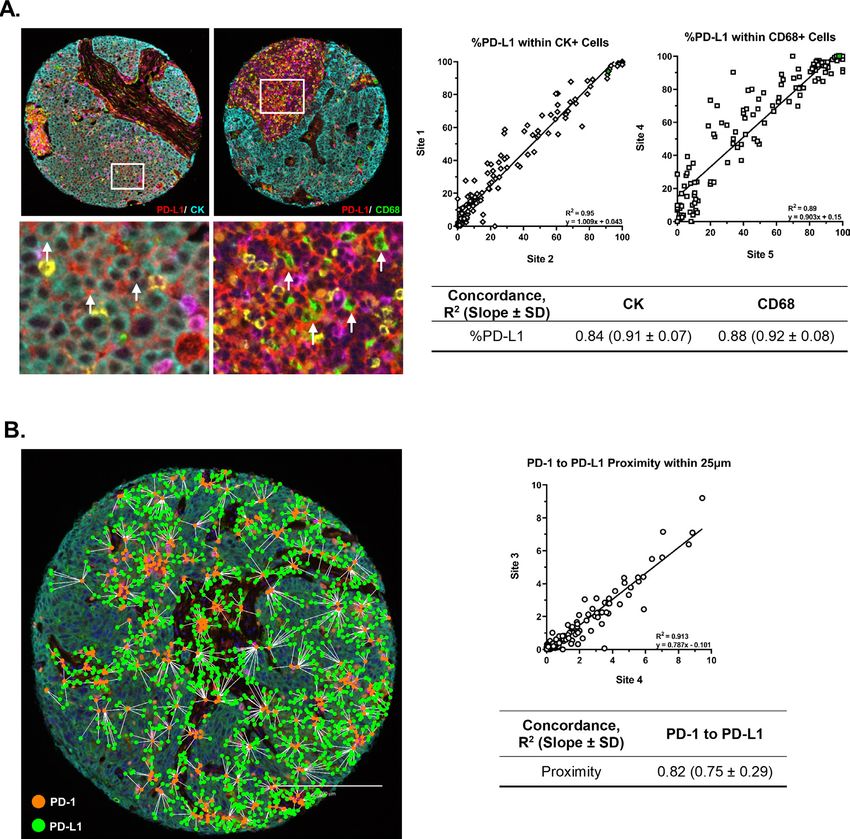
Intersite concordance of % PD-L1 expression by cell type and this standard, that is, all six stains in the mIF assay were
PD-1/PD-L1 proximity analysis comparable with single, chromogenic IHC stains, with
To demonstrate a higher level of staining reproducibility the added advantage of having all the markers on a single
and image analysis complexity, the %PD-L1 expression by slide.15
TCs and CD68+ macrophages as well as number of PD-1 After this objective was achieved, we turned our focus to
cells in proximity to a PD-L1 cell were assessed. Strong parameters afforded by mIF and associated slide imaging
concordance was observed for %PD- L1 expression by systems that are beyond the capabilities of conventional
cell type, with an average fit and slope of R2=0.84 (0.91) IHC approaches, including the assessment of densities
and 0.88 (0.92) for CK+ and CD68+ in the breast TMA of multiple markers on a single slide, determinations of
(figure 4A). Direct site-to-site comparison data for the spatial relationships at a single-cell level, and the quan-
breast and NSCLC TMAs are provided in online supple- titative evaluation of marker coexpression by individual
mental tables S2 and S3, respectively. Intersite compar- cells. Given the growing body of evidence in this area
ison for PD-1/PD-L1 proximity using linear regression that suggests that density and location of specific cell
analysis showed strong fit and slope (figure 4B). The phenotypes within the TME,8 10 15 21 22 proximity of PD-1
overall average intersite concordance for this analysis in to PD-L1 expression,6–8 and %PD-L1 expressed by tumor
the breast and lung TMAs was R2=0.82 and 0.84. Details cells and/or ICs23 24 associated with response to anti-PD-1
of the R2 and slope values for each site-to-site comparison based therapies, the expectation is that a version of the
are displayed in online supplemental tables S4 and S5. six-plex PD-1/PD-L1-axis mIF assay described herein will
Notably, the PD-1/PD-L1 proximity had stronger concor- soon be used in collaborative oncology groups, prospec-
dance than %PD-L1 expression at lower levels. This is of tive clinical trials and, ultimately, in clinical practice.
specific interest since some of the companion diagnos- Conventional reproducibility studies focus on scoring
tics used for clinical trial enrollment use a 1% cut-off for cells as positive or negative for a given marker. Here, the
PD-L1 expression for enrollment. reproducibility of staining intensity was assessed, which is
a more rigorous metric, and one for which standard refer-
ence ranges are not currently recognized. We observed
DISCUSSION an average intersite CV for the top quartile of staining
As immuno- oncology (IO) emerges as an effective intensity of 20% compared with an average intrasite CV
approach to fighting cancer, quantitative immunofluores- of 10%. We believe the relatively higher intersite variation
cence approaches are playing a larger role in biomarker is due to different automated stainer cleaning and main-
development.17 IO brings with it the need for multivari- tenance protocols, the prebaking steps, and the local
able tests that accurately predict response and long-term handling of assay reagents, for example, how accurately
benefits to patients, to help oncologists choose from the they are prepared or diluted; these learnings occurred
rapidly growing list of IO therapy options. Recent data after much of this reproducibility study was completed
suggest predictive biomarkers based on spatial arrange- and represent a limitation of this study. Specifically, we
ments of cells or coexpression patterns in FFPE tissue found that baking slides at 65°C for 3 hours with a 90° rota-
sections will play an important role in making IO more tion halfway through substantially eliminated variability
‘precise’, by more accurately indicating likelihood of between cases. Importantly, while this step was included
response to individualized treatment options.15 18 Here, in the TMA-based experiments, it was initiated after the
we demonstrate the first steps in clinical translation of intrasite and intrasite CV characterizations on tonsil
emerging multispectral imaging of multiplexed immuno- tissue were performed. Notwithstanding, we believe that
fluorescence (‘multispectral mIF’) technology by showing the data presented herein demonstrates reproducibility
Taube JM, et al. J Immunother Cancer 2021;9:e002197. doi:10.1136/jitc-2020-002197 7Open access
J Immunother Cancer: first published as 10.1136/jitc-2020-002197 on 15 July 2021. Downloaded from http://jitc.bmj.com/ on October 19, 2021 by guest. Protected by copyright.
Figure 4 Strong concordance was also achieved for %PD-L1 coexpression assessments by cell type and PD-1/PD-L1
proximity analysis. (A) Left panels: representative low and corresponding high-power photomicrographs of breast carcinoma
TMA cores showing PD-L1 expression on CK+ tumor cells and CD68+ macrophages (white arrows on left and right images,
respectively). Right panels: representative intersite comparison demonstrating the percent of PD-L1 displayed by CK+
and CD68+ cells. Green data points identify the two TMA cores shown in the left panels. The remaining intersite and intrasite
comparisons are shown in online supplemental table S2. There was high average intersite concordance of %PD-L1 within
CK+ and CD68+ cells (table shows R2 with slope and SD of slope). Similar results for intersite and intrasite concordance were
observed in the NSCLC TMA and are shown in online supplemental table S3. (B) Left panel: representative image showing
a TMA core with proximity map overlay, where orange dots represent PD-1+ cells, and green dots represent PD-L1+ cells.
White lines display distance from all PD-L1+ cells to neighboring PD-1+ cells. Only those within 25 µm are counted (scale bar
represents 200 µm). Right panel: representative intersite comparison demonstrating reproducibility of PD-1/PD-L1 proximity
assessment. A high average intersite concordance for assessment of PD-1/PD-L1 proximity was observed. The individual
intersite comparisons for both the breast and lung TMAs are shown in online supplemental tables S4 and S5 (table shows R2
with slope and SD of slope). P values for all concordance values are statistically significant. NSCLC, non-small cell lung cancer;
TMAs, tissue microarrays.
across sites, which will only be further improved with of >0.8 versusOpen access
intersite comparison for PD-L1 expression on the breast and interlaboratory concordance for assessments of IC
J Immunother Cancer: first published as 10.1136/jitc-2020-002197 on 15 July 2021. Downloaded from http://jitc.bmj.com/ on October 19, 2021 by guest. Protected by copyright.
and NSCLC TMAs, subtle staining variability was observed densities, coexpression, and proximity parameters. The
across sites that affected which cells were determined to approach described herein may serve as a template for
be positive or negative around the threshold. To miti- assessing the analytic performance and reproducibility of
gate these site-to-site differences, raw intensity values for emerging mIF panels for other investigative teams, with
PD-L1 expression were normalized to the three control an eye toward translating such approaches into clinical
cores in each TMA. Once these on-slide controls were trials and ultimately into the clinic.
used, the intersite reproducibility of %PD-L1 expression
by CD68+ macrophages showed an average R2 value of Author affiliations
1
0.82, bringing it in line with %TC expression of PD-L1 by Department of Dermatology, The Johns Hopkins Hospital, Baltimore, Maryland, USA
2
Akoya Biosciences, Marlborough, Massachusetts, USA
pathologists and suggesting a potential path forward for 3
Department of Molecular Microbiology and Immunology, Providence Cancer
reproducible assessment of this key clinical determinant. Institute, Earle A. Chiles Research Institute, Portland, Oregon, USA
Future studies will directly compare the predictive power 4
Department of Translational Molecular Pathology, The University of Texas MD
of this mIF variable with pathologist visual assessments of Anderson Cancer Center, Houston, Texas, USA
5
%PD-L1 on ICs using conventional IHC. Bristol Myers Squibb, Princeton, New Jersey, USA
6
Department of Pathology, Yale University School of Medicine, New Haven,
Macrophages represent a specific image analysis chal- Connecticut, USA
lenge due to their variation in size and morphology. Here,
we found that the average intersite R2 value for %PD-L1 Twitter Carmen Ballesteros-Merino @carmenbm0404 and Bernard A Fox @
expressed by CD68+ macrophages of 0.88 was better than BernardAFox
the R2 value of 0.67 found when counting CD68+ cells Acknowledgements The authors would like to thank the Murdock Charitable
alone. We believe this is because a % positivity calcula- Trust, the Providence Portland Medical Foundation, the Harder Family, Robert W
tion is a ratio (# cells positive/total # cells) rather than and Elsie Franz, Lynn and Jack Loacker, and Wes and Nancy Lematta. The authors
would also like to acknowledge Justin Lucas for technical assistance during his
an absolute number (# of positive cells). As such, the time at BMS.
value is less likely to change due to the heterogeneity of
Contributors JT, IW, ELE, DL, ERP, BAF, DLR, and CH contributed to the study
the TME between different sections and/or potential concept and design, analysis and interpretation of the data, and drafting of the
sectioning artifacts or challenges in membrane segmenta- manuscript. JT, ELE, KR, CW, and CH developed the staining methodology. JT, ELE,
tion of macrophages. Along those lines, another contrib- KR, CW, CB-M, SMJ, JM, MJ, KR, CC, and CH were involved in data acquisition. KR
performed the statistical analysis. BR and CC provided administrative and technical
uting factor may be that PD-L1+ macrophages may be
support. All authors read and approved the manuscript.
identified more reproducibility by the machine learning
Funding This work was supported by National Cancer Institute 3R01CA142779-
algorithm because PD-L1 expression on the membrane 09S1A1 (JMT, DR, BF, and ERP); The MD Anderson Lung Cancer Moon Shot
likely contributes to improved membrane segmentation Program, the Cancer Prevention and Research Institute of Texas Multi-Investigator
and associated macrophage quantification. Strategies to Research Award grant (RP160668), The Mark Foundation for Cancer Research
improve membrane segmentation of macrophages that (JMT), Emerson Collective (JMT); Bristol-Myers Squibb (JMT); Sidney Kimmel
Cancer Center Core Grant P30 CA006973 (JMT); and The Bloomberg~Kimmel
may be employed in future studies include the addi- Institute for Cancer Immunotherapy.
tion of a stain that highlights cell membranes to aid the
Competing interests CB-M, SMJ, and BAF: research support from Bristol
machine learning algorithm with segmentation and/or Myers Squibb II-ON program, and equipment and supply support from Akoya
segmenting macrophages separately from the other ICs Biosciences; JT: research support from Bristol Myers Squibb; DLR declares
in the TME.15 that in the last 2 years, he has served as a consultant to AstraZeneca, Amgen,
In this study, the mIF assay was performed at each BMS, Cell Signaling Technology, Cepheid, Daiichi Sankyo, Danaher, GSK, Konica/
Minolta, Merck, NanoString, Novartis, PAIGE.AI, PerkinElmer/Akoya Biosciences,
of six individual locations, and the image analysis was Ultivue, and Ventana Medical Systems; BAF declares consulting for Ultivue and
performed at one site. The image analysis platform used Neogenomics and research support from Macrogenics, Bristol Myers Squibb,
in this study employs an advanced machine learning Incyte, OncoSec Medical, and Merck; KR, CW, JM, CC, BR, DL, and CH: all are
approach for segmenting and phenotyping cells. Trans- employees of Akoya Biosciences. No potential conflicts of interest were disclosed
by the other authors.
lating mIF methods into clinical applications will most
likely require creating ‘locked down’ versions of algo- Patient consent for publication Not required.
rithms to help assure assay performance and avoid incon- Ethics approval Evaluation of deidentified, archived pathology specimens
described in this manuscript does not require individual patient consent. All
sistencies among laboratories. By having one site perform
procedures in this study were conducted in accordance with ethical principles.
all the analysis with a single algorithm, we mimicked this
Provenance and peer review Not commissioned; externally peer reviewed.
important translational requirement. Planned future
studies will address the reproducibility of the local image Data availability statement All data relevant to the study are included in the
article or uploaded as supplementary information.
analysis by multiple institutions using the ‘locked-down’
Supplemental material This content has been supplied by the author(s). It has
algorithm that includes the aforementioned normaliza-
not been vetted by BMJ Publishing Group Limited (BMJ) and may not have been
tion to either on-slide or batch-run controls. peer-reviewed. Any opinions or recommendations discussed are solely those
In summary, six laboratories collaborated to develop of the author(s) and are not endorsed by BMJ. BMJ disclaims all liability and
and optimize an automated six- plex assay focused on responsibility arising from any reliance placed on the content. Where the content
includes any translated material, BMJ does not warrant the accuracy and reliability
the PD-1/PD- L1 axis and assessed staining reproduc-
of the translations (including but not limited to local regulations, clinical guidelines,
ibility. Our findings advance the current state of this terminology, drug names and drug dosages), and is not responsible for any error
assay technology by demonstrating strong intralaboratory and/or omissions arising from translation and adaptation or otherwise.
Taube JM, et al. J Immunother Cancer 2021;9:e002197. doi:10.1136/jitc-2020-002197 9Open access
Open access This is an open access article distributed in accordance with the 14 Helmink BA, Reddy SM, Gao J, et al. B cells and tertiary
J Immunother Cancer: first published as 10.1136/jitc-2020-002197 on 15 July 2021. Downloaded from http://jitc.bmj.com/ on October 19, 2021 by guest. Protected by copyright.
Creative Commons Attribution Non Commercial (CC BY-NC 4.0) license, which lymphoid structures promote immunotherapy response. Nature
permits others to distribute, remix, adapt, build upon this work non-commercially, 2020;577:549–55.
15 Berry S, Giraldo N, Green B. Abstract 6584: The ‘AstroPath'
and license their derivative works on different terms, provided the original work is
platform for spatially resolved, single cell analysis of the tumor
properly cited, appropriate credit is given, any changes made indicated, and the use microenvironment (TME) using multispectral immunofluorescence
is non-commercial. See http://c reativecommons.org/licenses/by-nc/4.0 /. (mIF). Cancer Res 2020;80:6584.
16 Taube JM, Akturk G, Angelo M, et al. The Society for
ORCID iDs immunotherapy of cancer statement on best practices for multiplex
Bethany Remeniuk http://orcid.org/0000-0003-1961-5163 immunohistochemistry (IHC) and immunofluorescence (IF) staining
David L Rimm http://orcid.org/0000-0001-5820-4397 and validation. J Immunother Cancer 2020;8:e000155.
17 Cregger M, Berger AJ, Rimm DL. Immunohistochemistry and
quantitative analysis of protein expression. Arch Pathol Lab Med
2006;130:1026–30.
18 Lu S, Stein JE, Rimm DL, et al. Comparison of biomarker modalities
REFERENCES for predicting response to PD-1/PD-L1 checkpoint blockade: a
1 Taube JM, Galon J, Sholl LM, et al. Implications of the tumor systematic review and meta-analysis. JAMA Oncol 2019;5:1195-
immune microenvironment for staging and therapeutics. Mod Pathol 1204.
2018;31:214–34. 19 Parra ER, Uraoka N, Jiang M, et al. Validation of multiplex
2 Sunshine J, Taube JM. Pd-1/Pd-L1 inhibitors. Curr Opin Pharmacol immunofluorescence panels using multispectral microscopy for
2015;23:32–8. immune-profiling of formalin-fixed and paraffin-embedded human
3 Hansen AR, Siu LL. Pd-L1 testing in cancer: challenges in tumor tissues. Sci Rep 2017;7:13380.
companion diagnostic development. JAMA Oncol 2016;2:15–16. 20 Gorris MAJ, Halilovic A, Rabold K, et al. Eight-Color multiplex
4 Rimm DL, Han G, Taube JM, et al. A prospective, multi-institutional, immunohistochemistry for simultaneous detection of multiple
Pathologist-Based assessment of 4 immunohistochemistry assays immune checkpoint molecules within the tumor microenvironment. J
for PD-L1 expression in non-small cell lung cancer. JAMA Oncol Immunol 2018;200:347–54.
2017;3:1051–8. 21 Gettinger SN, Choi J, Mani N, et al. A dormant TIL phenotype defines
5 Taube JM, Anders RA, Young GD, et al. Colocalization of non-small cell lung carcinomas sensitive to immune checkpoint
inflammatory response with B7-H1 expression in human melanocytic blockers. Nat Commun 2018;9:3196.
lesions supports an adaptive resistance mechanism of immune 22 Wong PF, Smithy JW, Blenman KR. Quantitative assessment of
escape. Sci Transl Med 2012;4:127ra37. tumor-infiltrating lymphocytes and immunotherapy outcome in
6 Tumeh PC, Harview CL, Yearley JH, et al. Pd-1 blockade induces metastatic melanoma. Cancer Res 2018;78.
responses by inhibiting adaptive immune resistance. Nature 23 Taube JM, Klein A, Brahmer JR, et al. Association of PD-1, PD-1
2014;515:568–71. ligands, and other features of the tumor immune microenvironment
7 Johnson DB, Bordeaux J, Kim JY, et al. Quantitative spatial profiling with response to anti-PD-1 therapy. Clin Cancer Res
of PD-1/PD-L1 interaction and HLA-DR/IDO-1 predicts improved 2014;20:5064–74.
outcomes of anti-PD-1 therapies in metastatic melanoma. Clin 24 Herbst RS, Soria J-C, Kowanetz M, et al. Predictive correlates of
Cancer Res 2018;24:clincanres.0309.2018. response to the anti-PD-L1 antibody MPDL3280A in cancer patients.
8 Giraldo NA, Nguyen P, Engle EL, et al. Multidimensional, quantitative Nature 2014;515:563–7.
assessment of PD-1/PD-L1 expression in patients with Merkel cell 25 Tsao MS, Kerr KM, Kockx M, et al. Pd-L1 immunohistochemistry
carcinoma and association with response to pembrolizumab. J comparability study in real-life clinical samples: results of blueprint
Immunother Cancer 2018;6:99. phase 2 project. J Thorac Oncol 2018;13:1302–11.
9 Zheng X, Weigert A, Reu S. Spatial density and distribution of tumor- 26 Rimm DL, Han G, Taube JM, et al. Reanalysis of the NCCN PD-L1
associated macrophages predict survival in Non–Small cell lung companion diagnostic assay study for lung cancer in the context of
carcinoma. Cancer Res 2020. PD-L1 expression findings in triple-negative breast cancer. Breast
10 Althammer S, Tan TH, Spitzmüller A, et al. Automated image analysis Cancer Res 2019;21:72.
of NSCLC biopsies to predict response to anti-PD-L1 therapy. J 27 Schmid P, Adams S, Rugo HS, et al. Atezolizumab and nab-
Immunother Cancer 2019;7:121. paclitaxel in advanced triple-negative breast cancer. N Engl J Med
11 Feng Z, Bethmann D, Kappler M, et al. Multiparametric immune 2018;379:2108–21.
profiling in HPV- oral squamous cell cancer. JCI Insight 2017;2. 28 Schmid P, Rugo HS, Adams S, et al. Atezolizumab plus nab-
doi:10.1172/jci.insight.93652. [Epub ahead of print: 20 Jul 2017]. paclitaxel as first-line treatment for unresectable, locally advanced
12 Patel SS, Weirather JL, Lipschitz M, et al. The microenvironmental or metastatic triple-negative breast cancer (IMpassion130): updated
niche in classic Hodgkin lymphoma is enriched for CTLA-4-positive T efficacy results from a randomised, double-blind, placebo-controlled,
cells that are PD-1-negative. Blood 2019;134:2059–69. phase 3 trial. Lancet Oncol 2020;21:44–59.
13 Topalian SL, Bhatia S, Amin A, et al. Neoadjuvant nivolumab for 29 Herbst RS, Giaccone G, de Marinis F, et al. Atezolizumab for first-line
patients with resectable Merkel cell carcinoma in the CheckMate 358 treatment of PD-L1-Selected patients with NSCLC. N Engl J Med
trial. J Clin Oncol 2020;38:2476–87. 2020;383:1328–39.
10 Taube JM, et al. J Immunother Cancer 2021;9:e002197. doi:10.1136/jitc-2020-002197You can also read