Link between H1N1 sequence and immunological symptoms
←
→
Page content transcription
If your browser does not render page correctly, please read the page content below
Link between H1N1 sequence and
                   immunological symptoms

Bahareh Khalaj
Degree project in biology, Master of science (2 years), 2011
Examensarbete i biologi 30 hp till masterexamen, 2011
Biology Education Centre, Uppsala University, and Karolinska institute
Supervisor: Markus Maeurer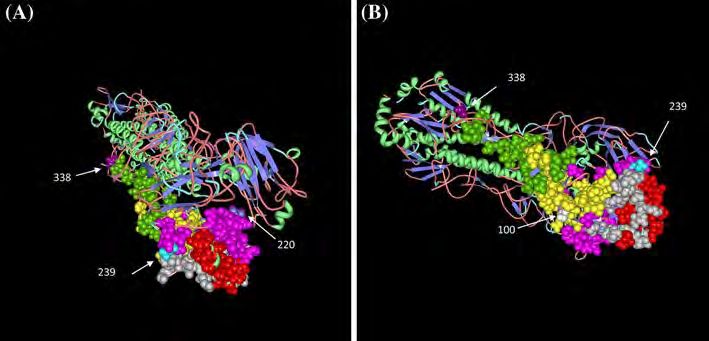
1. Introduction

        A novel influenza A (H1N1) virus was discovered in spring 2009 that caused the first influenza
pandemic in decades. This disease was spread among young people with virulence similar to seasonal
influenza. Only a few elderly individuals were infected by H1N1 and this was related to previous immunity
against similar influenza viral pathogens that circulated before 1957 [1].

        Before the H1N1 pandemic, the human population was infected sporadically with H1N1, which was
derived from pigs. This virus had continually reassorted with H3N2, which caused a flu breakout in the pig
population in 1998 [2]. Variations in influenza virus genomes represent a central mechanism to facilitate
spread and pathogenicity of the virus.
    Alterations in genome sequences (mutations) of the virus may be associated with changes of immune
responses. The mutations can cause at least three immunological parameters to change:

       a. Peptide presentation and binding to major histocompatibility complex class I (MHC I), which present
          flu epitopes to CD8+ T-cells.
       b. The nature of the native immune response via production of cytokines.
       c. Adaptive immune responses by production of antibodies and activation of CD8+ T-cell responses [3].

       Thus, an investigation about the H1N1 viral pathogens, which were isolated in Sweden, is necessary in
order to understand the characteristics of H1N1 that spreads between different individuals. This investigation
was done as a part of a project shared between LifeGene (www.LifeGene.se) and the Karolinska Institute.

The aims of this study are:

       - Sequencing H1N1 isolates obtained from a 2000 individuals cohort in the Life Gene project.
       - Associate H1N1 sequences with the cellular immune responses.

1.1 The biology of H1N1

         The H1N1 virus belongs to the Orthomyxoviridae family. The influenza virus is classified in three
different types i.e. A, B and C [11]. Most mammalian and avian hosts have been infected with influenza type A
[4]
    . The influenza virus has a lipid envelope. This bilayer contains three proteins: hemagglutinin (HA),
neuraminidase (NA) and the transmembrane protein (second matrix protein M2) [3]. The influenza virus shows
antigencity in the HA and NA proteins. Yet anti-first matrix protein (anti-M1) specific responses have been
also described [4].
         Influenza A is classified in different subtypes, according to different kinds of HA and NA proteins, i.e.
the HA protein has 16 subtypes (H1-H16) and the NA protein has 9 subtypes (N1-N9), thus H1N1 and H3N2
are subtypes of influenza A [3].

                       Link between H1N1 sequence and immunological Symptoms                       Page 2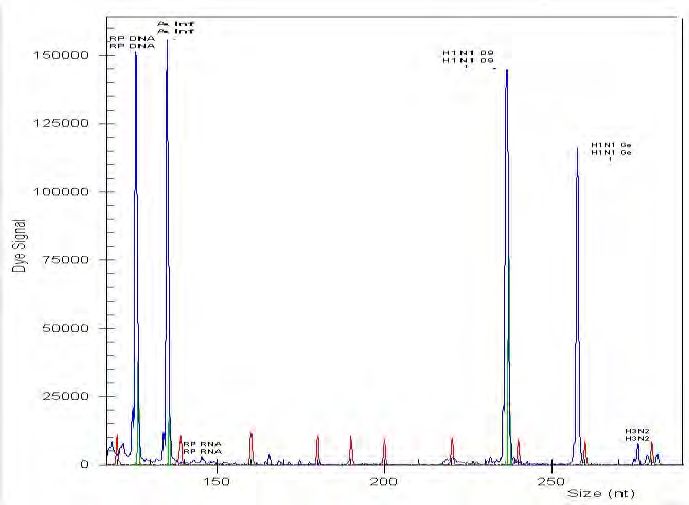
A. Genome structure
The genome of influenza A viruses is created by eight segments of single stranded RNA with negative
polarity. The size of this genome varies from 890 nucleotides (nt) to 2350 nt coding for 11 proteins [3].
The subunits of viral RNA polymerase, which are polymerase basic 1 and 2 (PB1, PB2) and polymerase
acidic (PA), named according to basic and acidic features on isoelectric focusing gels, are coded by the three
largest gene segments. Furthermore, these proteins act as transcribing messenger (mRNAs) for synthesizing
positive-sense antigenomic template RNAs (cRNAs). The fourth segment encodes the HA glycoprotein, which
binds to sialic acid of host cell surface in order to enter host cells; HA is the most important target for
neutralizing antibodies. The fifth gene segment encodes the nucleoprotein (NP) that is responsible for
encapsidation of RNA. This encapsidation has a template role for recognition by viral polymerase. The NA
protein is encoded by the sixth gene segment, responsible for separating sialic acid from the virus and host
cell glycoconjugates at the end of the virus life cycle. The matrix proteins (M1 and M2) are produced by the
seventh segment. M1 has a fundamental role in virus assembly, while M2 is a small transmembrane protein,
which results from spliced mRNA. This protein has a proton channel activity that helps virus disassembly
during early stages of infection. The eighth gene segment, ribonucleic particle (RNP) encodes two proteins,
which are nonstructural 1 and 2 (NS1 and NS2). NS1 has various functions, such as regulator of mRNA
splicing and translation, and modulating interferon induction. NS2 functions as a mediator in the export of
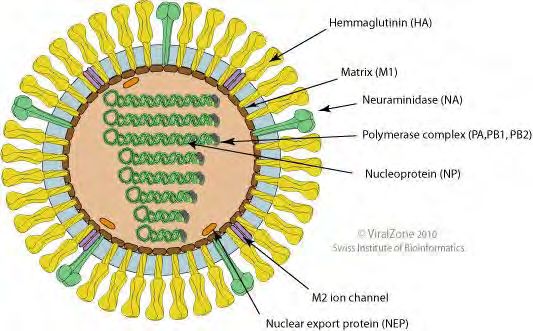
newly synthesized RNP from the nucleus [4] (Figure 1).
Figure1: H1N1 structure
Table 1: Nonstructural protein function.
Protein name Function
NS1 Regulator of mRNA splicing, translation, modulating interferon production
NS2 or NEP Mediator in exporting new RNP
Link between H1N1 sequence and immunological Symptoms Page 3B. Life cycle of H1N1
In order to initiate infection, HA interacts with sialic acid of the host cell membrane. After this
interaction, the virus enters the host cell by classical receptor mediated endocytosis in clathrine coated
vesicles. For this process, acidification is important. A low PH is necessary for: a) effective fusing between HA
and the host cell membrane that causes virus entry into the cytoplasm, b) M2 protein activity.
M2 protein represents a proton channel that interacts with viral uncoating and releasing of
ribonucleoprotein complexes in viral particles. This is followed by viral RNA replication and initiation of
transcription. These activities are controlled by a RNA polymerase. The viral mRNA is transferred from the
nucleus to the cell cytoplasm by the NEP protein and M1. In the cytoplasm, mRNA is translated into H1N1
proteins, which causes the host cell protein synthesis to stop, leading the host cell to die via apoptosis [5].
C. Evolution and antigenic variation of influenza A virus
The genomes of the last three pandemic influenza viruses (1918 H1N1, 1957 H2N2 and 1968 H3N2)
originated from nonhuman reservoirs. The HA genes of all the pandemic viruses initially originated from avian
influenza viruses. During 1998, the classical swine influenza viruses reassorted with a “modern” human
influenza A virus (H3N2) and an American lineage avian influenza virus of an unknown subtype (antigenic
shift). The result of this reassortment was a triple reassorted H3N2 swine virus in the swine populations
throughout North America. Shortly after the detection of a triple reassorted H3N2 virus, other subsequent
triple reassortments with classical H1N1 swine A virus were recognized [6]. A phylogenic tree showed that
2009 flu sequences are evolutionarily closer to the most ancient sequence reported in the NCBI database
collected in 1918 and they widely differed from the past few years’ flu A sequences [7].
Influenza A has two important mechanisms, which causes mutation:
1) Lack of proofreading activity of viral RNA polymerase during replication. The level of point
mutations is high. The rate of mutation in this virus is 1 nucleotide change for every copied genome [8, 9].
2) The segmented nature of the viral genome helps the formation of new progeny. This new progeny
contains the combination of two or more segments from different flu subtypes, which infect the single cell
(antigenic shift). This antigenic shift produces a new kind of flu proteins, which may escape immune
recognition. This happened most likely during the pandemic flu in 1957 and 1968.
In addition, this antigenic shift and other point mutations change the characteristics of the virus, such as
pathogenicity, virulence, drug resistance and viral transmission [10].
We can classify the mutations in 5 groups:
1) Mutations in PB1, PB2 and PA, which enhance pathogenicity.
2) Mutations in the HA protein, changing the ability of receptor binding.
3) Mutations in the NA protein causing resistance to antiviral drugs.
4) Mutations in M2 conferring cross-resistance to Adamantine drugs, a treatment for influenza.
5) Mutations in NS1 and NS2 conferring cytokine resistance and increased virulence [3].
Link between H1N1 sequence and immunological Symptoms Page 4Table 2: Mutation in flu genes and their effect.
Mutation Effect
Mutation in PB1,PB2 and PA Enhance pathogenicity
Mutation in HA Change the ability of receptor binding
Mutation in NA Resistance to antiviral drugs
Mutation in M2 Confer cross-resistance to Adamantine
Mutation in NS1 and NS2 Cytokine resistance and increased virulence
1.2 Immune response
Cellular responses against the H1N1 virus develop in several ways in order to reduce viral spreading.
These responses are divided into two groups i.e. A) innate response, B) CD4+ and CD8+ T-cell responses and
TH17-type response. I focus in my master thesis on the definition of cellular immune responses directed
against flu. It is well accepted and described that anti-flu specific neutralizing antibodies (humoral immune
responses) are helpful and needed to fight off viral infection. The traditional flu vaccines are defined and
measured by induction of neutralizing antibodies, particularly against HA. CD4+ T-cell help is needed to
achieve good and long-lasting antibody titers. CD4+ and CD8+ T-cells recognize their targets as small peptides
(usually 8-9 amino acids long for CD8+ T-cells, and 15 amino acids for CD4+ T-cells) presented by MHC class I
and MHC class II molecules, respectively. Thus, mutation of any viral protein may not only interfere with the
constitutive protein function, yet also impact on MHC binding and subsequent T-cell recognition and effector
T-cell functions. Viral mutations, also single amino acid residues, can therefore impact on immune recognition
associated with the genetic background (MHC class I or class II molecules) of the infected host.
A) Innate response
The innate immune response is characterized by cytokine and chemokine production from epithelial
cells and leukocytes. When flu infected lung host-cells apoptose, leukocytes and epithelial cells become
activated by transcriptional and post-translational systems. These systems limit viral spreading. Chemokines
bind to specific receptors on leukocytes inducing a strong inflammatory response, which signals other
immune cells to access the infection site. Chemokines activate innate immune responses [5].
B) Cellular responses
When T-cells are activated by antigen presenting cells or macrophages that digested flu-infected cells
or viral components, naïve T-cells (directed specifically against flu-antigens) are stimulated and differentiate
into effector T-cells, specific for defined influenza virus proteins. Most of these effector cells induced by
pandemic H1N1 belong to the TH1 and TH17 populations [14]. The TH1 response is important in inducing
immunity against intracellular pathogens. TH1 T-cells produce interferon gamma (IFN- which stimulate
macrophages and B-cells to produce specific antibodies directed against influenza virus components [11].
These effector T-cells have a role in the control of viral infection, by i) producing cytokines and ii) indirect
killing of flu-infected cells [12].
Link between H1N1 sequence and immunological Symptoms Page 5TH1-cytokines stimulate the host antiviral defense. During influenza virus infection, cytokines are also
produced from lung epithelial cells, such as type 1 interferon (IFN-), interleukin-6 (IL-6), IL-8 and
chemokines, including monocytes chemoattractant protein-1 (MCP-1).
In addition, monocytes produce cytokines: tumor necrosis factor (TNF-α), IL-1β, IL-6, IL-18 and IFN-
α/β. New experimental data showed that epithelial cells also produce MIP-1α, similarly to macrophages. This
cytokine causes monocytes to infiltrate the infection site [5]. Both CD4+ and CD8+ T-cells respond against
influenza viral pathogens. CD8+ T-cells are activated by primary interaction with dendritic cells (DC), which
obtain antigen from interaction with pulmonary plasmacytoid DCs, CD8α+ DCs, or TNF-α inducible nitric oxide
synthase (iNOS) producing DCs (tipDC). These DCs aid to T-cell survival and maturation. CD8+ T-cells, after
antigenic activation, produce cytotoxic molecules (e.g. granzyme and perforin) and antiviral cytokines (e.g.
TNF-α and IFN-γ), which can contribute to lung pathology [13]. CD8+ T-cells appear to be more important in
eliminating the virus as compared to CD4+ T-cells, which provide help to the induction of anti-flu specific
antibodies. Also, CD8+ T-cells aid to control flu infections in the absence of B-cells and antibodies (provided
that ‘cross-recognition’ takes place). CD8+ T-cells recognize flu viral epitopes derived from NP, PA, M, HA and
NS [12].
During H1N1 infection, specific cytokines stimulate the TH1 and TH17 cells response. IFN-γ, TNF-α
stimulate TH1 cells, while IL-8, IL-17 (as an autocrine loop) and IL-6 stimulate TH17 cell differentiation [14].
TH17 cells induce strong inflammatory reactions via neutrophils, which cause tissue damage. Thus, the
deleterious effect of infection with flu is associated with the infecting pathogen, yet also with the host
immune response as a consequence of infection and the individual genetic background [11].
1.3 Clinical symptoms
Influenza A has various clinical features, which are divided to three groups: A) respiratory disease
without fever, B) typical influenza like illness symptoms, C) severe pulmonary disease [15].
Typical influenza like illness symptoms are fever, cough sore throat and rhinorrhea. These features may
associate with systemic symptoms, such as gastrointestinal symptoms (including nausea, vomiting, and
diarrhea). Other symptoms include dyspnea, tachypnea in children, chest pain, hemoptysis or purulent
sputum, prolonged or recurrent fever, altered mental status, manifestations of dehydration and reappearance
of lower respiratory tract symptoms. All these symptoms are signs of progression to more severe disease.
Laboratory findings include normal or low-normal leukocyte counts with lymphocytopenia and an increased
level of serum aminotransferases lactate dehydrogenase, creatine kinase and creatinine [16]. Also, the level of
IFN-IL-15, IL-8 and IL-6 in the plasma of the patients is increased, reflecting a general immune activation.
During the late phase of illness, the level of IL-10, granulocyte colony stimulating factor (GCSF), is increased
most likely as a response to ‘cool down’ the initial pro-inflammatory response [12].
1.4 Epidemiology
Most diseases associated with the H1N1 virus are acute and self-limited. The highest attack rates are
reported among children and young adults. Second stages of ‘high attack rate’ are affects adults older than 60
years of age [17].
Influenza A (H1N1) causes two related diseases, i.e. pneumonia and a general flu infection. The
association of pneumonia and general influenza infection increased up to 8.1% from October 2009 to January
Link between H1N1 sequence and immunological Symptoms Page 62010. The rate of death from influenza in children was almost four times the average reported in the previous
five influenza season. Risk groups for H1N1 infection were: age 65 years [16].
1.5 Transmission
Transmission mechanism and breakout of H1N1 virus is similar to seasonal influenza, i.e. ‘person to
person’ transmission. The rate of secondary outbreak of illness is different according to the setting and the
exposed population. This rate ranges from 4% to 28%.
Most of the epidemics have occurred in places with large populations, such as schools, day care
facilities, camps and hospitals [16].
1.6 Diagnosis
The recommended method from the World Health Organization (WHO) for H1N1 diagnosis is a
conventional or real time reverse transcriptase polymerase chain reaction (RT-PCR). The best suitable sample
for RT-PCR-based diagnosis is a nasopharyngeal aspirate or swabs. But endotracheal or bronchoscopic
aspirates have also produced good results in patients with respiratory tract sickness. PCR-based detection is
best as soon as possible after the first flu symptoms. Commercially available rapid influenza antigen assays
have low sensitivity (11-70%) for detecting 2009 H1N1. Those tests cannot separate influenza subtypes [16].
Multiplex PCR assays allow the diagnosis of different influenza A subtypes [24].
Recently, a new enzyme linked immunosorbent assay (ELISA) method was designed, which can detect
specific H1N1 antibodies in serum samples. A human H1N1 antibody is recognized by using a recombinant
fragment of the globular region of the protein HA of the 2009 H1N1 virus. This method can recognize
antibodies in patient serum samples as soon as standard PCR, two weeks after flu infection [18].
1.7 Vaccination
Vaccination is a key strategy for preventing H1N1 infection. The H1N1 pandemic vaccine was produced
in November 2009. According to the U.S food and drug administration (FDA), the H1N1 vaccine was classified
into two different groups: injectable vaccine, which includes four different types, and an intranasal spray
vaccine [19, 20].
2. Material and methods
2.1 Sampling
Two thousands individuals were included in the study. Two different samples from the individuals
were collected: heparin blood (for all individuals) and swab samples (in the case of flu symptoms). The
samples were taken at different time points, i.e. before and after the flu season. Nasal swab samples were
collected when patients experienced flu symptoms. The first time point for the blood sample was called A1
(before onset of symptoms or vaccination). If these individuals, who had participated in time point A1, were
Link between H1N1 sequence and immunological Symptoms Page 7infected with flu virus (as detected by PCR in nasal swabs), two heparin blood tubes were taken from them
again. This time point was called B1 (10-14 days after symptoms and a positive flu PCR). After the flu season,
blood samples from all individuals who attended in time point A1 and B1 were taken, the last time point was
denoted C1. The time points and samples are described in the Table 3 below.
Table 3: Sample point classification.
Time point A1 B1 C1
Condition Before the flu season Flu season After the flu season
Samples Blood Blood and nasal swab Blood
At time point A1, 2000 individuals attended, 597 individuals at time point C1 sent a nasal swab (who
experienced flu-like symptoms), while in time point C1, 1000 individuals attended.
Infected people were categorized into five different profiles:
1. Infection but no symptoms (no disease, i.e. protection, based on laboratory diagnosis)
2. Subclinical infection
3. Clinical infection with mild-abortive and short-term disease
4. Classical influenza with three-five days high fever, severe general and airway-associated symptoms
5. Complicated influenza, virus-pneumonia and/or bacterial super infection
These profiles are shaped at least by these seven criteria:
1. Genetic susceptibility
2. Co-morbidity (other disease, e.g. asthma)
3. Vaccination
4. Previous exposure to flu with defined similarity-dissimilarity with the present infectious agent
5. Detailed clinical information and reporting (interviews)
6. Performing ‘on line’ testing, including the whole blood assay (WBA), by using current monovalent HA
and NA antigens at time point A1 (prior to exposure and 10-14 days after a positive PCR)
7. Detection of viral RNA (flu) or DNA (in the case of other viral pathogens causing flu)
2.2 Serology
A. Whole blood assay
One of the heparin (anticoagulant) blood samples from each individual was used for the WBA.
Lymphocytes were stimulated with different flu and non-flu antigens. By separating the cell culture
supernatants from these blood cells after 7 days of incubation, we measured the level of IFN- produced
during cellular activation.
Link between H1N1 sequence and immunological Symptoms Page 8These antigens were:
1. 2006-2009 vaccine antigens components:
a. A/Brisbane/59/2007 (H1N1) b. A /Uruguay/716/2007 (H3N2)
c. B/Florida/04/2006) d. A/Solomon Island/03/2006 (H1N1)
e. A/Wisconsin/67/2005 (H3N2) f. B/Malaysia/2506/2004
We included also the bird Flu: A/Vietnam/1203/2004 (H5N1) (not included in vaccine formulations)
2. Invariant matrix flu proteins: M1 protein (with Genbank ID: ACP44177.1) and M2 protein with (gene bank
ID: ACP44178.1). Both proteins were obtained from influenza A virus, A/California/08/2009(H1N1), and
present as peptides.
3. Mimicry peptides (dominant auto-antigen and dominant herpes simplex virus (HSV) target epitopes): a.
Melan-A/MART-1 (EAAGILTVILGVL); b. Glyco-C-HSV-1 (EWVGIGIGVLAAGVL). Both sequences were derived
from Genbank.
4. Other viral component: a. Epstein-Barr virus nuclear antigen 1 (EBNA-1), present as a recombinant protein
and LPS-free; b. Cytomegalovirus pp65 (CMVpp65), present as a recombinant protein and LPS-free.
5. Controls: a. Purified protein derivative (PPD) as a non-flu control protein; b. Phytohaemagglutinin (PHA) as
positive control; c. Medium only (no antigen) as a negative control.
A.1 WBA method
Antigen plates (96-well round bottom sterile culture plates, Nordic Biolab) for the WBA were
prepared by pipetting 100 micro-liters (l) of antigens in RPMI medium (1640w/Glutamax, Gibco, Invitrogen)
containing penicillin-streptomycin (Gibco, Invitrogen). The antigens coated plates were kept at -80°C until use.
Pre-coated 96-well plates were brought to room temperature prior to use on the day of the assay. Then,
blood samples were diluted with pre-warmed RPMI (containing penicillin-streptomycin) at a ratio of 1:2.5
(blood: medium). In a third step, 100 l of the diluted blood was added into each well of precoated 96-well
plate. The layout of the WBA 96-well antigen plate is shown in the Table 4. All stimuli were done in duplicate.
Table 4: Whole blood assay plate layout for one study participant blood sample.
H2O PHA PHA A SOLO A SOLO medium
H2O M1 M1 B FLOR B FLOR medium
H2O M2 M2 MART MART PPD
H2O A A HSV-1 HSV-1 PPD
BRIS BRIS
H2O A URUG A URUG EBNA1 EBNA1
H2O A WISC A WISC CMV-pp65 CMV-pp65
H2O A A CFP-10 CFP-10
VIET VIET
H2O B B ESAT-6 ESAT-6
MALA MALA
Link between H1N1 sequence and immunological Symptoms Page 9Plates, which contained diluted blood samples, were incubated in the 37°C in a 5% carbon dioxide
(CO2) incubator for seven days. After seven days, supernatant of each well were aspirated and then
transferred to a round bottom nonsterile 96-well plate. The 96-well plate containing the supernatant was kept
at -80°C. The cells in the WBA plate were frozen with freezing medium (90% foetal calf serum (Gibco,
Invitrogen) + 10% dimethyl sulfoxide (Sigma-Aldrich)) and kept at -80°C.
B. Enzyme linked immunosorbent assay (ELISA)
The purpose of this experiment was to measure the level of human IFN-in cell culture supernatants.
Supernatant were obtained from the WBA experiments (collected after 7 days of incubation with flu or non-
flu control antigens).
B.1 ELISA method
96-well plates were coated with diluted capture antibody over-night. Then, plates were washed four
times with wash buffer (PBS-0.05%.tween 20). Plates were blocked with saturation buffer (PBS-5%BSA) and
were incubated at room temperature for 2 hours. After washing of the plates, diluted supernatants (with the
PBS-1% BSA), blank (only PBS-1%BSA), internal control (recombinant IFN-) and standards with different
concentration (the maximum concentration was 400 Pico-gram per milliliter (pg/ml) and the minimum
concentration was 12.5 pg/ml) were dispensed to wells, 50 l of biotinylated detection antibody were added
to all wells after washing and then the plates were incubated at room temperature for 2 hours. The final steps
were: washing of the plates, dispensing of horseradish peroxidase-streptavidin, after 20 minutes incubation,
dispensing of 3,3’,5,5’-tetramethylbenzidine. After 10-15 minutes incubation (in the dark), sulfuric acid was
added to all wells to stop the reaction, and ELISA plates were read using an ELISA reader at 450 nm.
2.3 Genetic testing
The purpose of this thesis was the sequencing the H1N1 virus. RNA, extracted from the swab samples
was needed. RNA extraction was performed using an EZI robot. After RNA extraction, a reverse transcription
polymerase chain reaction (RT-PCR) was performed in order to obtain complementary DNA (cDNA). This cDNA
was used as a template for PCR. For the PCR, three different primers were used for the amplification two
genes of H1N1, HA and M protein. The PCR products were loaded on an agarose gel (1%). Then appropriate
bands (showing the correct size) in the gel were extracted. These extracted bands were used for DNA
sequencing. DNA results were analyzed using the BLAST program and Clustral-W in order to identify
mutations in each amplicon. The work flow was as follow:
A. RNA extraction from nasal swab by EZI robot
B. RT-PCR
C. PCR with gene specific primer set for HA and M
D. Gel extraction
E. DNA sequencing
F. Analysis of results by BLAST and Clustral-W software
Link between H1N1 sequence and immunological Symptoms Page 10A. RNA extraction by the EZI robot
For extracting RNA from a nasal swab by the EZI robot: the first step was the insertion of the EZI virus
card into EZI Card slot. After 45 minutes, purified nucleic acids were ready in a quality controlled fashion.
B. RT-PCR
In this method, cDNA is produced by reverse transcription. In the reverse transcription, RNA changes
to the single strand. Then RNA is primed with a proper primer and finally amplified with the reverse
transcriptase.
B.1 RT-PCR method
Viral RNA was mixed with random hexamer primers and deoxyribonucleotide triphosphates (dNTPs).
This mixture was incubated at 65°C for opening of the double strand RNA. Synthesis mix, which contains: First
buffer 5x, dithiothreitol that has a role as disulphide band reducer, RNase out, which protects mRNA from
destroying and superscript™ III reverse transcriptase was added to RNA+ random hexamer mixture. This mix
was run with hexamer RT-PCR program on a thermo-cycler, (25°C for 10 min, 50°C for 50 min, 85°C for 5 min,
and 4°C). RNase H was added to the samples in order to degrade the remaining mRNA and then the sample
was incubated at 37°C for 20 minutes.
C. PCR with gene specific primer set for HA and M
For this PCR, three different primers were used that were two primers for HA gene and one primer for
the M gene. The sequences of these primers and the length (base pair; bp) of the amplicon are displayed in
Tables.5.1 and 5.2.
Table 5.1: PCR products.
Flu target Amplicon size
genes
H1 811 bp
H2 996 bp
M 759 bp
Table 5.2A: Primer sequences for Flu target genes.
H1 (First H)
Forward ATGAAGGCAATACTAGTAGTTCTGC
primer
Reverse CATATCTCGGTACCACTAGATTTCC
primer
H2 (Second H)
Forward GCCGGAAATAGCAATAAGACCC
primer
Reverse AGAGACCCATTAGAGCACATCC
primer
Link between H1N1 sequence and immunological Symptoms Page 11Table 5.2B: Primer sequences for Flu target genes
M
Forward TCACTTGAATCGCTGCATCTG
primer
Reverse ATGAAGGCAATACTAGTAGTTCTGC
primer
QIAGEN multiplex master mix 2X contained HotStarTaq DNA Polymerase, the PCR buffer 6 mM MgCl2,
pH 8.7 and dNTPs Mix (dATP, dCTP, dGTP and dTTP). Taq DNA polymerase in this kit is a modified form of a
recombinant 94 kDa DNA polymerase, originally isolated from Thermus aquaticus and cloned in E. coli (DNA
deoxynucleotidyltransferase, EC 2.7.7.7) [25]. Taq DNA polymerase specifications are displayed in the Table 6.
The error rate of Taq DNA polymerase is approximately 2-3x 10e-5 (per base, per cycle) [26].
Table 6: Taq DNA polymerase. Specification
5
Concentration: 5 units/µl Amplification efficiency: ≥10 fold
Recombinant enzyme: Yes 5' 3' exonuclease activity: Yes
Substrate analogs: dNTP, ddNTP, dUTP, Extra A addition: Yes
biotin-11-dUTP, 3' 5' exonuclease activity: No
DIG-11-dUTP, Contaminating nucleases: No
fluorescent-dNTP/ddNTP Contaminating RNases: No
Extension rate: 2–4 kb/min at 72°C Contaminating proteases: No
Half-life: 10 min at 97°C Self-priming activity: No
60 min at 94°C
C1. PCR method
For each gene, the PCR reaction was prepared according to the following protocol: 3 l water, 0.5 l
forward primer, 0.5 l reverse primer, 1 l cDNA and 5 l of multiplex master mix 2X. Then PCR tubes were
put in thermo-cycler machine for 35 cycles with the following thermo-cycler program:
95°C 15 minutes (activating of Taq enzyme)
94°C 30 seconds (denaturation step)
55°C 1.30 minutes (annealing step)
72°C 1.30 minutes (elongation step)
72°C 10 minutes (final elongation step)
4°C ∞
D. Gel extraction
After PCR, the products were run on an agarose gel (1%) for DNA electrophoresis. When bands were
visible, pictures were generated using an ultraviolet (UV) camera. Then, in order to check the products, these
bands were compared with the plasmid used as positive control. Then the bands were cut and gel extraction
was performed.
Link between H1N1 sequence and immunological Symptoms Page 12D1. Gel extraction method
The QIAquick gel extraction protocol was used. This protocol initiates by weighting gel slices. Then
suitable volumes of QG buffer were added to these gel slices. Afterward, this mix (gel and QG buffer) was
incubated at 50°C for 10 minutes in order to solve the gel completely in buffer. Then, suitable volumes of
isopropanol were added to this mix. The mix was transferred to QIAquick spin column with a 2 ml collection
tube. This column was centrifuged with 13000 rpm for 1 minute. The flow-through after centrifugation was
discarded. The QG buffer was added again to the column and was centrifuged for 1 minute. The flow through
was discarded. PE buffer was added to the column and was kept for 3 minutes at room temperature. This step
increased the concentration of extraction. After 3 minutes, this column was centrifuged for 1 minute. The
flow-through was discarded and was centrifuged for additional 1 minute in order to remove the residual
ethanol from buffer PE. Lastly, the column was put into new 1.5 ml microtubes and then 30 l of elution
buffer (EB) was added to it, kept for 1 minute at room temperature, then was centrifuged for 1 minute. The
flow through in the new microtube containing the DNA was used for subsequent sequencing.
E. Sequencing
Before sequencing, the DNA content was measured using a NanoDrop spectrophotometer (Thermo
scientific, Surrey, United Kingdom).
E1. Sequencing method
For each gene, two reactions were prepared, one for the reverse and the other for the forward
sequencing. The protocol of sequencing was: 2 l big dye, 6 l buffer, 0.16l forward primer with high
concentration for the forward reaction, 0.16l reverse primer, 50 nanograms (ng) gel extract for each
reaction, water up to 20 l. These reaction tubes were put in thermo-cycler for 25 cycles using the following
template: 96°C for 5minutes, 96°C for 30 seconds, 50°C for 15 seconds and 60°C for 4 minutes.
F. Sequencing PCR purification
By this purification, interference is reduced.
F.1. Sequencing PCR purification method
At first, ETDA at 0.125M and ethanol 100% were added to sequencing products and then samples
were incubated at room temperature for 5 minutes. Afterward, tubes were centrifuged with 14000 rpm for 30
minutes at 4°C. Supernatants were decanted and ethanol 70% was added to samples. Then samples were
centrifuged for 10 minutes at room temperature. Again, supernatants were decanted and dried completely.
Lastly, 20 ml Hidi was added to tubes and tubes were transferred to a sequencing plate. Before sequencing,
sequencing plates were put at 96°C for 2 minutes for denaturation. Then, the sequencing plates were covered
with aluminum foil and transferred to the sequencing core at SMI (AB applied biosystem 7500). This machine
works with a dye terminator method, which is based on capillary electrophoresis.
Link between H1N1 sequence and immunological Symptoms Page 133. Results
Results of this study are divided into three groups: symptoms, serology and potential flu peptide
epitopes.
3.1 Symptoms
Symptoms were collected from individuals who were infected by H1N1 (time point B1) in order to
study the effect of flu mutations in infected individuals. Symptoms during H1N1 infection were collected by
interviews and website questionnaires. Symptoms, included: fever, cough, headache, chest pain, chill, fatigue,
sore throat, ear pain, sneeze, and muscles pain.
3.2 Serology results
The results included IFN-production in response to three different antigens i.e. influenza
A/Brisbane/59/2007 (H1N1), A/Solomon Island/03/2006 (H1N1) and M1 at two different time points: B1
(during H1N1 infection) and C1 (after infection). In general, the IFN- concentration at the time point B1 was
higher as compared to the IFN- concentration at the time point C1. In Table 8, the IFN- concentration of 18
pg/ml is equal to the negative control (background production). The Table 7 lists only IFN-data from
individuals with a positive H1N1 PCR.
Table 7: IFN- production against A/Brisbane, A/Solomon and M1 antigens at two different time point (B1 and C1).
IFN- (pg/ml) IFN- (pg/ml) IFN- (pg/ml)
IFN- (pg/ml) M1 IFN- (pg/ml) IFN- (pg/ml)
Sample ID A/Brisbane/59/2007 A/Solomon A/Solomon
B1 A/Brisbane/59/2007 C1 M1 C1
B1 Island/03/2006 B1 Island/03/2006 C1
091112-2 589.00 589.00 112.05 589.00 589.00 18.00
091229-6 589.00 589.00 18.00 56.63 51.12 18.00
091113-12 589.00 589.00 18.00 589.00 589.00 49.26
091207-6 589.00 589.00 87.12 18.00 18.00 162.70
091113-8 359.59 284.45 324.65 589.00 589.00 18.00
091208-5 589.00 589.00 20.38 285.86 173.95 41.46
091123-4 18.00 18.00 18.00 18.00 18.00 18.00
091218-2 148.14 388.79 127.12 230.81 496.44 30.93
091126-13 589.00 589.00 439.35 112.18 250.51 18.00
091215-10B 589.00 425.84 75.42 589.00 589.00 18.00
091124-12 389.22 327.84 21.63 18.00 18.00 18.00
Average 458.00 452.62 114.7 281.40 312.10 37.25
The concentration of IFN- at the time point B1 (during infection) is higher as compared to the time point
C1 (after infection). However, some patients samples showed similar IFN- production to the same flu
antigens at time points B1 and C1.
3.3 Genetic results
H1N1 positive samples were selected among various flu virus samples. This selection was performed
according to the results of GeXP influenza A (H1N1), a gold standard for recognizing H1N1. One of the GeXP
Link between H1N1 sequence and immunological Symptoms Page 14graph result is displayed below (Figure 2). According to the viral RNA level, 13 samples, which showed high-
level of viral RNA, were chosen for PCR analysis followed by DNA sequencing.
RP DNA A INF
H1N1 09 Figure 2: GeXP influenza virus.
This graph shows the existence of
H1N1 Ge H1N1 RNA. RPDNA is a human
RNA polymerase (control). The
peak of influenza A (A INF) shows
the existence of influenza A group.
H1N1Ge is the branch of influenza
A and H1N1 09 reflected H1N1
Size (nt)
PCR for two genes (HA and M) for 13 H1N1 positive samples were performed. For amplifying the HA
gene, two different primers were used (HA1 with 811 bp and HA2 with 996 bp). These PCR products were run
on an agarose gel (1%). Beside the samples, a PCR for a plasmid M1 and plasmid H1 were included as positive
controls. A picture of these PCR experiments is displayed in the figure3.
Figure 3: PCR picture of H1, H2 and M genes. H1 gene size: 811 bp, H2 gene size: 996 bp and M gene size: 759 bp. Positive controls
in this PCR are plasmids containing H1, H2 and M (H1*, H2*, M1*).
H1 H1* H2 H2*
____ ___ ___ ___ ___ ___ _____ ___ ___ ___ ___ ___
—— —— —— __
M1 M1*
Amplicons were extracted from the gel and were then used for direct sequencing. These sequencing
results were analyzed with Clustral-W and Chromas Pro softwares, two mutations in the M gene and fourteen
mutations in the HA gene were identified. All thirteen HA sample genes, which were analyzed showed at least
two mutations while just two M1 samples (out of the 13 samples) exhibited mutations. These mutations
cause the amino acid translation to change. The mutations in M genes were: E23K (glutamic acid to lysine)
and K242G (lysine to glycine). The mutations in HA genes were: S91N (serine to asparagine), P100S (proline to
serine), I113T (isoleucine to threonine), A151T (alanine to threonine), P154S (proline to serine), L168I (leucine
to isoleucine), N173K (asparagine to lysine), S220T (serine to threonine), D239E (aspartic acid to glutamic
acid), N304D (asparagine to aspartic acid), I312T (isoleucine to threonine), P314S (proline to serine), I338V
Link between H1N1 sequence and immunological Symptoms Page 15(isoleucine to valine) and R526K (arginine to lysine). The mutations and changes in DNA sequences and amino
acids translation are shown in Tables 8, 9.
Table 8: Mutations in the M gene sequence and amino acid translation.
Sample ID M gene DNA sequence Amino acid translation
California (A/08/2009) TCAAAGCCGAG 69 PLKAEIAQ 26
091124-12M TCAAAGCGAAG 69 PLKAKIAQ 26
California (A/08/2009) CTACCAGAAGC 727 QAYQKRMGV 246
091218-2M CTACCAAGGGC 727 QAYQGRMGV 246
California (A/08/2009 (H1N1)) was used as the reference strain.
Table 9: Mutations in the HA gene sequence and amino acid translation.
California (A/08/2009) vs Amino acid translation/mutation
HA gene DNA sequence
sample analyzed position
California (A/08/2009) AGAGTGTGAATCACTCTCCACAGCAAGC 273 LSTASSW / 91
091112-2 AAC LSTANSW / 91
California (A/08/2009) TGGTCCTACATTGTGGAAACACCTAGTT 304 IVETPSS / 100
091229-6 TCT IVETSSS / 100
California (A/08/2009) GTGTTACCCAGGAGATTTCATCGATTAT 345 PGDFIDY / 113
091208-5 ACC PGDFTDY / 113
California (A/08/2009) ACGGCAGCATGTCCTCATGCTGGAGCA 474 KGVTAACPHA / 151 and 154
091208-5 and 091113-8 ACA TCT KGVTTACSHA / 151 and 154
LIWLVKKGNSY / 168 and 173
California (A/08/2009) TGGCTAGTTAAAAAAGGAAATTCATAC 525
LIWIVKKGKSY / 168 and 173
091123-4 and 091215-10B ATA AAA
California (A/08/2009) GTCATCAAGATACAGCAAGAAGTTCAA 684 VFVGSSR / 220
091229-6 ACA VFVGTSR / 220
California (A/08/2009) GATCAAGAAGGGAGAATGAACTATTAC 744 KVRDQ / 239
091113-8 GAA KVREQ / 239
California (A/08/2009) GTCAAACACCCAAGGGTGCTATAAACAC 930 GAINTSL / 304
091124-12 GAC GAIDTSL / 304
California (A/08/2009) CCCATTTCAGAATATACATCCGATCACAA 963 PFQNIHPIT / 312 and 314
091207-6 and 091123-4 ACA TCG PFQNTHSIT / 312 and 314
California (A/08/2009) AATATCCCGTCTATTCAATCTAGAGGCCT 1040 GLRNIPS/ 338
091112-2 GTC GLRNVPS / 338
California (A/08/2009) GATGGGGTAAAGCTGGAATCAACAAGG 1578 LESTRIY / 526
091207-6 AAA LESTKIY / 526
Most mutations occur in the position 270-1040. Some samples showed several mutations. A representative example
is shownItinisTable
possible
10. that, these mutations change the epitopes that different human leucocyte antigen (HLA)
Link between H1N1 sequence and immunological Symptoms Page 16It is possible that, these mutations change the epitopes that different human leukocyte antigen (HLA)
molecules can bind and present to CD8+ T-cells. Therefore, all mutations in both HA and M genes were
evaluated using the SYFPEITHI software for binding to common HLA-molecules. This software can predict the
epitopes and the ligation strength to a defined HLA type for a sequence of amino acids. According to this
software, epitopes, with score of 20-30, can bind to HLA strongly. Some mutations didn’t show an effect on
epitopes. Some mutations, which showed score between 20 to 30 along with symptoms and IFN-
concentration to flu antigens at two time points (B1 and C1), are reported in Table 10 and Table 11. In Table
10, two mutations (E23K andK242G), in the M1 gene along with the IFN-production (in response to M1
antigen) are listed. K242G in the M1 gene showed a higher score in HLA-B*2705-binding.
Table 10: M1 genes mutations, and IFN- production at the time point of symptoms (B1, 10-14 days after onset of symptoms) and the time
point C1 (after flu season). Symptoms were not reported for two the samples showed in this Table.
Mutation in amino maximum
epitopes Epitopes IFN- (pg/ml) IFN- (pg/ml)
sample ID the M1 acid HLA score in this
Score M1 antigen B1 M1 antigen C1
gene position HLA
091124-12 E23K 23 HLA-A*0201 K I A Q R L E S V 30 27 21.63 18
California
------- 23 HLA-A*0201 E I A Q R L E S V 30 23 ------- -------
(A/08/2009)
091218-2 K242G 242 HLA-B*2705 G R M G V Q M Q R 30 30 127.12 30.93
California
------- 242 HLA-B*2705 K R M G V Q M Q R 30 29 ------- -------
(A/08/2009)
Mutation in M gene, K242G (Lysine to Glycine), mutant amino acid are underlined.
Five mutations in Table 11.1.A and 11.1.B are listed: P100S, S220T, D239E, P314S and I338V. It seems
that mutations in I338V and D239E result in increased MHC class I binding scores compared to other
mutations. It seems that two mutations in HA gene, P100S and S220T impact on MHC class I binding. Two flu
infected individuals didn’t attend to the second blood sampling at the time points B1 and C1. H1N1 positive
samples from these individuals had mutations in P100S and S220T. The results of these two viral samples
were excluded in the Table 11.1.
Link between H1N1 sequence and immunological Symptoms Page 17Table11.1.A: HA gene mutation, symptoms and IFN- production at the time point of symptoms (B1, 10-14 days after onset of symptoms) and the time point C1 (after flu season).
Sample ID HA gene Amino HLA Epitope Max. Epitope IFN-pg/ml) IFN-pg/ml) IFN-pg/ml) IFN-pg/ml) Symptom
mutation acid score score A/Brisbane A/Solomon A/Brisbane C1 A/Solomon
B1 B1 C1
Chest pain, cough, fatigue,
091113-8 D239E 239 HLA-A*01 E Q E G R M N Y Y 26 23 359.59 284.45 589 589
sore throat
symptoms were not
091124-12 D239E 239 HLA-A*01 E Q E G R M N Y Y 26 23 389.22 327.84 18 18
reported
California
------- 239 HLA-A*01 D Q E G R M N Y Y 26 23 ------- ------- ------- ------- -------
A/08/2009
Fever, chill, cough,
091112-2 I338V 338 HLA-B*0702 V P S I Q S R G L 22 22 589 589 589 589 headache, fatigue, sore
throat
Fever, chill, cough,
091123-4 I338V 338 HLA-B*0702 V P S I Q S R G L 22 22 18 18 18 18 headache, fatigue,
muscles pain, sneeze
symptoms were not
091124-12 I338V 338 HLA-B*0702 V P S I Q S R G L 22 22 389.22 327.84 18 18
reported
symptoms were not
091207-6 I338V 338 HLA-B*0702 V P S I Q S R G L 22 22 589 589 18 18
reported
California
------- 338 HLA-B*0702 I P S I Q S R G L 23 23 ------- ------- ------- ------- -------
A/08/2009
Cough, fatigue, headache,
091229-6 S220T 220 HLA-A*1101 T S R Y S K K F K 29 20 589 589 56.63 51.12
muscles pain
Cough, fatigue, headache,
091229-6 P100S 100 HLA-A*01 S S S D N G T C Y 26 20 589 589 56.63 51.12
muscles pain
symptoms were not
091218-2 S220T 220 HLA-A*1101 T S R Y S K K F K 29 20 148.14 388.79 230.81 496.44
reported
symptoms were not
091218-2 P100S 100 HLA-A*01 S S S D N G T C Y 26 20 148.14 388.79 230.81 496.44
reported
symptoms were not
091215-10B S220T 220 HLA-A*1101 T S R Y S K K F K 29 20 589 425.84 589 589
reported
symptoms were not
091215-10B P100S 100 HLA-A*01 S S S D N G T C Y 26 20 589 425.84 589 589
reported
symptoms were not
091208-5 S220T 220 HLA-A*1101 T S R Y S K K F K 29 20 589 589 285.86 173.95
reported
symptoms were not
091208-5 P100S 100 HLA-A*01 S S S D N G T C Y 26 20 589 589 285.86 173.95
reported
California
------- 220 HLA-A*1101 S S R Y S K K F K 29 23 ------- ------- ------- -------- -------
A/08/2009
California
------- 100 HLA-A*01 P S S D N G T C Y 26 19 ------- ------- ------- -------- -------
A/08/2009
Two mutations, I338V and D239E showed higher score (HLA binding) as compared tho other mutations. Mutant amino acids are underlined.
Link between H1N1 sequence and immunological Symptoms Page 18Table11.1.B: HA gene mutation, symptoms and IFN- production at the time point of symptoms (B1, 10-14 days after onset of symptoms) and the time point C1 (after flu season).
Sample ID HA gene Amino HLA Epitope Max. Epitope IFN-pg/ml) IFN-pg/ml) IFN-pg/ml) IFN-pg/ml) Symptom
mutation acid score score A/Brisbane B1 A/Solomon B1 A/Brisbane C1 A/Solomon C1
091207-6 S220T 220 HLA-A*1101 T S R Y S K K F K 29 20 589 589 18 18 symptoms were not reported
091207-6 P100S 100 HLA-A*01 S S S D N G T C Y 26 20 589 589 18 18 symptoms were not reported
Chest pain, fever, chill, cough, fatigue,
091126-13 S220T 220 HLA-A*1101 T S R Y S K K F K 29 20 589 589 112.18 250.51
headache, muscles pain, sneeze
Chest pain, fever, chill, cough, fatigue,
091126-13 P100S 100 HLA-A*01 S S S D N G T C Y 26 20 589 589 112.18 250.51
headache, muscles pain, sneeze
091124-12 S220T 220 HLA-A*1101 T S R Y S K K F K 29 20 389.22 327.84 18 18 symptoms were not reported
091124-12 P100S 100 HLA-A*01 S S S D N G T C Y 26 20 389.22 327.84 18 18 symptoms were not reported
Fever, chill, cough, fatigue, headache,
091123-4 S220T 220 HLA-A*1101 T S R Y S K K F K 29 20 18 18 18 18
muscles pain, sneeze
Fever, chill, cough, fatigue, headache,
091123-4 P100S 100 HLA-A*01 S S S D N G T C Y 26 20 18 18 18 18
muscles pain, sneeze
Fever, cough, chill, fatigue, headache,
091113-12 S220T 220 HLA-A*1101 T S R Y S K K F K 29 20 589 589 589 589
muscles pain, sore throat, ear pain sneeze
Fever, chill, cough fatigue, headache,
091113-12 P100S 100 HLA-A*01 S S S D N G T C Y 26 20 589 589 589 589
muscles pain, sore throat, ear pain, sneeze
California
------- 220 HLA-A*1101 S S R Y S K K F K 29 23 ------- ------- ------- ------- -------
A/08/2009
California
------- 100 HLA-A*01 P S S D N G T C Y 26 19 ------- ------- ------- ------- -------
A/08/2009
Fever, chill, cough, fatigue, headache,
091123-4 P314S 314 HLA-A*03 S I T I G K C P K 27 22 18 18 18 18
muscles pain, sneeze
California
314 HLA-A*03 P I T I G K C P K 27 21 ------- ------- ------- ------- -------
A/08/2009
091113-8 P100S 100 HLA-A*01 S S S D N G T C Y 26 20 359.59 284.45 589 589 Chest pain, cough, fatigue, sore throat
Fever, chill, cough, ear pain, fatigue, sore
091112-2 P100S 100 HLA-A*01 S S S D N G T C Y 26 20 589 589 589 589
throat
California
------- 100 HLA-A*01 P S S D N G T C Y 26 19 ------- ------- ------- ------- -------
A/08/2009
Six/eight blood samples were associated with mutations (S220T and P100S).
Link between H1N1 sequence and immunological Symptoms Page 19Table 12.2: Frequency of symptoms and average of IFN-production in response to flu antigen stimulation at time points B1 and C1.
Average IFN- Average IFN-
Average IFN- Average IFN-
HA Gene N. of Sore Chest Ear Muscles (pg/ml) (pg/ml)
Fever Cough Fatigue Headache Chill Sneeze (pg/ml) (pg/ml)
mutation samples throat pain pain pain A/Solomon A/Solomon
A/Brisbane B1 A/Brisbane C1
island B1 island C1
D239E 2 0 1 1 1 0 0 0 0 0 0 374.405 306.145 303.5 303.5
2 2 1 1 1 1 2 1 1 1
I338V 4 396.30 380.96 160.75 160.75
(50%) (50%) (25%) (25%) (25%) (25%) (50%) (25%) (25%) (25%)
3 4 4 1 4 1 3 1 3 4
S220T 9 454.37 456.16 213.05 244.90
(33%) (44%) (44%) (11%) (44%) (11%) (33%) (11%) (33%) (44%)
3 6 6 3 4 2 4 2 3 4
P100S 11 458.00 452.62 281.40 307.45
(27.2%) (54.5%) (54.5%) (27.2%) (36.3%) (18.1%) (36.3%) (18.1%) (27.2%) (36.3%)
P314S 1 1 1 1 0 1 0 1 0 1 1 18.00 18.00 18.00 18.00
The frequency of fever of individuals infected with a virus showing a mutation in I338V was higher as compared to other HA mutants. Moreover,
the frequency of fatigue in individuals infected with H1N1 showing mutation in P100S appeared to be higher than other mutations.
Link between H1N1 sequence and immunological Symptoms Page 20Discussion
Avian and human influenza preferentially recognize sialic acid linked to galactose by an -2,3
(SA2,3Gal) and -2,6 (SA2,6Gal) linkage, respectively. In human airway, SA2,3Gal is dominantly
expressed, however SA2,6Gal has also been identified in humans. In humans, infection with avian flu is
rare, but highly pathogenic.
Mutations in the flu-HA gene impact on the receptor binding. The most important mutation in the
HA gene, which causes receptor binding to switch from human sialic acid to avian sialic acid is D225G.
Severe diseases were reported from this flu mutant around the world. The most significant mutation in the
M1 gene, which causes H1N1 to become resistance to Amantadine drugs, is S31N. Therefore, studying
mutations in HA and M genes aids to understand the interaction of flu with the immune system and flu
pathogenicity [3].
In this study, five mutations are reported for the HA gene (P100S, S220T, D239E, I338V and P314S).
They show high affinity for binding to HLA molecules. According to Ding and coworkers, D239E is equal to
D225E due to different method of numbering (H1 and H3 numbering respectively). D239E (D225E) was
reported in Hong Kong with severe disease and fatal outcome in Canada, USA and Brazil [21, 22]. In this study,
2/13 samples showed D239E (aspartic acid to glutamic acid) mutations. It seems that H1N1-infected
individuals with these mutants experienced milder symptoms and showed high IFN- production in blood
against influenza antigens at the B1 time point. Based on the epitope prediction score of D239E to HLA
A*0101, there is a possibility of increased binding of these mutant epitopes to MHC class I molecules. This
may cause differential presentation of this epitope and altered activation of CD8+ T-cells with subsequent
IFN-cytokine production. One blood sample showed strong IFN- response at the C1 time point. It is
possible that T-cells, activated by D239E, experienced strong T-cell stimulation and subsequent increased
cytokine production. However, I did not type the MHC class I haplotype of the patients in the current study.
A formal proof of these mutations in viral proteins, leading to aberrant increased or decreased cytokine
production, has not been provided, it has to be shown in future experiments.
A S220T (serine to threonine) flu mutation was reported in South America and China [21, 23]. Ding and
coworkers suggested that this may occur due to natural selection. Moreover, they suggested that S220T has
a different polarity due to the extra methyl group in threonine; polarity may change the recognition and
binding capacity between antigenic epitopes and their specific antigenic receptors. These may include
antibodies or T-cells [21]. In this study, S220T was seen in 10/13 samples (76.9%). The epitope prediction
score of S220T in HLA A*1101 is 20, a score which would still allow good peptide binding. Six/eight blood
samples (75%), which show strong IFN-production (and the respective patients' clinical symptoms) were
associated with mutations (S220T and P100S).
Otherwise, P100S and S220T were reported in South America. Although Goni and coworkers
mapped these substitutions by 3D modeling structure, they found these mutations (P100S andS220T)
were located in the antigenic site E and D respectively (see Figure 4) [23].
I338V (isoleucine to valine) has a maximum epitope prediction score for HLA-B*0702. Therefore,
this epitope may potentially bind to HLA-B*0702 and potentially increase T-cell activation. Three/four
samples, showed a I338V mutation and the corresponding blood samples exhibited also high IFN-
production at the time points B1 (10-14 days after symptoms onset). This may provide support that antigen
mutations impact on T-cell activation and cytokine production. This mutation was also reported in South
Link between H1N1 sequence and immunological Symptoms Page 21America without any specific clinical features. Goni et al studied the place of antigenic epitopes of this
substitution in HA antigenic epitopes. They found that I338V was located outside the major defined HA
antigenic antibody epitopes, but may not affect T-cell recognition (Figure 4) [23].
Figure 4: 3D model of HA. The molecules are colored according to conformational type (turns are shown in light blue, coils in light
red, helices in green, and b-strands in blue, respectively). HA epitopes A–E are shown in space filling representation in grey, red,
green, magenta and yellow, respectively. Epitopes are shown in only one HA molecule of the model for clarity. Substitutions
P100S, S220T, D239G and I338V are shown in white, blue, light blue and violet, respectively, and their positions are indicated by
[23]
an arrow. Two views of the molecules, rotated on the x-axis are shown in A and B respectively .
P314S is another mutation, which was reported in this study. According to Table 12.1.B, this
mutation does not appear to influence IFN- production. The epitope may be able to bind to HLA-A*0301.
Infected Individuals had high number of symptoms, otherwise the IFN- response at both two-time points
(B1 and C1) was negative. Probably, native immune response may not be sufficient to eradicate H1N1 or a
pre-existing (HLA-A3 restricted T-cell response may not be effective). T-cells responses may not be
associated with sufficient IFN- production and therefore, show only limited immune protection.
E23K and K242G are two mutations, which were seen in the M1 gene in this study. The K242G
variation in the M1 gene has a maximum binding score to HLA-B*2705. The respective individual did not fill
in the symptom questionnaire, we could not connect these mutations to clinical features.
Conclusion: It is possible that mutations in flu proteins affect binding to HLA molecules – this has
been suggested based on the in-silico analysis of the MHC class I binding scores of the mutant epitopes.
MHC class I typing of the patients with the respective H1N1 isolates is needed to test for potential
associations of flu point mutations and MHC class I/T-cell recognition. I showed that flu mutations exist in
flu H1N1 isolates from individuals from the Stockholm LifeGene cohort. Future studies, which will link the
MHC class I type, the flu variant and detailed epitope-specific cytokine responses (e.g. by using tetramer
molecules and IFN- production assays) will help to dissect further immune mechanism in flu infection.
Future studies also will show the immunological impact of these point mutations on immune recognition, T-
cell memory responses and clinical symptoms, associated with IFN- production.
Link between H1N1 sequence and immunological Symptoms Page 22Acknowledgements
I thank Prof. Markus Maeurer for experimental guidance, Lalit Rane, Adityasai Sai and Isabelle Magalhaes
for encouragement and technical support.
This study was supported by LifeGene and the Karolinska institute.
References
1. Sinha M, 2009, Swine flu, J Infect Public Health, 2: 157-166.
2. Smith GJ, Vijaykrishna D et al., 2009, Origins and evolutionary genomics of the 2009 swine-origin H1N1
influenza A epidemic, Nature, 459:1122-1126.
3. Arias CF, Escalera-Zamudio M, Soto-Del Río Mde L et al., 2009, Molecular anatomy of 2009 influenza virus
A (H1N1), Arch Med Res, 40: 643-654.
4. Steinhauer DA, Skehel JJ, 2002, Genetics of influenza viruses, Annu Rev Genet, 305–32.
5. Wu W, Booth JL, Duggan ES et al., 2010, Innate immune response to H3N2 and H1N1 influenza virus
infection in a human lung organ culture model, Virology, 396: 178-188.
6. Vincent AL, Lager KM, Ma W et al., 2006, Evaluation of hemagglutinin subtype 1 swine influenza viruses
from the United States, Vet. Microbiol, 118: 212–222.
7. Sinha NK, Roy A, Das B et al., 2009, Evolutionary complexities of swine flu H1N1 gene sequences of 2009,
Biochem Biophys Res Commun, 390: 349-351.
8. Webby RJ, Swenson SL, Krauss SL et al., 2000, Evolution of swine H3N2 influenza viruses in the United
States, J. Virology. 74: 8243–8251.
9. Zhou NN, Senne DA, Landgraf JS et al., 1999, Genetic reassortment of avian, swine, and human influenza
A viruses in American pigs, J. Virology. 73: 8851–8856.
10. Yang Z, Nielsen R, 2000, Estimating synonymous and nonsynonymous substitution rates under realistic
evolutionary models, Mol. Biol. Evol. 17: 32–43.
11. Abbas Ak. Litchtmen AH, Shiv Pillai, 2007, Activation of lymphocytes and effector mechanisms of cell-
mediated immunity, Cellular and Molecular Immunology, 189-214 & 303-320.
12. Combadière B, Sibéril S, Duffy D, 2010, Keeping the memory of influenza viruses, Pathol Biol (Paris).,
58:e79-e86.
13. Peiris JS, Hui KP, Yen HL, 2010, Host response to influenza virus: protection versus immunopathology,
Curr Opin Immunol, 22:475-481.
14. Bermejo-Martin JF, Ortiz de Lejarazu R, Pumarola T et al., 2009, Th1 and Th17 hypercytokinemia as early
host response signature in severe pandemic influenza, Crit Care,13:R201.
15. Cao B, Li XW, Mao Y, et al., 2009, Clinical features of the initial cases of 2009 pandemic influenza A
(H1N1) virus infection in China. N Engl J Med, 361:2507-2517.
16. Committee of the WHO Consultation on Clinical Aspects of Pandemic (H1N1) 2009 Influenza, 2010,
Clinical aspects of pandemic 2009 Influenza A (H1N1) virus infection, N Engl J Med, 362:1708-1719.
17. Centers for Disease Control and Prevention (CDC). Update: influenza activity-United States, August 30,
2009-March 27, 2010. MMWR 2010;59:423-430
18. Alvarez MM, López-Pacheco F, Aguilar-Yañez JM et al., 2010, Specific Recognition of Influenza
A/H1N1/2009 Antibodies in Human Serum: A simple virus-Free ELISA method, Plos One, 5:e10176.
19. http://www.fda.gov/BiologicsBloodVaccines/Vaccines/QuestionsaboutVaccines/ucm186102.html.
20. http://www.novaccine.com/vaccine-ingredients.
Link between H1N1 sequence and immunological Symptoms Page 2321. Ding X, Jiang L, Ke C et al., 2010, Amino acid sequence analysis and identification of mutations under
positive selection in hemagglutinin of 2009 influenza A (H1N1) isolates, Virus Gene, 41:329-340.
22. Glinsky GV, 2010, Genomic analysis of pandemic (H1N1) 2009 reveals association of increasing disease
severity with emergence of novel hemagglutinin in mutations, Cell Cycle, 1;9(5):958-70.
23. Goñi N, Moratorio G, Ramas V et al., 2010, Phylogenetic analysis of pandemic 2009 influenza A virus
circulating in the South American region: genetic relationships and vaccine strain match, Arch Viro,
156(1):87-94.
24. Furuse Y, Odagiri T, Okada T et al., 2010, Differentiation of human influenza A viruses including the
pandemic subtype H1N1/2009 by conventional multiplex PCR, J Virol Methods,168(1-2):94-7.
25. QIAGEN Multiplex PCR Handbook - English (PDF)
26. http://www.qiagen.com/products/pcr/hotstartaqsystem/hotstartaq.aspx#Tabs=t1
Link between H1N1 sequence and immunological Symptoms Page 24You can also read