Identification of differentially expressed genes in the endothelial precursor cells of patients with type 2 diabetes mellitus by bioinformatics ...
←
→
Page content transcription
If your browser does not render page correctly, please read the page content below
EXPERIMENTAL AND THERAPEUTIC MEDICINE 19: 499-510, 2020

                 Identification of differentially expressed genes in the
                  endothelial precursor cells of patients with type 2
                     diabetes mellitus by bioinformatics analysis
                ZHIDA SHEN1*, QI CHEN1*, HANGYING YING1, ZETAO MA1, XUKUN BI1, XIAOTING LI1,
                MEIHUI WANG2, CHONGYING JIN1, DONGWU LAI1, YANBO ZHAO1 and GUOSHENG FU1

                          1
                           Department of Cardiology; 2Biomedical Research Center, Sir Run Run Shaw Hospital,
                            Zhejiang University School of Medicine, Hangzhou, Zhejiang 310016, P.R. China

                                        Received February 15, 2019; Accepted October 18, 2019

                                                     DOI: 10.3892/etm.2019.8239

Abstract. Type 2 diabetes mellitus (DM) is a metabolic                Finally, pathway enrichment of 10% genes in the pink module
disease with worldwide prevalence that is associated with a           ordered by intramodular connectivity (IC) was associated with
decrease in the number and function of endothelial progenitor         the IL17 and the chemokine signaling pathways. The present
cells (EPCs). The aim of the present study was to explore             results revealed that the expression of IL8 and CXCL1 may
the potential hub genes of EPCs in patients with type 2 DM.           serve important roles in the pathophysiology of EPCs during
Differentially expressed genes (DEGs) were screened from a            type 2 DM and inflammatory response may be critical for
public microarray dataset (accession no. GSE43950). Pathway           the reduced number and hypofunction of EPCs isolated from
and functional enrichment analyses were performed using               patients with diabetes.
the Database for Annotation, Visualization and Integrated
Discovery. The protein‑protein interaction (PPI) network              Introduction
was visualized. The most significantly clustered modules and
hub genes were identified using Cytoscape. Furthermore, hub           Diabetes mellitus (DM) is a worldwide health care problem
genes were validated by quantitative PCR analysis of EPCs             that places a heavy burden on patients and society. Diabetes
isolated from diabetic and normal subjects. Subsequently,             and other parameters of metabolic disorder are considered risk
weighted gene co‑expression network analysis (WGCNA)                  factors for cardiovascular disease. Diabetic patients exhibit
was performed to identify the modules incorporating the               a two‑ to four‑fold increased risk of cardiovascular disease,
genes exhibiting the most significant variance. A total of            while endothelial cell dysfunction has a major role in the
970 DEGs were obtained and they were mainly accumu-                   initiation and progression of vascular complications (1). The
lated in inflammation‑associated pathways. A total of 9 hub           endothelium is a semipermeable monolayer of spindle‑shaped
genes were extracted from the PPI network and the highest             endothelial layers that help maintain vascular homeostasis
differential expression was determined for the interleukin 8          under physiological conditions (2). In diabetes, endothelial
(IL8) and CXC chemokine ligand 1 (CXCL1) genes. In the                function is compromised, including reduced plasma nitric
WGCNA performed to determine the modules associated                   oxide, increased generation of reactive oxygen species,
with type 2 DM, one module incorporated IL8 and CXCL1.                increased leukocyte infiltration and subsequent inflammation
                                                                      load (3,4). Therefore, ameliorating endothelial dysfunction
                                                                      is a major focus for the prevention and treatment of diabetic
                                                                      vascular complications. Compared with type 1 DM, which is
                                                                      characterized by the autoimmune destruction of β‑cells, type 2
Correspondence to: Dr Yanbo Zhao or Dr Guosheng Fu,                   DM accounts for 90‑95% of all cases of diabetes (5). Type 2
Department of Cardiology, Sir Run Run Shaw Hospital, Zhejiang         DM is insulin‑independent and usually characterized by a
University School of Medicine, 3 East Qingchun Road, Hangzhou,
                                                                      partial reduction of insulin secretion and insulin resistance (6).
Zhejiang 310016, P.R. China
                                                                          Endothelial precursor cells (EPCs) are a group of cells
E‑mail: zhaoyb@zju.edu.cn
E‑mail: fugs@zju.edu.cn                                               with the inherent capacity to differentiate into mature
                                                                      cells (7). Asahara et al (8) reported on the isolation of these
*
    Contributed equally                                               CD34‑positive mononuclear cells from human peripheral
                                                                      blood. EPCs have been indicated to integrate into the
Key words: type 2 diabetes mellitus, endothelial progenitor cell,     capillary‑vessel endothelium of rodent hindlimbs induced by
differentially expressed genes, weighted gene co‑expression network   ligation of the artery (9). Previous studies also revealed the
analysis                                                              potency of EPCs in the treatment of endothelial dysfunction
                                                                      induced by diabetes (10,11). However, compared with those in
                                                                      healthy subjects, EPC counts were lower, and the function was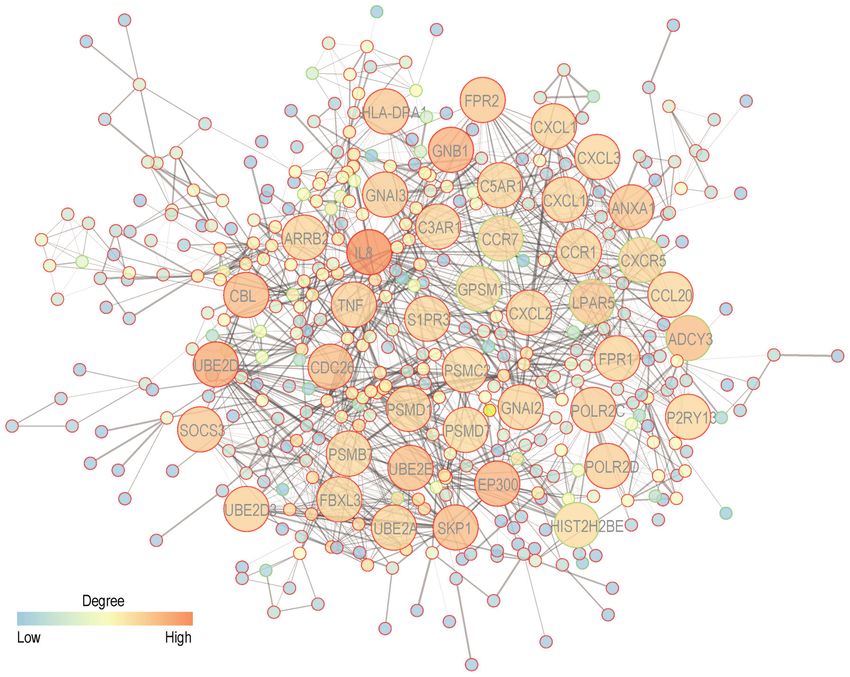
500                                         SHEN et al: DEGs IN THE EPCs OF TYPE 2 DM

also disturbed in patients with either type of DM (12‑14). The      categories BP, CC and MF, and the top 10 KEGG pathways were
development of strategies to improve the counts and activity        presented in bubble plots generated with ggplot2 (https://cran.
of EPCs in patients with DM is a major focus in the field of        rproject.org/web/packages/ggplot2/index.html) in R.
autologous cell therapy. As EPCs from patients with diabetes
exhibit different behaviors compared with those from healthy        PPI network construction. A PPI network was generated
subjects, several different approaches have been investigated       to infer the interactions among proteins. The PPI network
to restore their dysregulation and dysfunction by targeting         was constructed using the Search Tool for the Retrieval
specific sites (15‑18).                                             of Interacting Genes and proteins (STRING) database
    In the present study, differentially expressed genes (DEGs)     (https://string‑db.org/) (24). To explore the regulatory mecha-
in EPCs from patients with type 2 DM vs. healthy subjects were      nisms, interactions with the highest confidence of a combined
identified. These DEGs were then subjected to gene ontology         score >0.900 were imported into Cytoscape to construct the
(GO) and pathway enrichment analyses. A protein‑protein             PPI network.
interaction (PPI) network was then constructed and visual-
ized, and hub genes were identified by molecular complex            Module selection. To obtain clusters of genes in the PPI
detection (MCODE). The top 9 hub genes were subsequently            network, MCODE was used to identify the modules in the
verified by reverse transcription‑quantitative (RT‑q)PCR in         PPI network. The cutoff criteria were ‘degree cutoff=2’, ‘node
an independent sample set originating from our study center.        score cutoff=0.2’, ‘k‑core=2’ and ‘maximum depth=100’.
To further explore the genes that may be associated with the
hub genes, a weighted gene co‑expression network analysis           Analysis of hub genes. To obtain a balance between the
(WGCNA) was performed to determine a relevant module that           core genes and to avoid missing any key gene, hub genes
incorporates the hub genes, especially interleukin 8 (IL8) and      were extracted using cytoHubba. A total of 12 topological
CXC chemokine ligand 1 (CXCL1).                                     analyses were provided by the cytoHubba plugin (25). In
                                                                    accordance with previous reports, a total of 3 most widely
Materials and methods                                               used topological analysis methods, including maximal clique
                                                                    centrality (MCC), maximum neighborhood component
Obtainment and pre‑processing of microarray data. Gene              (MNC) and density of maximum neighborhood component
expression profiles of EPCs from healthy and type 2 diabetic        (DMNC), were used to identify potential hub genes (25,26).
subjects were obtained from the Gene Expression Omnibus             The overlapping genes were selected as the hub genes using
database (GEO; www.ncbi.nlm.nih.gov/geo/). The accession            Venn diagrams.
number was GSE43950, and this dataset included a total of
14 samples: A total of 9 type 2 diabetes late stage EPC samples     Construction of the co‑expression network and identification
and 5 healthy late EPC stage samples. The definition of early       of significant modules. The WGCNA package in R was used
and late stage EPCs is discussed in a previous study (19). Late     to construct a co‑expression network (27). After calculating
EPC samples referred to the EPCs appeared aged 2‑4 weeks            the correlation of all pairwise genes by Pearson's correlation
and exhibited a cobblestone‑like morphology (8). The 9 type 2       matrices, the appropriate soft‑threshold power β was selected
diabetes late EPC samples consisted of 5 samples obtained           for the construction of modules using the pickSoftThreshold
from the type 2 diabetes patients with microvascular compli-        function ranging from 1 to 30. The power of β=16 (scale‑free
cations and 4 samples from the type 2 diabetes patients             R2=0.818) was selected to construct a scale‑free network. The
without clinical microvascular injuries. To identify the DEGs       topological overlap matrix (TOM) was therefore constructed
in patients with type 2 diabetes vs. non‑diabetic controls, the     to measure the network connectivity of each gene, defined
9 diabetes samples were analyzed together. The platform used        as the sum of its adjacency with all other genes for network
was the Rosetta/Merck Human RSTA Custom Affymetrix 2.0              generation (28). The interaction analysis among different
microarray GPL10379. First, the expression matrix from the          co‑expression modules was performed using the flashClust
GEO database was pre‑processed using the robust multi‑array         function, and the average linkage hierarchical clustering
analysis method. The probe ID for each gene was then                was used with a minimum size of 500 for the gene dendro-
converted to a gene symbol using annotation files obtained from     gram (29). The module‑trait association was estimated using
the platform. DEGs were identified by the limma algorithm           the correlation between the module eigengene and the pheno-
(http://www.bioconductor.org/packages/2.9/bioc/html/limma.          type. Gene significance (GS) was defined as the absolute value
html) in R software (20,21). A P‑value of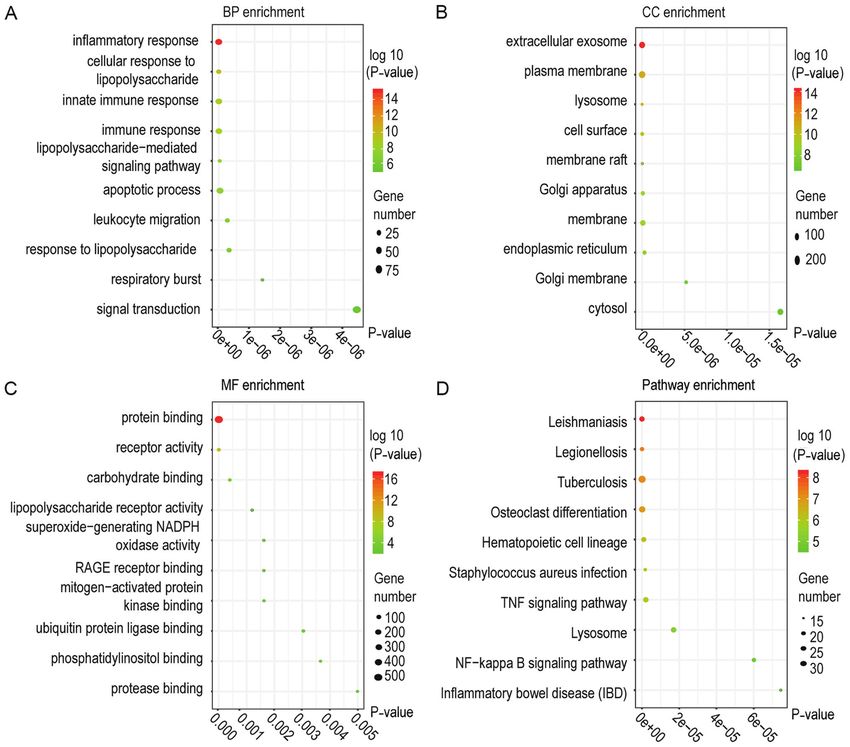
EXPERIMENTAL AND THERAPEUTIC MEDICINE 19: 499-510, 2020                                                                              501

Table I. Primers used for quantitative PCR.

                                                                                                  Primer sequence (5'→3')
	‑‑‑‑‑‑‑‑‑‑‑‑‑‑‑‑‑‑‑‑‑‑‑‑‑‑‑‑‑‑‑‑‑‑‑‑‑‑‑‑‑‑‑‑‑‑‑‑‑‑‑‑‑‑‑‑‑‑‑‑‑‑‑‑‑‑‑‑‑‑‑‑‑‑‑‑‑‑‑‑‑‑‑‑‑‑‑‑‑‑‑‑‑‑‑‑‑‑‑‑‑‑‑‑‑‑‑‑‑‑‑‑‑‑‑‑‑‑‑‑‑‑‑‑‑‑‑‑‑‑‑‑‑‑‑‑‑‑‑‑‑‑‑‑‑‑‑‑‑‑‑‑‑‑‑‑‑‑‑‑‑‑‑‑‑‑‑‑‑‑‑‑‑‑‑‑‑‑‑‑‑‑‑‑‑‑
Gene                                                             Forward                                                                                 Reverse

IL8                                         TTTTGCCAAGGAGTGCTAAAGA                                                                AACCCTCTGCACCCAGTTTTC
FPR1                                        AAGGCCATGGGAGGACATTG                                                                  CAGGGCCCAATGATCACCTT
CXCL1                                       CTGGCGGATCCAAGCAAATG                                                                  GCCCCTTTGTTCTAAGCCAG
GNAI3                                       ATCGACCGCAACTTACGGG                                                                   AGTCAATCTTTAGCCGTCCCA
FPR2                                        CTGAATGGATCAGAAGTGGTGG                                                                CCCAAATCACTAGTCCATTGCC
GNAI2                                       TACCGGGCGGTTGTCTACA                                                                   GGGTCGGCAAAGTCGATCTG
ANXA1                                       GCGGTGAGCCCCTATCCTA                                                                   TGATGGTTGCTTCATCCACAC
GNB1                                        GTGAGCTTGACCAGTTACGG                                                                  TGTGATCTGAGAGAGAGTTGCAT
LPAR5                                       CGCCATCTTCCAGATGAAC                                                                   TAGCGGTCCACGTTGATG
GAPDH                                       CCTGCACCACCAACTGCTTA                                                                  GGCCATCCACAGTCTTCTGAG

with type 2 DM or from non‑diabetic controls at Sir Run Run                                     480 II system (Roche Life Science). For each well, the reaction
Shaw Hospital (Hangzhou, China). Type 2 DM was diagnosed                                        mixture contained 2 µl cDNA, 0.4 µl forward primer (0.2 µM),
according to the American Diabetes Association criteria (33).                                   0.4 µl reverse primer (0.2 µM), 7.2 µl RNA‑free water and
Inclusion/exclusion criteria for the patients enrolled in the                                   10 µl 2X UltraSYBR Mix. The reactions were incubated at
present study were as follows: Age >50 years, willingness to                                    95˚C for 10 min, followed by 40 cycles of 95˚C for 15 sec and
provide written informed consent, no acute myocardial infarc-                                   60˚C for 1 min. The expression data were normalized to the
tion and no acute stroke. The patients with type 2 DM were                                      reference GAPDH. FCs of relative mRNA expression were
diagnosed >5 years previously. Furthermore, major diabetic                                      calculated using the change‑in‑threshold method (2‑ΔΔCq) (37).
complications (diabetic retinopathy, diabetic nephropathy,                                      The primer sets used for qPCR are listed in Table I.
diabetic neuropathy, lower limb arteriopathy) were recorded
according to criteria described previously (34). A total of                                     Statistical analysis. All experiments were performed at least
8 patients were enrolled in the present study between April                                     three times. All results are expressed as the mean ± standard
2017 and April 2018. EPCs were isolated, cultured and char-                                     deviation. Statistical analyses were performed using
acterized according to methods previously reported (35).                                        Student's t‑test with GraphPad Prism 7 software (GraphPad
The study procedure was approved by the Ethics Review                                           Software, Inc.). P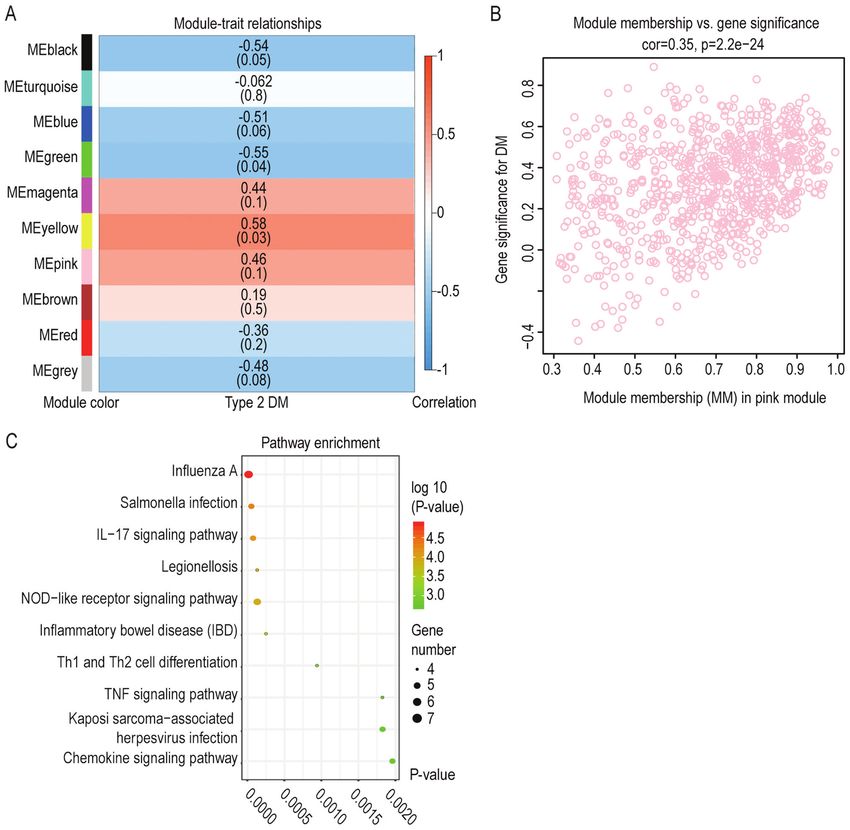
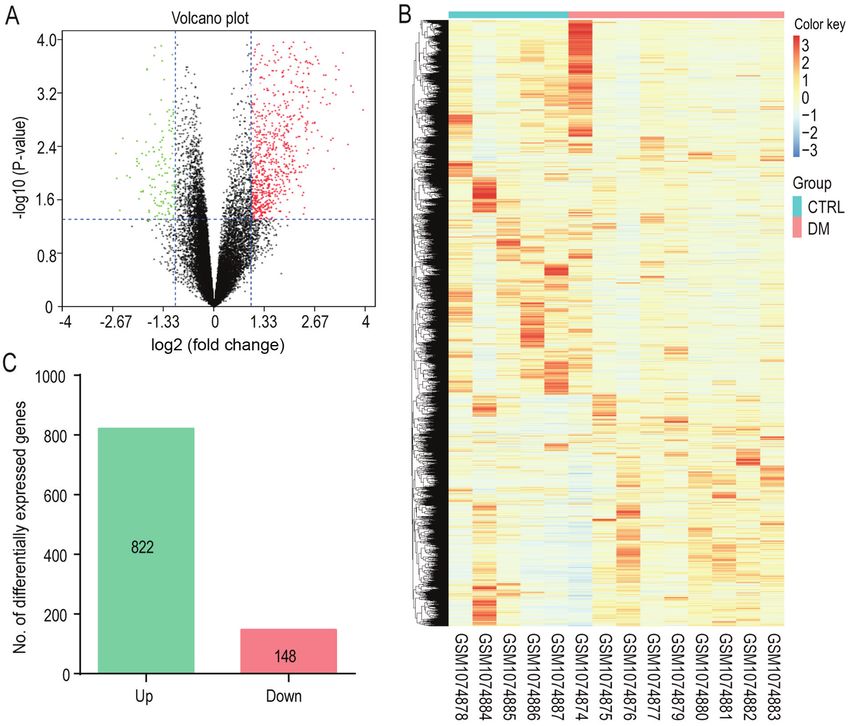
502                                                 SHEN et al: DEGs IN THE EPCs OF TYPE 2 DM

Figure 1. The volcano plot and heatmap of differentially expressed genes in type 2 DM. (A) Volcano plot of DEGs. The x‑axis represents the log2 FC and the
y‑axis represents the log10 (P‑value). The green dots represent downregulated genes and red dots represent upregulated genes. (B) Heat map of DEGs following
clustering analysis. The vertical axis represents the sample, and the horizontal axis represents DEGs. Red indicates upregulated and blue represents down-
regulated genes. (C) DEGs were selected according to P
EXPERIMENTAL AND THERAPEUTIC MEDICINE 19: 499-510, 2020                                    503

Table II. Top 10 up‑ and downregulated differentially expressed   Discussion
genes.
                                                                  EPCs are a group of multipotent precursor cells that have
A, Upregulated genes			                                           the capacity to differentiate into blood vessels and blood
                                                                  cells (38). However, in previous studies, the number and
Gene         Average expression value Log2 FC        P‑value      function of EPCs were indicated to be decreased in patients
                                                                  with type 2 DM (12,39). Thus, identification of DEGs may be
NLRP3                  7.94243           3.05234    2.44x10‑10    beneficial for the elucidation of the pathophysiology of EPCs
NINJ1                  8.64930           2.94253    2.39x10‑9     in patients with diabetes. By analyzing the expression profiles
G0S2                   9.91064           6.10854    1.88x10‑8     in the dataset GSE43950 downloaded from the GEO data-
CKAP4                  6.42605           2.65448    8.77x10‑8     base, 970 DEGs were identified, including 822 upregulated
MAFB                   9.35177           3.80994    1.78x10‑7     and 148 downregulated genes. Subsequent analyses included
C20orf24               9.77482           1.48972    2.72x10‑7     GO enrichment analysis of DEGs, KEGG pathway analysis,
C5AR1                  7.62619           4.01330    3.48x10‑7     module selection by MCODE and identification of hub genes
PTX3                   6.21338           3.11387    3.64x10‑7     by cytoHubba. Thereafter, hub genes selected from the PPI
PFKFB3                 8.33607           2.69583    4.12x10‑7     network were validated by RT‑qPCR and associated modules
ID2                   10.66494           1.77079    5.55x10‑7     containing hub genes with the highest FC were investigated.
                                                                  To the best of our knowledge, the present study was the first
                                                                  aiming to determine potential genes associated with EPCs in
B, Downregulated genes			                                         patients with type 2 DM. The present study provides novel
                                                                  insight into the molecular mechanisms of dysfunctional EPCs
Gene         Average expression value Log2 FC        P‑value      in patients with type 2 DM.
                                                                      Through the use of DAVID, GO enrichment analysis of the
TRUB2                  4.16713	‑1.14507             8.59x10‑7     970 DEGs was performed and the most enriched GO terms in
PKIA                   5.22172	‑1.33779             3.09x10‑5     the category BP were associated with ‘inflammatory response,
GPATCH4                7.44535	‑1.25382             3.87x10‑5     response to lipopolysaccharide’ and ‘innate immune response’
EIF5B                  8.92228  ‑1.07249            4.75x10‑5     in patients with type 2 DM. In the category CC, enriched GO
CNNM3                  6.16580	‑1.40637             1.23x10‑4     terms were mainly associated with ‘extracellular exosomes’,
CD72                   3.27212	‑1.55625             1.30x10‑4     ‘plasma membranes’ and ‘lysosomes’. In the category MF,
ZDHHC14                5.93256	‑1.11224             1.68x10‑4     GO terms enriched for DEGs in DM groups included ‘protein
ENO2                   4.21881	‑1.58752             1.72x10‑4     binding’ and ‘receptor activity’. KEGG pathway analysis
PPM1K                  3.60385	‑1.38364             2.05x10‑4     indicated that the DEGs of the type 2 DM group were mainly
DAZAP1                 9.80455	‑1.03973             2.29x10‑4     enriched in the ‘TNF signaling pathway' and ‘NF‑κ B signaling
                                                                  pathway’. The GO terms ‘inflammatory response’, ‘response to
FC, fold change.                                                  lipopolysaccharide’ and ‘innate immune response’ fit well with
                                                                  concept of an inflammatory phenotype in the EPCs of type 2
                                                                  DM as described previously (15). Indeed, it has been indicated
                                                                  that anti‑diabetic drugs that possess the capacity to increase
                                                                  EPC numbers and inhibit premature apoptosis may protect
all 9 genes, IL8 and CXCL1 exhibited the most significant         EPCs from injury by DM partly through alleviation of inflam-
changes.                                                          mation (40). In the category CC, the GO term ‘extracellular
                                                                  exosome' was indicated to be of high relevance. Exosomes have
WGCNA and key module identification. To further explore           been reported to have an important role in the performance
the roles of chemokines in EPCs under diabetic condi-             of EPCs under certain physiological and pathological condi-
tions, WGCNA was used to identify the relevant modules            tions (41‑43). It is reasonable to speculate that the decreased
incorporating IL8 and CXCL1. Prior to construction of the         number and inhibited function of EPCs may partially be attrib-
co‑expression network, the soft‑threshold power of 16 was         uted to the altered exosome content of EPCs in patients with
selected to define the adjacency matrix based on the criterion    type 2 DM. These exosomes may perform multiple biological
of approximate scale‑free topology (Fig. 7A and B). After         functions, including angiogenesis and wound healing (43,44).
determining the soft‑threshold, the TOM was built. A total        In the category MF, DEGs were mainly enriched in ‘protein
of 9 distinct gene co‑expression modules for EPCs were            binding’, ‘receptor activity’ and ‘lipopolysaccharide receptor
constructed and are presented in different colors (Fig. 7C).      activity’. As for the KEGG pathways, the ‘NF‑κ B signaling
IL8 and CXCL1 are included in the pink module (Fig. 8A).          pathway’ and ‘TNF signaling pathway’ were enriched in EPCs
The values between module membership (MM) and gene                of patients with type 2 DM. Above all, these results indicated
significance (GS) in the pink module were presented in            that inflammation may have a major role in the initiation and
Fig. 8B. Genes with high IC were indicated to be tightly          progression of dysfunction of EPCs in patients with DM, in
associated with other genes. The top 10% genes in the pink        accordance with previous studies (15,43).
module ordered by IC were mainly enriched in the pathway              To illustrate the interaction of the DEGs, a PPI network
of IL17 and the chemokine signaling pathway using KEGG            was constructed using the STRING database. The top 3 subnet
pathway analysis (Fig. 8C).                                       modules based on the PPI network were then selected by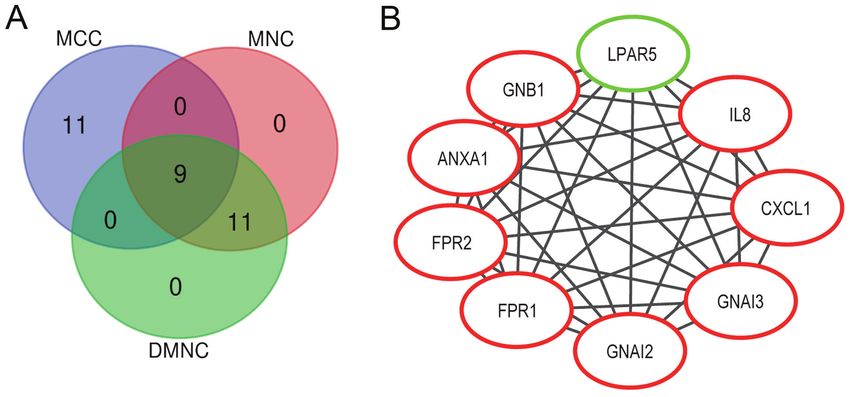
504                                                SHEN et al: DEGs IN THE EPCs OF TYPE 2 DM

Figure 2. GO and KEGG enrichment analyses of DEGs. (A‑C) Scatterplots of the top 10 enriched (A) BP, (B) CC and (C) MF terms for the DEGs. (D) The
top 10 KEGG pathways for the DEGs. The size and color of the dots represent the gene number and the range of P‑values, respectively. DEGs, differentially
expressed genes; GO, Gene Ontology; BP, Biological Process; CC, Cellular Component; MF, Molecular Function; KEGG, Kyoto Encyclopedia of Genes and
Genomes.

MCODE. GO enrichment analysis of these modules (including                     that in patients with type 2 DM, IL8 is elevated in the plasma
subnet modules a, b, and c) revealed that these subnet modules                compared with that in healthy subjects (47). IL8 is considered a
were mainly enriched in the terms inflammation, endocytosis                   canonical angiogenic factor and has a crucial role in the protec-
and Golgi vesicle‑mediated transport processes. The results of                tion of EPCs for attenuating injury and prompting recovery of
the enrichment analysis in the subnet modules further demon-                  damaged tissues (48‑50). Consistent with a previous study, the
strated that inflammation may be crucial for the dysfunction of               current study indicated that IL8 was significantly higher in the
EPCs in patients with type 2 DM.                                              microarrays of EPCs isolated from patients with diabetes (51).
    By overlapping the top 20 genes obtained from the MCC,                    Furthermore, the results of detecting mRNA expression in
MNC and DMNC methods, 9 genes were selected (IL8,                             EPCs under type 2 DM by RT‑qPCR were similar. All these
FPR1, CXCL1, GNAI3, FPR2, GNAI2, ANXA1, GNB1 and                              results indicated that elevated IL8 may be involved in the
LPAR5). Among these genes, IL8 exhibited the most signifi-                    dysfunction of EPCs during the long‑term injury associated
cant difference between the diabetic and control samples. IL8,                with type 2 DM.
as a member of the chemokines, has been reported to activate                      Besides IL8, CXCL1 was also significantly elevated
the motile apparatus of neutrophils, inducing the surface adhe-               with a similar degree to that of IL8. CXCL1, best known
sion of inflammatory cells (45). Monocytes and macrophages                    for its chemotactic activity toward neutrophils and mono-
are usually considered the principal cellular source of IL8.                  cytes/macrophages, is also a potent angiogenic factor (52).
However, a wide variety of nucleated cells, including EPCs, are               Herlea‑Pana et al (53) reported that CXCL1 and its cognate
potential sources of IL8 (46). Previous studies have indicated                receptor, CXC motif chemokine‑receptor‑2 (CXCR2), were
EXPERIMENTAL AND THERAPEUTIC MEDICINE 19: 499-510, 2020 505
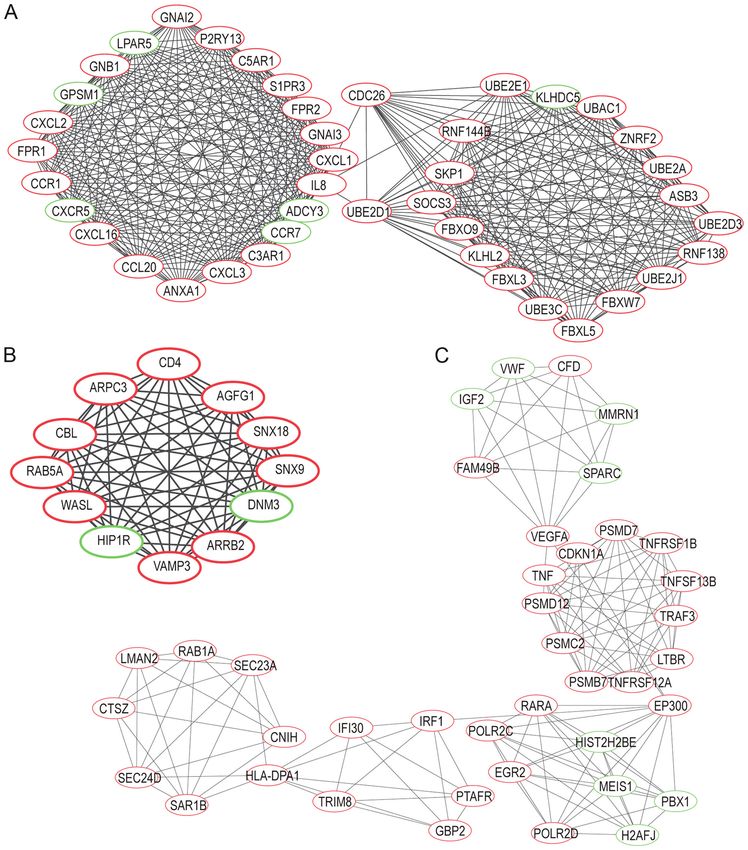
Figure 3. Protein‑protein interaction network of differentially expressed genes. Proteins with degrees ≥20 were visualized in detail. Circles with green and red
margins represent the downregulated and upregulated genes, respectively. Lines indicate protein‑protein interactions.
increased in Reversa mice, an animal model apt to develop functional terms and pathways of the DEGs in the EPCs influ-
plaques when fed an atherosclerosis‑inducing western diet. Of enced by type 2 DM, the array data were analyzed in three steps.
note, elevated CXCL1‑CXCR2 was indicated to have a protec- First, DEGs between healthy subjects and diabetes patients
tive effect to prevent the progression of plaque formation, were determined from the microarrays using the classical
while CXCR2 was able to recruit EPCs to the plaques to repair bioinformatics analysis tool, limma. Subsequent enrichment
the injured endothelium. Likewise, the chemokine system was analysis was performed by DAVID. Hub genes and associated
indicated to be associated with homing and engraftment of modules based on PPI network were selected using cytohubba
EPCs (54). Above all, these results indicated that the chemo- in Cytoscape. Thereafter, the predicted hub genes were vali-
kine system has an important role in the regulation of EPCs dated by RT‑qPCR of EPCs isolated from patients at Sir Run
under diabetic conditions. Run Shaw Hospital (Hangzhou, China). IL8 and CXCL1 were
To further explore the genes that may be associated with IL8 found to exhibit the greatest variation in the EPCs of patients.
and CXCL1 in the microarray data, WGCNA was performed to To identify the genes that were co‑expressed with IL8 and
determine the relevant module that incorporates IL8 and CXCL1. CXCL1, WGCNA, which is an algorithm recently wide used in
A total of 9 modules were recognized by dynamic tree cut, of microarray data analyses to identify the modules with similar
which the pink module contained IL8 and CXCL1. Most genes expression patterns, was applied in the current study (57).
in this module were enriched in the TNF signaling pathway, After selecting the appropriate soft‑threshold power β, the pink
the chemokine signaling pathway and the NOD‑like receptor module was indicated to incorporate IL8 and CXCL1.
signaling pathway. These pathways fit well with the concept of an The present results indicated that inflammation may be an
inflammatory and immune system disorder in type 2 DM (55,56). important mechanism underlying the difference in function
The microarray data analyzed in the present study were and number of EPCs isolated from healthy individuals and
deposited in the GEO as the dataset GSE43950. By analyzing diabetic patients. EPCs have long been regarded as a potential
these microarray data, the present study aimed to identify therapy to accelerate re‑endothelialization of impaired vessels.
candidate genes that may be helpful for understanding the Elevated IL8 expression is also thought to be involved in the
roles of EPC dysfunction under type 2 DM conditions and the repair progress (18). Compared to the successful preclinical
associated mechanisms. Furthermore, to minimize the bias in results, the results of clinical trials on the efficacy parameters
the original expression profiles and to better understand the are conflicting (58,59). Certain studies indicated no beneficial506 SHEN et al: DEGs IN THE EPCs OF TYPE 2 DM Figure 4. Results of the subnet analysis of the PPI network. Three modules, (A) Module a, (B) module b and (C) module c were extracted from the PPI network in Cytoscape using the MCODE plugin. Circles with green and red margins represent the downregulated and upregulated genes, respectively. Lines indicate PPIs. PPI, protein‑protein interaction. Figure 5. Obtainment of 9 hub genes, construction of PPI network and enrichment analysis of hub genes. (A) Overlapping DEGs among the three topo- logical cytoHubba methods including, maximal clique centrality, maximum neighborhood component and density of maximum neighborhood component. (B) PPI interaction network of DEGs determined by STRING and visualized in Cytoscape. Lines indicate protein‑protein interactions. GO, Gene Ontology; KEGG, Kyoto Encyclopedia of Genes and Genomes; PPI, protein‑protein interaction; DEG, differentially expressed gene.
EXPERIMENTAL AND THERAPEUTIC MEDICINE 19: 499-510, 2020                                                        507

Table III. Information on the 9 hub genes.

Gene                            Log2 FC                          P‑value                          Degree                         Expression alteration

IL8    3.89158                                                  9.02x10‑6                            43                              Upregulated
FPR1   3.04300                                                  4.82x10‑5                            22                              Upregulated
CXCL1  2.49797                                                  3.30x10‑4                            22                              Upregulated
GNAI3  2.09317                                                  1.38x10‑3                            24                              Upregulated
FPR2   2.83408                                                  2.84x10‑3                            26                              Upregulated
GNAI2  1.01805                                                  3.26x10‑3                            22                              Upregulated
ANXA1  2.18436                                                  4.56x10‑3                            26                              Upregulated
GNB1   1.12879                                                  1.48x10‑2                            33                              Upregulated
LPAR5	‑1.20699                                                  2.81x10‑2                            25                              Downregulated

FC, fold change; IL8, interleukin 8; FPR1, formyl peptide receptor 1; CXCL1, C‑X‑C motif chemokine ligand 1; GNAI3, G protein subunit
alpha I3; FPR2, formyl peptide receptor 2; GNAI2, G protein subunit alpha 2; ANXA1, annexin A1; GNB1, G protein subunit beta 1; LPAR5,
lysophosphatidic acid receptor 5.

Figure 6. Validation of microarray data by quantitative PCR. The expression of the top 9 hub genes identified from the microarray in detected in endothelial
progenitor cells from patients with DM and healthy controls is provided in bar graphs. (A) IL8, (B) FPR1, (C) CXCL1, (D) GNAI3, (E) FPR2, (F) GNAI2,
(G) ANXA1, (H) GNB1, (I) LPAR5. Values are expressed as the mean ± standard deviation (n=4 in each experiment). *P
508                                                    SHEN et al: DEGs IN THE EPCs OF TYPE 2 DM

Figure 7. Appropriate soft‑threshold power selection and construction of the cluster dendrogram. (A) Analysis of the scale‑free fit index for various soft‑threshold
powers. (B) Analysis of the mean connectivity for various soft‑threshold powers. (C) The co‑expression modules constructed by weighted gene co‑expression
network analysis and visualized in the cluster dendrogram. Each colored row represents a color‑coded module that contains a group of highly connected genes.

Figure 8. Network analysis of gene expression in type 2 DM and investigation of the module containing IL8 and CXCL1. (A) Module‑trait associations. Each
row corresponds to an ME, containing the corresponding correlation and P‑value. The column represents the clinical trait of type 2 DM. The table was colored
according to the correlation between ME and clinical traits. (B) The MM vs. GS plot for the pink module indicated that MM and GS are highly correlated.
(C) Scatterplot of enriched Kyoto Encyclopedia of Genes and Genomes pathways for the pink module. The size and color of the dots represent the gene number
and the range of P‑values, respectively. ME, module eigengene; GS, gene significance; DM, diabetes mellitus; MM, module membership; IL8, interleukin 8;
CXCL1, CXC motif chemokine ligand 1.
EXPERIMENTAL AND THERAPEUTIC MEDICINE 19: 499-510, 2020                                               509

inflammatory responses are critical for the reduced number and       Competing interests
hypofunction of EPCs isolated from diabetic patients.
    The present study has several limitations that should be         The authors declare that they have no competing interests.
pointed out. First, it was not possible to conclude whether
changes in gene expression were the cause or consequence of          References
the complex physiological environment in patients with type
2 DM. Furthermore, the sample size of EPCs was relatively             1. Shi Y and Vanhoutte PM: Macro‑ and microvascular endothelial
small (n=4 for each group). Third, due to the lack of a sorting          dysfunction in diabetes. J Diabetes 9: 434‑449, 2017.
machine, the EPCs in the present study were isolated and              2. Yang C, Kelaini S, Caines R and Margariti A: RBPs play impor-
                                                                         tant roles in vascular endothelial dysfunction under diabetic
cultured in culture dishes. EPCs isolated from the patients              conditions. Front Physiol 9: 1310, 2018.
in Sir Run Run Shaw Hospital were cultured in vitro while             3. Zhang HN, Xu QQ, Thakur A, Alfred MO, Chakraborty M,
CD34 + cells were directly sorted in GSE43950. Therefore,                Ghosh A and Yu XB: Endothelial dysfunction in diabetes and
                                                                         hypertension: Role of microRNAs and long non‑coding RNAs.
the fold changes of identified hub genes may not fit well                Life Sci 213: 258‑268, 2018.
with the predicted outcomes of microarrays in GSE43950.               4. Giacco F and Brownlee M: Oxidative stress and diabetic compli-
Finally, as the clinical traits in the dataset GSE43950 were             cations. Circ Res 107: 1058‑1070, 2010.
                                                                      5. Zimmet P, Alberti KG and Shaw J: Global and societal implica-
limited, the exact clinical characteristics of these patients            tions of the diabetes epidemic. Nature 414: 782‑787, 2001.
were not known. In the current, the probes were annotated             6. Vijan S: In the clinic. Type 2 diabetes. Ann Intern Med 152:
using the platform annotation file, which was last updated in            ITC31‑15; quiz ITC316, 2010.
                                                                      7. Pyšná A, Bém R, Němcová A, Fejfarová V, Jirkovská A,
July 09, 2014 (https://www.ncbi.nlm.nih.gov/geo/query/acc.               Hazdrová J, Jude EB and Dubský M: Endothelial progenitor
cgi?acc=GPL10379). Therefore, some proteins discovered in                cells biology in diabetes mellitus and peripheral arterial
the past few years may not be identified in the present study.           disease and their therapeutic potential. Stem Cell Rev 15:
                                                                         157‑165, 2019.
                                                                      8. Asahara T, Murohara T, Sullivan A, Silver M, van der Zee R, Li T,
Acknowledgements                                                         Witzenbichler B, Schatteman G and Isner JM: Isolation of puta-
                                                                         tive progenitor endothelial cells for angiogenesis. Science 275:
                                                                         964‑967, 1997.
Not applicable.                                                       9. Asahara T and Kawamoto A: Endothelial progenitor cells
                                                                         for postnatal vasculogenesis. Am J Physiol Cell Physiol 287:
Funding                                                                  C572‑579, 2004.
                                                                     10. Dubsky M, Jirkovska A, Bem R, Nemcova A, Fejfarova V and
                                                                         Jude EB: Cell therapy of critical limb ischemia in diabetic
This study was supported by a grant from the Natural Science             patients‑State of art. Diabetes Res Clin Pract 126: 263‑271,
Funds of Zhejiang Province, China (grant no. LY16H020005,                2017.
                                                                     11. Amann B, Luedemann C, Ratei R and Schmidt‑Lucke JA:
LY16H020007, LQ19H020011 and LY19H020007), the Natural                   Autologous bone marrow cell transplantation increases leg
Key Research and Development Project of Zhejiang Province,               perfusion and reduces amputations in patients with advanced
China (grant no. 2018C03015) and the National Natural Science            critical limb ischemia due to peripheral artery disease. Cell
                                                                         Transplant 18: 371‑380, 2009.
Foundation of China (grant nos. 81800706 and 81570246). The          12. Liao YF, Chen LL, Zeng TS, Li YM, Fan Yu, Hu LJ and
funders had no role in study design, data collection and analysis,       Ling Yue: Number of circulating endothelial progenitor cells as a
manuscript preparation or decision to publish.                           marker of vascular endothelial function for type 2 diabetes. Vasc
                                                                         Med 15: 279‑285, 2010.
                                                                     13. Sibal L, Aldibbiat A, Agarwal SC, Mitchell G, Oates C, Razvi S,
Availability of data and materials                                       Weaver JU, Shaw JA and Home PD: Circulating endothelial
                                                                         progenitor cells, endothelial function, carotid intima‑media
                                                                         thickness and circulating markers of endothelial dysfunction in
The datasets used and/or analyzed in the present study are               people with type 1 diabetes without macrovascular disease or
available from the corresponding author on reasonable request.           microalbuminuria. Diabetologia 52: 1464‑1473, 2009.
                                                                     14. Tepper OM, Galiano RD, Capla JM, Kalka C, Gagne PJ,
                                                                         Jacobowitz GR, Levine JP and Gurtner GC: Human endothelial
Authors' contributions                                                   progenitor cells from type II diabetics exhibit impaired prolif-
                                                                         eration, adhesion, and incorporation into vascular structures.
GF and YZ were involved in the conception and design of the study.       Circulation 106: 2781‑2786, 2002.
                                                                     15. Yiu KH and Tse HF: Specific role of impaired glucose
ZS and QC acquired the data and prepared the manuscript. HY, ZM,         metabolism and diabetes mellitus in endothelial progenitor cell
XB, XL, MW, CJ and DWL analyzed and interpreted the data and             characteristics and function. Arterioscler Thromb Vasc Biol 34:
performed the statistical analysis. All authors read and approved        1136‑1143, 2014.
the final manuscript.                                                16. Chen LL, Liao YF, Zeng TS, Yu F, Li HQ and Feng Y: Effects
                                                                         of metformin plus gliclazide compared with metformin alone on
                                                                         circulating endothelial progenitor cell in type 2 diabetic patients.
Ethics approval and consent to participate                               Endocrine 38: 266‑275, 2010.
                                                                     17. Chang TT, Lin LY and Chen JW: Inhibition of macrophage
                                                                         inflammatory protein‑1β improves endothelial progenitor
The study was approved by the Ethics Committee of Sir Run                cell function and ischemia‑induced angiogenesis in diabetes.
Run Shaw Hospital, School of Medicine, Zhejiang University               Angiogenesis 22: 53‑65, 2019.
(Hangzhou, China). All of the patients provided written              18. Ambasta RK, Kohli H and Kumar P: Multiple therapeutic effect
                                                                         of endothelial progenitor cell regulated by drugs in diabetes and
informed consent to participate in the study.                            diabetes related disorder. J Transl Med 15: 185, 2017.
                                                                     19. Cheng CC, Chang SJ, Chueh YN, Huang TS, Huang PH,
Patient consent for publication                                          Cheng SM, Tsai TN, Chen JW and Wang HW: Distinct angio-
                                                                         genesis roles and surface markers of early and late endothelial
                                                                         progenitor cells revealed by functional group analyses. BMC
Not applicable.                                                          Genomics 14: 182, 2013.
510 SHEN et al: DEGs IN THE EPCs OF TYPE 2 DM
20. Gentleman RC, Carey VJ, Bates DM, Bolstad B, Dettling M, 42. Sun J, Zhang Z, Ma T, Yang Z, Zhang J, Liu X, Lu D, Shen Z,
Dudoit S, Ellis B, Gautier L, Ge Y, Gentry J, et al: Bioconductor: Yang J and Meng Q: Endothelial progenitor cell‑derived
Open software development for computational biology and exosomes, loaded with miR‑126, promoted deep vein thrombosis
bioinformatics. Genome Biol 5: R80, 2004. resolution and recanalization. Stem Cell Res Ther 9: 223, 2018.
21. Reiner A, Yekutieli D and Benjamini Y: Identifying differen- 43. Zhang J, Chen C, Hu B, Niu X, Liu X, Zhang G, Zhang C, Li Q and
tially expressed genes using false discovery rate controlling Wang Y: Exosomes derived from human endothelial progenitor
procedures. Bioinformatics 19: 368‑375, 2003. cells accelerate cutaneous wound healing by promoting angiogen-
22. Dennis G Jr, Sherman BT, Hosack DA, Yang J, Gao W, Lane HC esis through Erk1/2 signaling. Int J Biol Sci 12: 1472‑1487, 2016.
and Lempicki RA: DAVID: Database for annotation, visualiza- 44. Ke X, Yang D, Liang J, Wang X, Wu S, Wang X and Hu C: Human
tion, and integrated discovery. Genome Biol 4: P3, 2003. endothelial progenitor cell‑derived exosomes increase proliferation
23. Shannon P, Markiel A, Ozier O, Baliga NS, Wang JT, Ramage D, and angiogenesis in cardiac fibroblasts by promoting the mesen-
Amin N, Schwikowski B and Ideker T: Cytoscape: A software chymal‑endothelial transition and reducing high mobility group Box
environment for integrated models of biomolecular interaction 1 protein B1 expression. DNA Cell Biol 36: 1018‑1028, 2017.
networks. Genome Res 13: 2498‑2504, 2003. 45. Sikora J, Smycz‑Kubanska M, Mielczarek‑Palacz A and
24. Szklarczyk D, Morris JH, Cook H, Kuhn M, Wyder S, Kondera‑Anasz Z: Abnormal peritoneal regulation of chemokine
Simonovic M, Santos A, Doncheva NT, Roth A, Bork P, et al: The activation‑the role of IL‑8 in pathogenesis of endometriosis. Am
STRING database in 2017: Quality‑controlled protein‑protein J Reprod Immunol 77: 2017.
association networks, made broadly accessible. Nucleic Acids 46. Remick DG: Interleukin‑8. Crit Care Med 33 (12 Suppl):
Res 45: D362‑D368, 2017. S466‑S467, 2005.
25. Chin CH, Chen SH, Wu HH, Ho CW, Ko MT and Lin CY: 47. Cai W, Qiu C, Zhang H, Chen X, Zhang X, Meng Q and Wei J:
CytoHubba: Identifying hub objects and sub‑networks from Detection of circulating natural antibodies to inflammatory
complex interactome. BMC Syst Biol 4 (Suppl 8): S11, 2014. cytokines in type‑2 diabetes and clinical significance. J Inflamm
26. Liu J, Yu Z, Sun M, Liu Q, Wei M and Gao H: Identification of (Lond) 14: 24, 2017.
cancer/testis antigen 2 gene as a potential hepatocellular carci- 48. Barcelos LS, Duplaa C, Kränkel N, Graiani G, Invernici G,
noma therapeutic target by hub gene screening with topological Katare R, Siragusa M, Meloni M, Campesi I, Monica M, et al:
analysis. Oncol Lett 18: 4778‑4788, 2019. Human CD133+ progenitor cells promote the healing of diabetic
27. Langfelder P and Horvath S: WGCNA: An R package for weighted ischemic ulcers by paracrine stimulation of angiogenesis and
correlation network analysis. BMC Bioinformatics 9: 559, 2008. activation of wnt signaling. Circ Res 104: 1095‑1102, 2009.
28. Yip AM and Horvath S: Gene network interconnectedness and the 49. Chen C, Lin X, Wang J, Tang G, Mu Z, Chen X, Xu J, Wang Y,
generalized topological overlap measure. BMC Bioinformatics 8: Zhang Z and Yang GY: Effect of HMGB1 on the paracrine action
22, 2007. of EPC promotes post‑ischemic neovascularization in mice. Stem
29. Ravasz E, Somera AL, Mongru DA, Oltvai ZN and Barabasi AL: Cells 32: 2679‑2689, 2014.
Hierarchical organization of modularity in metabolic networks. 50. Liang X, Ding Y, Zhang Y, Tse HF and Lian Q: Paracrine mecha-
Science 297: 1551‑1555, 2002. nisms of mesenchymal stem cell‑based therapy: Current status
30. Shi K, Bing ZT, Cao GQ, Guo L, Cao YN, Jiang HO and and perspectives. Cell Transplant 23: 1045‑1059, 2014.
Zhang MX: Identify the signature genes for diagnose of uveal 51. Montane J, Cadavez L and Novials A: Stress and the inflamma-
melanoma by weight gene co‑expression network analysis. Int J tory process: A major cause of pancreatic cell death in type 2
Ophthalmol 8: 269‑274, 2015. diabetes. Diabetes Metab Syndr Obes 7: 25‑34, 2014.
31. Wang T, Zheng X, Li R, Liu X, Wu J, Zhong X, Zhang W, Liu Y, 52. Belo AV, Leles F, Barcelos LS, Ferreira MA, Bakhle YS,
He X, Liu W, et al: Integrated bioinformatic analysis reveals Teixeira MM and Andrade SP: Murine chemokine CXCL2/KC
YWHAB as a novel diagnostic biomarker for idiopathic pulmo- is a surrogate marker for angiogenic activity in the inflammatory
nary arterial hypertension. J Cell Physiol 234: 6449‑6462 2019. granulation tissue. Microcirculation 12: 597‑606, 2005.
32. Huang da W, Sherman BT and Lempicki RA: Bioinformatics 53. Herlea‑Pana O, Yao L, Heuser‑Baker J, Wang Q, Wang Q,
enrichment tools: Paths toward the comprehensive functional Georgescu C, Zou MH and Barlic‑Dicen J: Chemokine receptors
analysis of large gene lists. Nucleic Acids Res 37: 1‑13, 2009. CXCR2 and CX3CR1 differentially regulate functional responses
33. American Diabetes A: Diagnosis and classification of diabetes of bone‑marrow endothelial progenitors during atherosclerotic
mellitus. Diabetes Care 37 (Suppl 1): S81‑S90, 2014. plaque regression. Cardiovasc Res 106: 324‑337, 2015.
34. Del Coco L, Vergara D, De Matteis S, Mensà E, Sabbatinelli J, 54. Chavakis E, Urbich C and Dimmeler S: Homing and engraftment
Prattichizzo F, Bonfigli AR, Storci G, Bravaccini S, Pirini F, et al: of progenitor cells: A prerequisite for cell therapy. J Mol Cell
NMR‑based metabolomic approach tracks potential serum Cardiol 45: 514‑522, 2008.
biomarkers of disease progression in patients with type 2 diabetes 55. Eyileten C, Kaplon‑Cieslicka A, Mirowska‑Guzel D, Malek L
mellitus. J Clin Med 8: E720, 2019. and Postula M: Antidiabetic effect of brain‑derived neurotrophic
35. Zhao Y, Qiu F, Xu S, Yu L and Fu G: Thymosin β 4 activates factor and its association with inflammation in type 2 diabetes
integrin‑linked kinase and decreases endothelial progenitor mellitus. J Diabetes Res 2017: 2823671, 2017.
cells apoptosis under serum deprivation. J Cell Physiol 226: 56. Domingueti CP, Dusse LM, Carvalho MD, de Sousa LP, Gomes KB
2798‑2806, 2011. and Fernandes AP: Diabetes mellitus: The linkage between
36. Mason MJ, Fan G, Plath K, Zhou Q and Horvath S: Signed weighted oxidative stress, inflammation, hypercoagulability and vascular
gene co‑expression network analysis of transcriptional regulation complications. J Diabetes Complications 30: 738‑745, 2016.
in murine embryonic stem cells. BMC Genomics 10: 327, 2009. 57. Wan Q, Tang J, Han Y and Wang D: Co‑expression modules
37. Shen Z, Chen Q, Jin T, Wang M, Ying H, Lu J, Wang M, construction by WGCNA and identify potential prognostic
Zhang W, Qiu F, Jin C, et al: Theaflavin 3,3'‑digallate reverses markers of uveal melanoma. Exp Eye Res 166: 13‑20, 2018.
the downregulation of connexin 43 and autophagy induced by 58. Wils J, Favre J and Bellien J: Modulating putative endothelial
high glucose via AMPK activation in cardiomyocytes. J Cell progenitor cells for the treatment of endothelial dysfunction and
Physiol 234: 17999‑18016, 2019. cardiovascular complications in diabetes. Pharmacol Ther 170:
38. Raval Z and Losordo DW: Cell therapy of peripheral arterial 98‑115, 2017.
disease: From experimental findings to clinical trials. Circ 59. Teraa M, Sprengers RW, Schutgens RE, Slaper‑Cortenbach IC,
Res 112: 1288‑1302, 2013. van der Graaf Y, Algra A, van der Tweel I, Doevendans PA,
39. Egan CG, Lavery R, Caporali F, Fondelli C, Laghi‑Pasini F, Mali WP, Moll FL and Verhaar MC: Effect of repetitive intra‑arte-
Dotta F and Sorrentino V: Generalised reduction of putative rial infusion of bone marrow mononuclear cells in patients
endothelial progenitors and CXCR4‑positive peripheral blood with no‑option limb ischemia: The randomized, double‑blind,
cells in type 2 diabetes. Diabetologia 51: 1296‑1305, 2008. placebo‑controlled rejuvenating endothelial progenitor cells via
40. Lois N, McCarter RV, O'Neill C, Medina RJ and Stitt AW: transcutaneous intra‑arterial supplementation (JUVENTAS)
Endothelial progenitor cells in diabetic retinopathy. Front trial. Circulation 131: 851‑860, 2015.
Endocrinol (Lausanne) 5: 44, 2014.
41. Ma C, Wang J, Liu H, Chen Y, Ma X, Chen S, Chen Y, Bihl JI
and Yang YI: Moderate exercise enhances endothelial progenitor This work is licensed under a Creative Commons
cell exosomes release and function. Med Sci Sports Exerc 50: Attribution-NonCommercial-NoDerivatives 4.0
2024‑2032, 2018. International (CC BY-NC-ND 4.0) License.You can also read