Excitation of medium spiny neurons by 'inhibitory' ultrapotent chemogenetics via shifts in chloride reversal potential - eLife
←
→
Page content transcription
If your browser does not render page correctly, please read the page content below
RESEARCH ARTICLE

                                     Excitation of medium spiny neurons by
                                     ‘inhibitory’ ultrapotent chemogenetics via
                                     shifts in chloride reversal potential
                                     Stephanie C Gantz1*, Maria M Ortiz2, Andrew J Belilos3, Khaled Moussawi3,4*
                                     1
                                      Department of Molecular Physiology and Biophysics, University of Iowa, Iowa City,
                                     United States; 2Biological and Biomedical Neuroscience Program, University of
                                     North Carolina, Chapel Hill, United States; 3National Institute on Drug Abuse,
                                     Baltimore, United States; 4Department of Psychiatry, School of Medicine, University
                                     of Pittsburgh, Pittsburgh, United States

                                     Abstract Ultrapotent chemogenetics, including the chloride-permeable inhibitory PSAM4-GlyR
                                     receptor, were recently proposed as a powerful strategy to selectively control neuronal activity in
                                     awake, behaving animals. We aimed to validate the inhibitory function of PSAM4-GlyR in dopamine
                                     D1 receptor-expressing medium spiny neurons (D1-MSNs) in the ventral striatum. Activation of
                                     PSAM4-GlyR with the uPSEM792 ligand enhanced rather than suppressed the activity of D1-MSNs in
                                     vivo as indicated by increased c-fos expression in D1-MSNs and in vitro as indicated by cell-
                                     attached recordings from D1-MSNs in mouse brain slices. Whole-cell recordings showed that
                                     activation of PSAM4-GlyR depolarized D1-MSNs, attenuated GABAergic inhibition, and shifted the
                                     reversal potential of PSAM4-GlyR current to more depolarized potentials, perpetuating the
                                     depolarizing effect of receptor activation. These data show that ‘inhibitory’ PSAM4-GlyR
                                     chemogenetics may activate certain cell types and highlight the pitfalls of utilizing chloride
                                     conductances to inhibit neurons.
*For correspondence:
stephanie-gantz@uiowa.edu
(SCG);
moussawi.khaled@gmail.com (KM)
                                     Introduction
Competing interests: The             Novel research tools like opto- and chemogenetics have been instrumental in dissecting brain cir-
authors declare that no
                                     cuits and understanding their relevance to normal and maladaptive behaviors. However, like any
competing interests exist.
                                     new technology, these tools have inherent limitations that could confound data interpretation.
Funding: See page 14                    The leading chemogenetic approach, Designer Receptors Exclusively Activated by Designer
Received: 22 October 2020            Drugs (DREADDs), acts through engineered G protein-coupled receptors, which are selectively acti-
Accepted: 28 March 2021              vated by clozapine N-oxide (CNO) (Roth, 2016). However, DREADDs may disrupt signaling from
Published: 06 April 2021             endogenous G protein-coupled receptors when expressed at high levels (Saloman et al., 2016), and
                                     CNO has been found to be metabolized peripherally to clozapine, which binds to many receptors in
Reviewing editor: Joseph V
                                     the brain, potentially resulting in off-target effects (Gomez et al., 2017; Manvich et al., 2018). A
Raimondo, University of Cape
Town, South Africa
                                     more recent chemogenetic approach, Pharmacologically Selective Actuator/Effector Module (PSAM/
                                     PSEM), acts through engineered ligand-gated ion channels that are activated by PSEM agonists
   This is an open-access article,   (Magnus et al., 2011; Magnus et al., 2019). The inhibitory PSAM4-GlyR is a chimeric protein of a
free of all copyright, and may be
                                     modified a7 nicotinic acetylcholine receptor ligand binding domain fused to the chloride-permeable
freely reproduced, distributed,
                                     glycine receptor ion pore domain (GlyR). After intracranial injection and expression of a virus encod-
transmitted, modified, built
upon, or otherwise used by           ing PSAM4-GlyR, application of ultrapotent agonist (e.g., uPSEM792) activates PSAM4-GlyR, which in
anyone for any lawful purpose.       principle selectively inhibits PSAM4-GlyR-expressing neurons (Magnus et al., 2019).
The work is made available under        In this study, we aimed to validate the inhibitory function of PSAM4-GlyR in dopamine D1 recep-
the Creative Commons CC0             tor-expressing medium spiny neurons (D1-MSNs) in the ventral striatum. Intraperitoneal (i.p.) injec-
public domain dedication.            tion of uPSEM792 enhanced the expression of the immediate early gene c-fos in PSAM4-GlyR-

Gantz et al. eLife 2021;10:e64241. DOI: https://doi.org/10.7554/eLife.64241                                                         1 of 16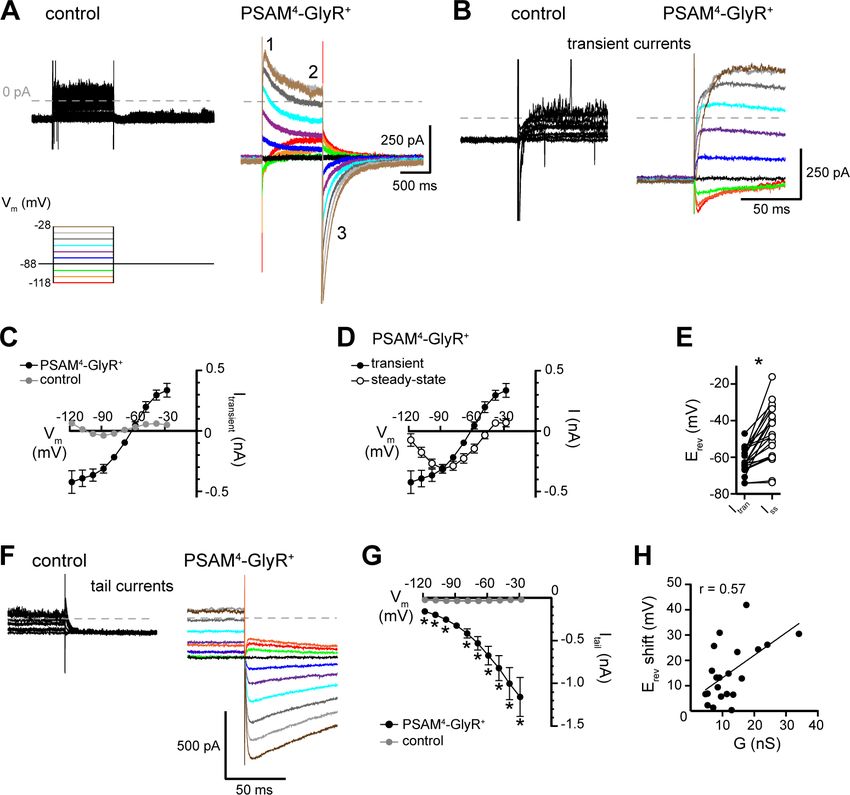
Research article                                                                                                  Neuroscience

                                   expressing D1-MSNs, indicative of in vivo activation rather than inhibition of these neurons. Using
                                   whole-cell recordings in acute brain slices, we found that activation of PSAM4-GlyR with uPSEM792
                                   decreased membrane resistance, induced an inward current in voltage-clamp, and depolarized the
                                   membrane potential in current-clamp, sometimes resulting in depolarization block. The majority of
                                   neurons maintained action potential firing to somatic current injection. Cell-attached recordings at
                                   subthreshold depolarized potentials also showed that activation of PSAM4-GlyR induced firing of
                                   action potentials in D1-MSNs. Further, we found that chloride influx via PSAM4-GlyR activation
                                   shifted its reversal potential to more positive values further exacerbating the depolarizing effect and
                                   attenuated GABAergic inhibition of D1-MSNs.

                                   Results
                                   Selective expression of PSAM4-GlyR in D1-MSNs
                                   To first validate the selective expression of PSAM4-GlyR in ventral striatum D1-MSNs, prodynorphin-
                                   Cre mice were crossed with a Cre-reporter (Ai9) mouse line, resulting in labeling of neurons contain-
                                   ing Cre-recombinase (i.e., D1-MSNs) with the fluorescent reporter tdTomato (Al-Hasani et al., 2015;
                                   Gerfen et al., 1990; Krashes et al., 2014). These mice received bilateral stereotaxic microinjections
                                   of AAV-syn-flex-PSAM4-GlyR-IRES-eGFP. PSAM4-GlyR expression was restricted to tdTomato+ neu-
                                   rons which confirmed selective Cre-dependent expression of PSAM4-GlyR in D1-MSNs (Figure 1A).

                                   PSAM4-GlyR enhances rather than suppresses c-fos expression in D1-
                                   MSNs in vivo
                                   The immediate early gene c-fos is commonly used as a surrogate marker for neuronal activation
                                   (Chung, 2015; Cruz et al., 2015; Sheng and Greenberg, 1990; Hunt et al., 1987). Given the pro-
                                   posed role of PSAM4-GlyR activation in silencing neurons (Magnus et al., 2011; Magnus et al.,
                                   2019), we initially hypothesized that activating PSAM4-GlyR in vivo will suppress D1-MSNs activity
                                   and reduce c-fos expression. To avoid a potential floor effect, we treated mice with fentanyl since
                                   opioid exposure has been shown to increase the expression of c-fos and other immediate early
                                   genes in striatal neurons including D1-MSNs (Enoksson et al., 2012; Lobo et al., 2013;
                                   Chang et al., 1988; Liu et al., 1994). Prodynorphin-Cre mice received bilateral injections of either
                                   AAV-syn-flex-PSAM4-GlyR-IRES-eGFP (PSAM4-GlyR) or AAV-EF1a-DIO-eYFP. Then, after 4–6 weeks,
                                   mice were injected with uPSEM792 (i.p., 3 mg/kg) or saline, followed 30 min later by fentanyl (i.p.,
                                   0.2 mg/kg) or saline (Figure 1B). Mice were perfused and their brains collected for c-fos immunos-
                                   taining 90 min later (120 min after the first i.p. injection). Transduced neurons were identified by
                                   expression of the fluorescent reporter (eGFP or eYFP, green, Figure 1C). Contrary to expectation,
                                   activation of PSAM4-GlyR with i.p. uPSEM792 increased c-fos expression in D1-MSNs expressing
                                   PSAM4-GlyR (Figure 1D). Two-way ANOVA showed a significant effect of PSAM4-GlyR activation on
                                   c-fos expression (F1, 34 = 30.55, p
Research article Neuroscience
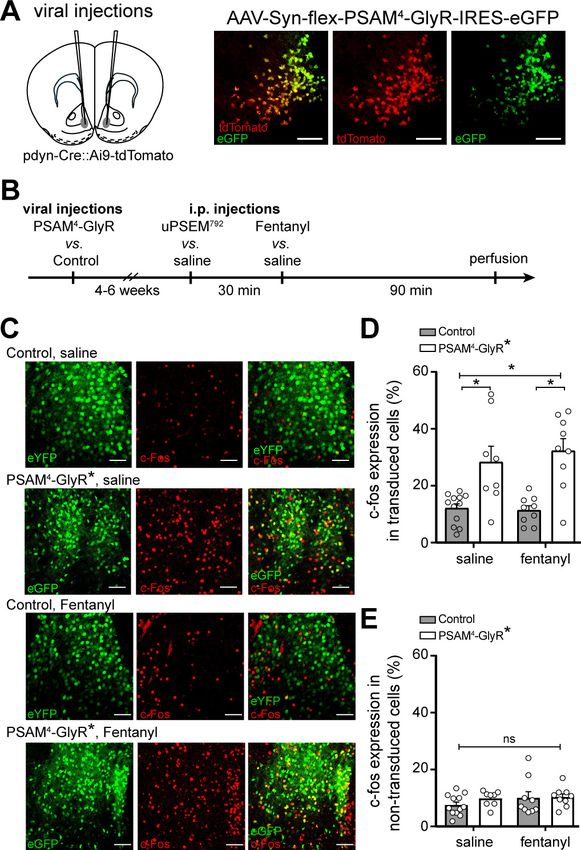
Figure 1. In vivo activation of PSAM4-GlyR enhances c-fos expression in D1-MSNs. (A) Left, cartoon of viral
injection site in the ventral striatum. Right, representative confocal images of Cre-dependent PSAM4-GlyR
expression (eGFP) in Cre-expressing D1-MSNs (tdTomato). (B) Experimental design for measuring c-fos expression
after activation of PSAM4-GlyR. (C) Representative maximum intensity Z-stack confocal images of c-fos
immunostaining (red) in D1-MSNs with or without activation of PSAM4-GlyR, after saline vs. fentanyl injection (0.2
mg/kg, i.p.). PSAM4-GlyR* refers to PSAM4-GlyR activated with uPSEM792 (3 mg/kg, i.p.). The ‘Control’ group
includes pooled data from mice with (control virus + uPSEM792 1st i.p. injection) and (PSAM4-GlyR virus + saline 1st
i.p. injection). Scale bars: 50 mm. (D) Activation of PSAM4-GlyR with uPSEM792 increased c-fos expression in
PSAM4-GlyR expressing D1-MSNs compared to control (two-way ANOVA with Sidak’s multiple comparisons test).
Data are presented as % colocalization of c-fos and eGFP/eYFP+ in transduced D1-MSNs. (E) Activation of PSAM4-
GlyR did not increase c-fos expression in non-transduced cells (calculated as the number of c-fos expressing non-
transduced cells/total number of non-transduced cells). Data represent mean ± SEM. * indicates statistical
significance, ns denotes not significant.
The online version of this article includes the following source data for figure 1:
Source data 1. PSAM4-GlyR enhances c-fos expression in D1-MSNs in-vivo (source data).
no effect on basal whole-cell current (10 nM: 2.8 ± 7.7 pA, n = 6, p=0.73, paired t-test; 50 nM:
9.5 ± 9.4 pA, n = 14, p=0.24; Figure 2A). In PSAM4-GlyR+ neurons, 10 nM uPSEM792 produced an
inward current ( 43.0 ± 10.1 pA, n = 21, p=0.0004, paired t-test; Figure 2A and B), consistent with
the original report on PSAM4-GlyRs (Magnus et al., 2019). Higher concentrations of uPSEM792 pro-
duced substantially larger inward currents (50 nM: 275.5 ± 57.1 pA, n = 18, p=0.0002, paired t-
test; 100 nM: 410.1 ± 137.8 pA, n = 6, p=0.031; Figure 2A and B). To assay membrane resistance,
the instantaneous change in current in response to a 10 mV step (Vhold 88 to 78 mV) was
Gantz et al. eLife 2021;10:e64241. DOI: https://doi.org/10.7554/eLife.64241 3 of 16Research article Neuroscience
Figure 2. Activation of PSAM4-GlyR in D1-MSNs produces an inward current. (A) Representative traces of whole-
cell voltage-clamp recordings (Vhold 88 mV) demonstrate no effect of uPSEM792 (10 or 50 nM) in control neurons.
In PSAM4-GlyR+ neurons, 10 or 50 nM uPSEM792 produced an inward current. Dashed line is baseline whole-cell
current for ease of visualization. (B) Plot of the magnitude of the inward current produced by 10, 50, or 100 nM
uPSEM792 in PSAM4-GlyR+ neurons. Line and error bars represent means ± SEM. (C) To measure membrane
resistance (Rm), a 10 mV voltage step ( 88 to 78 mV) was made in aCSF and during the uPSEM792-induced
inward current, and the instantaneous change in current following the capacitive transient was measured (DI).
Representative traces are shown below the voltage step command. Dashed line is 0 pA. (D) In PSAM4-GlyR+
neurons, 50 nM uPSEM792 significantly decreased Rm (paired t-test, pResearch article Neuroscience
Figure 3. Activation of PSAM4-GlyR depolarizes D1-MSNs and does not inhibit firing. (A) In PSAM4-GlyR+ neurons,
activation of PSAM4-GlyR with uPSEM792 (10 and 50 nM) significantly depolarized the membrane potential (Vm)
compared to control (non-PSAM4-GlyR) neurons, measured in current-clamp (two-way ANOVA with Sidak’s
multiple comparisons test). (B) Representative traces of current-clamp recordings from a control (top) or PSAM4-
GlyR+ neuron (bottom). Action potential firing was evoked by somatic current injection (250 pA, 2 s) in aCSF (left)
and 50 nM uPSEM792 (right). Dashed line is 80 mV. (C) Distribution of firing response of PSAM4-GlyR+ neurons
after 10 or 50 nM uPSEM792 application. In 10 nM uPSEM792, 14/14 neurons continued to fire with current injection.
In 50 nM, 9/16 neurons fired with current injection (induced firing), 1/16 fired spontaneously without a current
injection (spont. firing), and 6/16 went into depolarization block (DP block). (D) Representative traces of current-
clamp recordings from a PSAM4-GlyR+ neuron that went into depolarization block with uPSEM792. Response to
somatic current injection (250 pA, 2 s) in aCSF (gray) and after uPSEM792 application (black). The membrane
potential in uPSEM792 was more depolarized than the potential where the neuron entered depolarization block in
aCSF. Dashed line is 80 mV. (E) Plot of change in the minimum current needed to induce firing (approximate
rheobase: ~rb) induced by uPSEM792 (10 and 50 nM) in control (gray) and PSAM4-GlyR+ (black) in cells that
continued to fire (10/16). No significant change of ~rb was observed. (F) Plot of number of action potentials (APs)
fired versus injected current in control neurons in aCSF (open) and in uPSEM792 (closed). No significant difference
was observed. (G) Plot of AP firing frequency versus injected current in control neurons in aCSF (open) and in
uPSEM792 (closed). No significant difference was observed. (H) Plot of number of APs fired versus injected current
in PSAM4-GlyR+ neurons in aCSF (open) and in uPSEM792 (closed). No significant difference was observed. (I) Plot
of AP firing frequency versus injected current in PSAM4-GlyR+ neurons in aCSF (open) and in uPSEM792 (closed).
No significant difference was observed. Line and error bars represent means ± SEM, * indicates statistical
significance, ns denotes not significant.
The online version of this article includes the following source data for figure 3:
Source data 1. PSAM4-GlyR does not inhibit firing of D1-MSNs (source data).
fire action potentials with current injection and 6 of 16 neurons were depolarized sufficiently to enter
into depolarization block upon uPSEM792 application (Figure 3C and D). The minimum positive cur-
rent needed to evoke firing (approximation of rheobase) could not be determined in neurons that
entered into depolarization block (6/16) upon activation of PSAM4-GlyR. When compared with neu-
rons that continued to fire, neurons that entered into depolarization block with uPSEM792 application
Gantz et al. eLife 2021;10:e64241. DOI: https://doi.org/10.7554/eLife.64241 5 of 16Research article Neuroscience
had similar resting membrane potential to other PSAM4-GlyR neurons ( 83.1 ± 1.1 mV vs.
83.6 ± 1.3 mV), but had higher membrane resistance (92.4 ± 5.2 mW vs. 65.8 ± 6.7 mW), indicating
that depolarization block was not due to a generally depolarized membrane potential prior to activa-
tion of PSAM4-GlyR. In neurons that continued to fire (10/16), there was no significant change in
approximation of rheobase despite membrane depolarization with PSAM4-GlyR activation, likely due
to shunting (two-way ANOVA; PSAM4-GlyR activation effect: F 1, 31 = 1.17, p=0.29; uPSEM792 con-
centration effect: F 1, 31 = 1.45, p=0.24; Figure 3E). Moreover, activation of PSAM4-GlyR with 50 nM
UPSEM792 did not change the number of action potentials (n = 5–10, ANOVA mixed-effects analysis;
no significant group effect: F1, 9 = 0.20, p=0.66, and no interaction: F9, 49 = 0.96, p=0.48;
Figure 3H) or firing frequency (no significant group effect: F1, 9 = 0.05, p=0.82, and no interaction:
F9, 48 = 0.66, p=0.48; Figure 3I).
PSAM4-GlyR induces action potential firing in D1-MSNs in cell-attached
recordings
Whole-cell recording conditions affect intracellular chloride levels, which could confound data inter-
pretation. Therefore, we sought to determine the effect of PSAM4-GlyR activation on D1-MSN firing
using loose cell-attached recording configuration, which does not perturb intracellular chloride con-
centrations. After obtaining a steady baseline, uPSEM792 (100 nM) was applied for 5 min, followed
by high potassium-containing CSF (~40 mM) to depolarize the neurons. High potassium results in
rapid depolarization and firing by shifting the reversal potential of potassium to more positive val-
ues. Activation of PSAM4-GlyR in D1-MSNs did not suppress high-potassium-induced firing of action
potentials (Figure 4A and B). In fact, in one of five neurons, activation of PSAM4-GlyR induced firing
prior to high potassium application (not shown). Further, the frequency of high-potassium-induced
firing was not different in uPSEM-treated control vs. PSAM4-GlyR+ neurons, suggesting the absence
of a silencing effect by PSAM4-GlyR activation.
The whole-cell recording data in Figure 3A suggest that PSAM4-GlyR activation results in ~20 mV
depolarization of D1-MSNs, which is not sufficient to reach firing threshold (~ 43 mV
[Gertler et al., 2008]) from the resting membrane potential (~ 83 mV). Therefore, to determine if
the membrane depolarization induced by PSAM4-GlyR activation is capable of triggering action
potential firing when the membrane potential is closer to firing threshold, the cell-attached experi-
ment was repeated after depolarizing the neurons to subthreshold potentials by increasing the
extracellular potassium concentration from 4.5 mM to ~11.5 mM (10–13 mM). Under these condi-
tions, cell-attached recordings show that activation of PSAM4-GlyR triggered firing of D1 MSNs
(Figure 4C and D). In control cells, uPSEM792 did not result in firing, unlike high potassium applica-
tion (Figure 4C and D). A mixed-effects two-way ANOVA showed a significant interaction effect
between PSAM4-GlyR expression (+ vs. ) and recording condition (aCSF vs. uPSEM vs. high potas-
sium) on the firing frequency (F2, 13 = 12.40, p=0.001). Post-hoc Sidak’s multiple comparisons tests
showed a significant increase in firing frequency with application of uPSEM792 (compared with aCSF)
in PSAM4-GlyR+ but not control neurons. In contrast, high potassium after uPSEM792 caused a signif-
icant increase in firing frequency in control neurons (compared to aCSF and uPSEM792), as opposed
to reduced firing frequency in PSAM4-GlyR+ neurons, likely because of depolarization block, as is
also suggested by the decrement in the amplitude of action currents with uPSEM792-induced firing
(Figure 4C).
Taken together, the whole-cell and cell-attached recording results demonstrate that (1) activation
of PSAM4-GlyR significantly depolarized the membrane potential, (2) the magnitude of the decrease
in membrane resistance produced by opening of PSAM4-GlyR channels was not sufficient to inhibit
neuronal firing via electrical shunting, and (3) PSAM4-GlyR activation could trigger action potential
firing when neurons are depolarized to subthreshold potentials.
Sustained activation of PSAM4-GlyR results in runaway depolarization
of D1-MSNs
Depolarization from the resting membrane potential ( 83 mV) by activation of PSAM4-GlyR was
expected given the calculated reversal potential of the channel ( 62 mV, see
Materials and methods). However, in most D1-MSNs (~57%), the depolarization overshot the
expected reversal potential to potentials more positive than 62 mV (Figure 3A). Therefore, we
Gantz et al. eLife 2021;10:e64241. DOI: https://doi.org/10.7554/eLife.64241 6 of 16Research article Neuroscience
Figure 4. In cell-attached configuration, activation of PSAM4-GlyR triggers firing of D1-MSNs when the membrane
is depolarized to subthreshold potentials. (A) Representative traces of cell-attached recordings from a control
(gray) or PSAM4-GlyR+ neuron in standard aCSF (4.5 mM [K+]). Action currents were evoked following uPSEM792 by
applying a high external concentration of potassium (high K+, ~40 mM). The insets below the high K+ traces
represent an expanded timescale at the beginning of firing; Inset scale bar = 200 ms. (B) In PSAM4-GlyR+ neurons,
activation of PSAM4-GlyR with uPSEM792 had no effect on the frequency of action currents in response to high K+.
(C) Representative traces of cell-attached recordings from a control (gray) or PSAM4-GlyR+ neuron in aCSF
containing 10–13 mM [K+]. In PSAM4-GlyR+ neurons, activation of PSAM4-GlyR with uPSEM792 produced firing.
There was no further firing with application of high K+. uPSEM792 had no effect on firing in control neurons. (D)
Plot of the frequency of action currents in control and PSAM4-GlyR+ neurons in aCSF, uPSEM792 and high K+
(mixed effect two-way ANOVA with Sidak’s multiple comparisons test). Line and error bars represent means ±
SEM. * indicates statistical significance, ns denotes not significant.
The online version of this article includes the following source data for figure 4:
Source data 1. PSAM4-GlyR induces D1-MSN firing in cell-attached recordings (source data).
examined the current–voltage relationship of PSAM4-GlyR. Voltage steps (from Vhold 88 mV, 1 s,
118 to 28 mV, 10 mV increments) were made in aCSF and uPSEM792, and PSAM4-GlyR current
was isolated by subtraction (Figure 5A). In control neurons, uPSEM792 did not produce substantial
current across the voltage range (Figure 5A and C). In PSAM4-GlyR+ neurons, uPSEM792 produced a
transient current with the onset of the voltage step (inset ‘1’, Figure 5A) that relaxed toward a
steady-state current during the voltage step (inset ‘2’, Figure 5A). The transient current reversed
polarity at 61.4 mV (n = 21, CI: 64.0 to 59.0 mV, linear regression, r2 = 0.58, F1, 103 = 142.5,
pResearch article Neuroscience
Figure 5. Current–voltage relationship of PSAM4-GlyR current shows rightward shift in reversal potential and
transient or small outward currents at depolarized potentials. (A) Current was recorded in response to voltage
steps (1 s, 118 to 28 mV, 10 mV) from Vhold 88 mV in aCSF and after application of uPSEM792 (50 or 100 nM).
uPSEM792-induced current was isolated by subtraction. Representative traces of uPSEM792-induced current during
voltage steps in a control (left) and a PSAM4-GlyR+ neuron (right). Inset numbers by trace indicate transient
(Roth, 2016), steady-state (Saloman et al., 2016), and tail (Gomez et al., 2017) currents. (B) Expanded timescale
of transient currents (inset ‘1’ in A) in a control and a PSAM4-GlyR+ neuron. (C) Plot of current–voltage relationship
of the transient current (Itransient) in control (n = 11) vs. PSAM4-GlyR+ neurons (n = 21). The reversal potential of
transient current in PSAM4-GlyR+ neurons was 61 mV. (D) Plot of current–voltage relationship of the transient
(inset ‘1’ in A, same as in C) vs. steady-state uPSEM792-induced (inset ‘2’ in A) currents in PSAM4-GlyR+ neurons. At
steady state, the reversal potential of uPSEM792-induced current shifted to 44 mV. (E) Plot of the pairwise shift of
reversal potential (Erev) between transient (Itran) and steady-state currents (Iss). (F) Expanded timescale of tail
currents (inset ‘3’ in A) in a control and a PSAM4-GlyR+ neuron. (G) Plot of the amplitude of tail currents measured
at Vhold 88 mV (Itail) versus holding potential of the preceding voltage step in control and PSAM4-GlyR+ neurons.
uPSEM792-induced tail current at 88 mV demonstrated robust augmentation with prior depolarization and
reduction with prior hyperpolarization. (H) The magnitude of the rightward shift in reversal potential between
transient and steady-state current was positively correlated with the PSAM4-GlyR conductance (G in nS). Line and
error bars represent means ± SEM, * indicates statistical significance.
The online version of this article includes the following source data for figure 5:
Source data 1. Current-voltage relationship of PSAM4-GlyR current (source data).
Gantz et al. eLife 2021;10:e64241. DOI: https://doi.org/10.7554/eLife.64241 8 of 16Research article Neuroscience
Instability of chloride equilibrium underlies PSAM4-GlyR-mediated
depolarization
In order to gain a mechanistic understanding of PSAM4-GlyR-mediated depolarization, we examined
tail currents generated by stepping back to a holding potential of 88 mV from preceding voltage
steps. In principle, relaxation of outward currents during voltage steps could reflect fewer available
channels (e.g., channel desensitization, inactivation, or voltage-dependent block), which would be
expected to result in smaller tail currents. Alternatively, the relaxation of outward currents could be
a manifestation of reduced driving force of chloride influx through PSAM4-GlyR channels due to the
accumulation of intracellular chloride over the course of the voltage steps, which would be expected
to result in larger tail currents. Indeed, many reports show that sustained activation of chloride con-
ductances including GABAA receptors (Huguenard and Alger, 1986; Staley et al., 1995;
Thompson and Gähwiler, 1989), glycine receptors (Karlsson et al., 2011), and Halorhodopsin
(Raimondo et al., 2012; Alfonsa et al., 2015) can lead to chloride influx that overwhelms homeo-
static mechanisms to pump chloride out, thereby elevating the intracellular chloride concentration.
An increase in intracellular chloride manifests as a rightward shift of the chloride reversal potential,
commensurate with our observation of a rightward shift of the PSAM4-GlyR reversal potential from
61 mV to 44 mV. Further, the magnitude of the tail current increased substantially with preceding
depolarizing steps (Figure 5F and G; RM two-way ANOVA, significant PSAM4-GlyR activation effect:
F1, 30 = 18.05, p=0.0002; significant PSAM4-GlyR activation voltage step interaction: F9, 270 =
9.55, p5 mV shift, n = 5, Erevshift = 17.3 ± 6.3 mV), the amplitude
of the GABAA receptor-mediated synaptic currents significantly decreased upon activation of
PSAM4-GlyR compared with aCSF ( 33.4 ± 6.0 pA vs. 7.8 ± 1.3 pA at Vhold 88 mV, paired t-test:
p=0.01; Figure 6C). Further, the reversal potential of GABAA receptor-mediated synaptic currents
showed a significant rightward shift from 60.9 mV in aCSF to 51.6 mV upon activation of PSAM4-
GlyR (aCSF: CI: 64.2 to 58.1 mV, linear regression, r2 = 0.78, F1, 13 = 43.7, pResearch article Neuroscience
Figure 6. PSAM4-GlyR activation in D1-MSNs reduces GABAergic synaptic inhibition. (A) Representative traces of
GABA-A receptor-mediated synaptic currents in a PSAM4-GlyR+ neuron in aCSF, evoked during voltage steps
from Vhold 88 mV (voltage steps: 1 s, 118 to 28 mV, 10 mV; electrical stimulation at 850 ms into voltage steps).
Panel on the right shows the traces in expanded timescale corresponding to the gray rectangle on the left. (B)
Representative traces of GABA-A receptor-mediated currents evoked in the same neuron from Vhold 28 mV
(outward) and 118 mV (inward) in aCSF (gray) and uPSEM792 (black). (C) Plot of the current–voltage relationship of
the GABA-A receptor synaptic currents in aCSF and uPSEM792 in neurons where the reversal potential of PSAM4-
GlyR current shifted by >5 mV (n = 5, average shift of 17.0 mV). The reversal potential of GABA-A receptor-
mediated current was 60.9 mV in aCSF and 51.6 mV in uPSEM792. Inset (top left) shows values of GABA-A
receptor synaptic currents in uPSEM792 near the reversal potential in an expanded scale. (D) Plot of the current–
voltage relationship of the GABA-A receptor-mediated synaptic current in aCSF and uPSEM792 in neurons where
the reversal potential of PSAM4-GlyR current did not shift (n = 3, average shift of 2.1 mV). The reversal potential of
GABA-A receptor-mediated synaptic currents was similar in aCSF ( 64.7 mV) and uPSEM792 ( 64.9 mV). Line and
error bars represent means ± SEM, * indicates statistical significance.
The online version of this article includes the following source data for figure 6:
Source data 1. Reduced GABAergic synaptic inhibition (source data).
(n = 3, Erevshift = 2.1 ± 1.0 mV), there was no change in the reversal potential or amplitude of
GABAA receptor-mediated synaptic currents (aCSF: GABAAErev = 64.7 mV, CI: 68.5 to 62.1 mV,
linear regression, r2 = 0.91, F1, 7 = 68.8, pResearch article Neuroscience
The present study shows that PSAM4-GlyR in D1-MSNs is predominantly depolarizing, fails to
inhibit neuronal firing, triggers action potential firing when neurons are depolarized to subthreshold
potentials, and has a limited capacity to hyperpolarize these neurons even at more depolarized
potentials. When activated near the resting membrane potential ( 83 mV), PSAM4-GlyR passes
inward current and depolarizes D1-MSNs. When activated at potentials more depolarized than the
chloride reversal potential, PSAM4-GlyR passes transient or small outward currents, likely due to
influx and accumulation of intracellular chloride that overwhelms endogenous mechanisms to restore
the chloride gradient (Huguenard and Alger, 1986; Staley et al., 1995; Thompson and Gähwiler,
1989; Karlsson et al., 2011; Raimondo et al., 2012; Alfonsa et al., 2015). Bath application or sys-
temic injection of high potency exogenous agonists of chloride conductances (e.g., uPSEM792) is a
very different phenomenon than physiological activation of native chloride conductances (e.g.,
GABAA and glycine receptors) by endogenous agonists. The release and clearance of endogenous
neurotransmitters are usually tightly controlled and occur over the scale of milliseconds, allowing the
neurons to better maintain a stable intra- and extracellular chloride gradient. This is unlike exoge-
nous agonists that result in sustained activation over seconds or minutes and cause massive chloride
influx and a shift in chloride reversal potential. In addition, the expression of endogenous chloride
conductances is also regulated, unlike viral overexpression of exogenous conductances (e.g.,
PSAM4-GlyR) which only augments the magnitude of chloride influx, hence the unpredictable nature
of neuronal responses to the activation of exogenous chloride conductances with exogenous
agonists.
More commonly, chloride conductances inhibit action potential firing through electrical shunting.
Opening channels decrease membrane resistance which reduces (shunts) depolarization in response
to inward current. While there was a significant decrease in membrane resistance associated with
opening PSAM4-GlyR in D1-MSNs (~30% reduction), it was not sufficient to prevent suprathreshold
depolarization by current injection. The majority of neurons were equally capable of firing action
potentials to current injection. Despite using high viral titer in our experiments, the decrease in
membrane resistance we observed was lower than previously reported in cortical layer 2/3 neurons
where PSAM4-GlyR activation suppressed firing (Magnus et al., 2019). While increasing PSAM4-
GlyR conductance by further increasing expression levels could theoretically improve shunting effi-
cacy, the data in this study show a strong correlation between PSAM4-GlyR conductance and the
rightward shift in PSAM4-GlyR reversal potential, suggesting that increasing expression levels will
only promote further depolarization with PSAM4-GlyR activation. The lack of shunting efficacy in D1-
MSNs is likely due to their low membrane resistance (~78 MW in brain slices as measured above) rel-
ative to other neurons in the brain (e.g., pyramidal neurons in cortex and hippocampus). It is impor-
tant to note that membrane resistance is inversely proportional to temperature, age, and number/
activity of synaptic inputs (Kroon et al., 2019; Waters and Helmchen, 2006; Fernandez et al.,
2018), and therefore, the shunting efficacy of PSAM4-GlyRs during behavioral experiments in vivo is
likely to be lower than in brain slices.
In the awake behaving state in vivo, MSNs show brief and irregular spontaneous membrane
potential fluctuations between depolarizations ( 50 to 60 mV) that facilitate action potential firing
and hyperpolarizations ( 80 to 90 mV), with the overall membrane potential following a Gaussian
distribution (mean ~ 69 mV) (Mahon et al., 2006). The cell-attached data show that activation of
PSAM4-GlyR triggers action potential firing when the neurons are depolarized to subthreshold
potentials by increasing extracellular potassium. A caveat of these data is that increasing extracellu-
lar potassium may indirectly impair chloride extrusion via the potassium-chloride cotransporter,
KCC2, which may exacerbate instability of the chloride gradient and make the cells more excitable.
Such KCC2 perturbance is expected to affect both control and PSAM4-GlyR cells. However, the
increased excitability observed in our experiments was limited to the PSAM4-GlyR cells supporting
the conclusion of PSAM4-GlyR driven increase in excitability. The current-clamp data showed that
activation of PSAM4-GlyR depolarized D1-MSNs by ~20 mV and was sufficient to produce depolari-
zation block in a proportion of neurons. This implies that in vivo, PSAM4-GlyR activation will effec-
tively increase the probability and duration of spontaneous depolarizations, and increase the
probability of D1-MSN firing especially during these depolarizations. The results also show that
PSAM4-GlyR activation results in ‘apparent cross-desensitization’ of GABAA synaptic currents, pro-
ducing a rightward shift in the GABAA reversal potential and a profound reduction of inhibitory
GABAA synaptic currents onto D1-MSNs, likely attributed to electrical shunting since the reduction
Gantz et al. eLife 2021;10:e64241. DOI: https://doi.org/10.7554/eLife.64241 11 of 16Research article Neuroscience
was observed at all potentials. Given the critical role of local GABAergic inhibition in the striatum in
regulating neuronal activity (Burke et al., 2017; Koós and Tepper, 1999), PSAM4-GlyR triggered
reduction of GABAergic inhibition will further increase the likelihood of D1-MSNs activation rather
than inhibition. Thus, increased c-fos expression in D1-MSNs following in vivo activation of PSAM4-
GlyR is likely caused by PSAM4-GlyR-induced depolarization and firing in addition to loss of GABAer-
gic inhibition, and reflects increased neuronal activity of D1-MSNs in vivo.
Finally, PSAM4-GlyR-induced depolarization may allow robust calcium influx via voltage-gated cal-
cium channels and NMDA receptors relieved from voltage-dependent magnesium pore-block
(Mayer and Westbrook, 1987; Mayer et al., 1984). Calcium influx activates calcium/calmodulin-
dependent protein kinases (CaMKs), calcium response elements in genes, and various other signal-
ing cascades (Pasek et al., 2015; Clapham, 2007), which are known to influence synaptic plasticity
and behavior (Lisman et al., 2002; Wayman et al., 2008). Therefore, it is possible that when used
to silence neurons, PSAM4-GlyR activation could confound the interpretation of experimental results
due to depolarization-induced calcium influx, independent of PSAM4-GlyR’s effect on action poten-
tial firing like in the case of depolarization-block.
In summary, activation of PSAM4-GlyR expressed in D1-MSNs in the ventral striatum enhanced
neuronal activity through direct depolarization and did not suppress action potential firing via mem-
brane shunting. The results of our study show that the PSAM4-GlyR approach to silence neurons
may not be suitable for all cell types and highlight the need to validate the inhibition of neuronal fir-
ing by PSAM4-GlyR in the cell type of interest prior to behavioral studies. More broadly, these data
demonstrate that achieving neuronal silencing with chloride conductances continues to be challeng-
ing and may result in unexpected neuronal activation.
Materials and methods
Subjects
All experimental procedures were conducted in accordance with the guidelines of the National Insti-
tutes of Health Guide for the Care and use of Laboratory Animals, and approved by the Animal Care
and Use Committee of the National Institute on Drug Abuse. We used adult female and male prody-
norphin-Cre mice (pdyn-Cre; 8–12 weeks old, breeding facility at the Intramural Research Program,
National Institute on Drug Abuse) for electrophysiology and c-fos experiments. We crossed pdyn-
Cre and Ai9 Rosa-tdTomato mice to validate selectivity of viral transduction (Figure 1A). Mice were
group housed four per cage and maintained under a 12 hr light cycle at 21 ± 2˚C. Food and water
were freely available.
Stereotaxic virus injection
AAV-SYN-flex-PSAM4-GlyR-IRES-EGFP was a gift from Scott Sternson (Addgene viral prep #
119741-AAV5; http://n2t.net/addgene:119741; RRID:Addgene_119741; >1 1013 vg/ml). Control
virus was AAV1-EF1a-DIO-eYFP (>1 1013 vg/ml, University of North Carolina Viral Core, NC). Mice
were anesthetized with an i.p. injection of a cocktail of ketamine (100 mg/kg) and xylazine (10 mg/
kg) and secured in a stereotaxic frame (David Kopf Instruments, CA). PSAM4-GlyR and control
viruses were injected (0.2–0.5 ml, 0.05 ml/min) into the medial ventral striatum (targeted coordinates
relative to bregma: 1.4 mm AP, 0.5 mm ML (10˚), and 4.5 mm DV) using a 29 G stainless steel can-
nula connected to a 2 ml Hamilton syringe or a Nanoject system (Drummond Scientific, PA). The
injectors were retracted slowly after 5 min. Mice were given carprofen (5 mg/kg) post-surgery for
pain relief.
Brain slice preparation and electrophysiological recordings
After >4 weeks of viral incubation, mice were anesthetized with Euthasol (i.p., Virbac AH, Inc, TX)
and then decapitated. Brains were rapidly removed and placed in room temperature (25˚C) modified
Krebs’ buffer containing (in mM): 125 NaCl, 4.5 KCl, 1.0 MgCl2, 1.2 CaCl2, 1.25 NaH2PO4, 11 D-glu-
cose, and 23.8 NaHCO3, bubbled with 95/5% O2/CO2 with 5 mM MK-801 to increase slice viability.
Using a vibrating microtome (Leica Biosystems, IL). Coronal brain slices (220 mm) containing the ven-
tral striatum were collected and incubated at 32˚C for 4 min, then transferred to room temperature
until use. All recordings were from neurons in the ventro-medial shell of the nucleus accumbens.
Gantz et al. eLife 2021;10:e64241. DOI: https://doi.org/10.7554/eLife.64241 12 of 16Research article Neuroscience
Cells were visualized using IR-DIC and fluorescence on an upright Olympus BX51WI microscope
(Olympus, MA). Transduced D1-MSNs were identified by visualization of eGFP or eYFP. Whole-cell
patch-clamp recordings were made at 35 ± 1˚C with a Multiclamp 700B amplifier and Digidata
1440a digitizer with Clampex and Axoscope software (Molecular Devices, CA). Data were digitized
at 20 kHz. For voltage-clamp experiments, data were filtered at 2 kHz. Recordings were performed
in modified Krebs’ buffer. In the majority of experiments, receptor antagonists were used to elimi-
nate fast synaptic transmission (3 mM NBQX or DNQX and 100 mM picrotoxin). For whole-cell config-
uration recordings, pipette resistance was 1.5–2.5 MW when filled with internal solution containing
(in mM) K-methylsulfate (122), HEPES (Chung, 2015), EGTA (0.45), NaCl (Krashes et al., 2014),
MgCl2 (1.8), CaCl2 (0.1), Mg-ATP (Manvich et al., 2018), Na-GTP (0.3), creatine phosphate disodium
(Enoksson et al., 2012), pH 7.35 and 284 mOsm. For cell-attached configuration recordings, pipette
resistance was 2–4 MW when filled with Krebs’ buffer. Cell-attached recordings in which the neuron
did not fire under uPSEM792 or high [K+] were excluded from analysis.
Assuming permeability to Cl only, the calculated reversal potential of PSAM4-GlyR was 62.3
mV. Assuming that PSAM4-GlyR has similar Cl /HCO3 permeability to GlyR (PHCO3 :PCl =0.14)
(Jun et al., 2016), the calculated reversal potential of PSAM4-GlyR in our recording conditions was
60.7 mV ([Cl ]out133.9 mM, [Cl ]in12.8 mM, [HCO3 ]out23.8 mM, and assuming [HCO3 ]in8 mM).
Series resistance was monitored throughout the recordings and not compensated. Reported vol-
tages were corrected for a liquid junction potential of 8 mV between the internal and external solu-
tions. To measure neuronal excitability, current was injected in 50 pA increments (2 s). In
determining the current–voltage (I-V) relationship using voltage steps, the external solution of some
recordings included 1 mM tetrodotoxin (TTX) to eliminate sodium channel-dependent spiking. There
were no differences in the shape of the I-V with or without TTX, so data were combined. Reversal
potentials were determined by linear regression considering each replicate an individual point.
Recordings in which current did not cross 0 pA were omitted from analysis (n = 2). GABAA receptor-
mediated synaptic currents were evoked with electrical stimulation delivered by a bipolar stimulating
electrode placed in the brain slice, in the presence of ionotropic glutamate receptor antagonists
(NBQX/DNQX) to isolate fast GABAergic synaptic transmission. Peak amplitude of GABAA receptor-
mediated synaptic currents was measured 3–4 ms from the apparent peak to remove any potential
contribution from a stimulation-induced ‘escaped’ action potential.
Immunohistochemistry and confocal microscopy
For immunohistochemistry, confocal microscopy, and image analysis, the experimenter was blinded
to the animal treatment group. Mice microinjected with PSAM4-GlyR vs. control AAV into the medial
ventral striatum received an i.p. injection of uPSEM792 (3 mg/kg) or saline followed 30 min later by
an i.p. injection of fentanyl (0.2 mg/kg) or saline (Figure 1B). After 90 min, at the expected peak of
c-fos protein expression (Barros et al., 2015), mice were euthanized with Euthasol (i.p.) and trans-
cardially perfused with 1 PBS followed by ice-cold 4% paraformaldehyde (pH 7.4, Sigma Aldrich,
MO). The brains were collected and fixed overnight in 4% paraformaldehyde at 4˚C, and then moved
to PBS. Coronal brains slices (50 mm) containing the viral injection sites were collected using a vibra-
tome (Leica Biosystems, IL). Free-floating brain slices were washed in PBS (3), permeabilized and
blocked in a solution containing PBS, 0.3% Triton-X, and 5% normal donkey serum for 2 hr. Slices
were then incubated at 4˚ overnight in a solution containing PBS, 0.03% Triton-X, 5% normal donkey
serum, and 1:4000 rabbit anti-c-fos primary antibody (Cell Signaling, MA). This was followed by a
wash in PBS (3) and incubation in 1:500 donkey anti-rabbit secondary antibody, conjugated to
Alexa-Fluor-647 (Jackson ImmunoResearch, PA) for 1 hr and 45 min. Slices were then washed in PBS
(3) and mounted with DAPI Fluoromount mounting medium (Thermo Fisher Scientific, MA). Confo-
cal images were collected using an Olympus Fluoview FV1000 confocal microscope with 20 (0.75
NA) or 40 (0.95 NA) objective lens and processed using ImageJ. Z-stack images of the viral injec-
tion site in the right hemisphere (two to three brain sections) were collected. Expression of c-fos and
eGFP/eYFP was manually quantified by counting fluorescent cells within the image frame. The num-
ber of non-transduced cells was obtained by subtracting the number of transduced cells from the
number of cells stained with DAPI. Results from all brain sections were averaged for each mouse.
Drugs uPSEM792, MK-801, picrotoxin, and NBQX were purchased from Tocris (MN). All other
electrophysiological reagents were obtained from Sigma-Aldrich (MO).
Gantz et al. eLife 2021;10:e64241. DOI: https://doi.org/10.7554/eLife.64241 13 of 16Research article Neuroscience
Data analysis
Data were analyzed using Clampfit 10.7. Data are presented as representative traces, or in bar
graphs with means ± SEM, and in scatter plots where each point is an individual mouse (Figure 1) or
cell (Figures 2–6). In Figure 1, n = number of mice (8–12/group). In Figures 2–6, n = number of
cells. The number of mice used is as follows: Figure 2 (5–8/group), Figure 3 (3–7/group), Figure 4
(2–4/group), Figure 5 (4–7/group), and Figure 6 (Manvich et al., 2018). No sample was tested in
the same experiment more than once (technical replication). Image analysis for Figure 1 was done
blindly. Data were analyzed using GraphPad Prism (v 8.1.1; GraphPad software, CA). The statistical
tests we used included t-tests (paired or unpaired), ANOVAs (with or without repeated measures)
with Sidak’s or Dunnett’s multiple comparison test (as recommended by Prism), ANOVA mixed-
effects analysis (when missing values prohibited repeated-measures analysis with ANOVAs), Pear-
son’s correlation, and linear regression (we ensured there were no departures from linearity with rep-
licates test). Significance level was set at pResearch article Neuroscience
Additional files
Supplementary files
. Transparent reporting form
Data availability
All data generated or analyzed during this study are included in the manuscript and supporting files.
References
Al-Hasani R, McCall JG, Shin G, Gomez AM, Schmitz GP, Bernardi JM, Pyo CO, Park SI, Marcinkiewcz CM,
Crowley NA, Krashes MJ, Lowell BB, Kash TL, Rogers JA, Bruchas MR. 2015. Distinct subpopulations of nucleus
accumbens dynorphin neurons drive aversion and reward. Neuron 87:1063–1077. DOI: https://doi.org/10.
1016/j.neuron.2015.08.019, PMID: 26335648
Alfonsa H, Merricks EM, Codadu NK, Cunningham MO, Deisseroth K, Racca C, Trevelyan AJ. 2015. The
contribution of raised intraneuronal chloride to epileptic network activity. Journal of Neuroscience 35:7715–
7726. DOI: https://doi.org/10.1523/JNEUROSCI.4105-14.2015, PMID: 25995461
Barros VN, Mundim M, Galindo LT, Bittencourt S, Porcionatto M, Mello LE. 2015. The pattern of c-Fos
expression and its refractory period in the brain of rats and monkeys. Frontiers in Cellular Neuroscience 9:72.
DOI: https://doi.org/10.3389/fncel.2015.00072, PMID: 25814929
Bracci E, Panzeri S. 2006. Excitatory GABAergic effects in striatal projection neurons. Journal of Neurophysiology
95:1285–1290. DOI: https://doi.org/10.1152/jn.00598.2005, PMID: 16251264
Burke DA, Rotstein HG, Alvarez VA. 2017. Striatal local circuitry: a new framework for lateral inhibition. Neuron
96:267–284. DOI: https://doi.org/10.1016/j.neuron.2017.09.019, PMID: 29024654
Chang SL, Squinto SP, Harlan RE. 1988. Morphine activation of c-fos expression in rat brain. Biochemical and
Biophysical Research Communications 157:698–704. DOI: https://doi.org/10.1016/S0006-291X(88)80306-1,
PMID: 3144275
Chung L. 2015. A brief introduction to the transduction of neural activity into fos signal. Development &
Reproduction 19:61–67. DOI: https://doi.org/10.12717/DR.2015.19.2.061, PMID: 27004262
Clapham DE. 2007. Calcium signaling. Cell 131:1047–1058. DOI: https://doi.org/10.1016/j.cell.2007.11.028,
PMID: 18083096
Cruz FC, Javier Rubio F, Hope BT. 2015. Using c-fos to study neuronal ensembles in corticostriatal circuitry of
addiction. Brain Research 1628:157–173. DOI: https://doi.org/10.1016/j.brainres.2014.11.005, PMID: 25446457
Doyon N, Vinay L, Prescott SA, De Koninck Y. 2016. Chloride regulation: a dynamic equilibrium crucial for
synaptic inhibition. Neuron 89:1157–1172. DOI: https://doi.org/10.1016/j.neuron.2016.02.030, PMID: 26985723
Enoksson T, Bertran-Gonzalez J, Christie MJ. 2012. Nucleus accumbens D2- and D1-receptor expressing medium
spiny neurons are selectively activated by morphine withdrawal and acute morphine, respectively.
Neuropharmacology 62:2463–2471. DOI: https://doi.org/10.1016/j.neuropharm.2012.02.020, PMID: 22410393
Fernandez FR, Rahsepar B, White JA. 2018. Differences in the electrophysiological properties of mouse
somatosensory layer 2/3 neurons In Vivo and Slice Stem from Intrinsic Sources Rather than a Network-
Generated High Conductance State. Eneuro 5:ENEURO.0447-17.2018. DOI: https://doi.org/10.1523/ENEURO.
0447-17.2018, PMID: 29662946
Gerfen CR, Engber TM, Mahan LC, Susel Z, Chase TN, Monsma FJ, Sibley DR. 1990. D1 and D2 dopamine
receptor-regulated gene expression of striatonigral and striatopallidal neurons. Science 250:1429–1432.
DOI: https://doi.org/10.1126/science.2147780, PMID: 2147780
Gertler TS, Chan CS, Surmeier DJ. 2008. Dichotomous anatomical properties of adult striatal medium spiny
neurons. Journal of Neuroscience 28:10814–10824. DOI: https://doi.org/10.1523/JNEUROSCI.2660-08.2008,
PMID: 18945889
Gomez JL, Bonaventura J, Lesniak W, Mathews WB, Sysa-Shah P, Rodriguez LA, Ellis RJ, Richie CT, Harvey BK,
Dannals RF, Pomper MG, Bonci A, Michaelides M. 2017. Chemogenetics revealed: dreadd occupancy and
activation via converted clozapine. Science 357:503–507. DOI: https://doi.org/10.1126/science.aan2475,
PMID: 28774929
Huguenard JR, Alger BE. 1986. Whole-cell voltage-clamp study of the fading of GABA-activated currents in
acutely dissociated hippocampal neurons. Journal of Neurophysiology 56:1–18. DOI: https://doi.org/10.1152/
jn.1986.56.1.1, PMID: 3746390
Hunt SP, Pini A, Evan G. 1987. Induction of c-fos-like protein in spinal cord neurons following sensory
stimulation. Nature 328:632–634. DOI: https://doi.org/10.1038/328632a0, PMID: 3112583
Jun I, Cheng MH, Sim E, Jung J, Suh BL, Kim Y, Son H, Park K, Kim CH, Yoon JH, Whitcomb DC, Bahar I, Lee
MG. 2016. Pore dilatation increases the bicarbonate permeability of CFTR, ANO1 and glycine receptor anion
channels. The Journal of Physiology 594:2929–2955. DOI: https://doi.org/10.1113/JP271311, PMID: 26663196
Karlsson U, Druzin M, Johansson S. 2011. Cl concentration changes and desensitization of GABAA and glycine
receptors. Journal of General Physiology 138:609–626. DOI: https://doi.org/10.1085/jgp.201110674
Gantz et al. eLife 2021;10:e64241. DOI: https://doi.org/10.7554/eLife.64241 15 of 16Research article Neuroscience
Koós T, Tepper JM. 1999. Inhibitory control of neostriatal projection neurons by GABAergic interneurons. Nature
Neuroscience 2:467–472. DOI: https://doi.org/10.1038/8138, PMID: 10321252
Krashes MJ, Shah BP, Madara JC, Olson DP, Strochlic DE, Garfield AS, Vong L, Pei H, Watabe-Uchida M, Uchida
N, Liberles SD, Lowell BB. 2014. An excitatory paraventricular nucleus to AgRP neuron circuit that drives
hunger. Nature 507:238–242. DOI: https://doi.org/10.1038/nature12956, PMID: 24487620
Kroon T, van Hugte E, van Linge L, Mansvelder HD, Meredith RM. 2019. Early postnatal development of
pyramidal neurons across layers of the mouse medial prefrontal cortex. Scientific Reports 9:5037. DOI: https://
doi.org/10.1038/s41598-019-41661-9, PMID: 30911152
Lisman J, Schulman H, Cline H. 2002. The molecular basis of CaMKII function in synaptic and behavioural
memory. Nature Reviews Neuroscience 3:175–190. DOI: https://doi.org/10.1038/nrn753, PMID: 11994750
Liu J, Nickolenko J, Sharp FR. 1994. Morphine induces c-fos and junB in striatum and nucleus accumbens via D1
and N-methyl-D-aspartate receptors. PNAS 91:8537–8541. DOI: https://doi.org/10.1073/pnas.91.18.8537,
PMID: 8078918
Lobo MK, Zaman S, Damez-Werno DM, Koo JW, Bagot RC, DiNieri JA, Nugent A, Finkel E, Chaudhury D,
Chandra R, Riberio E, Rabkin J, Mouzon E, Cachope R, Cheer JF, Han MH, Dietz DM, Self DW, Hurd YL, Vialou
V, et al. 2013. ??fosb induction in striatal medium spiny neuron subtypes in response to chronic
pharmacological, emotional, and optogenetic stimuli. Journal of Neuroscience 33:18381–18395. DOI: https://
doi.org/10.1523/JNEUROSCI.1875-13.2013, PMID: 24259563
Magnus CJ, Lee PH, Atasoy D, Su HH, Looger LL, Sternson SM. 2011. Chemical and genetic engineering of
selective ion channel-ligand interactions. Science 333:1292–1296. DOI: https://doi.org/10.1126/science.
1206606, PMID: 21885782
Magnus CJ, Lee PH, Bonaventura J, Zemla R, Gomez JL, Ramirez MH, Hu X, Galvan A, Basu J, Michaelides M,
Sternson SM. 2019. Ultrapotent chemogenetics for research and potential clinical applications. Science 364:
aav5282. DOI: https://doi.org/10.1126/science.aav5282
Mahon S, Vautrelle N, Pezard L, Slaght SJ, Deniau JM, Chouvet G, Charpier S. 2006. Distinct patterns of striatal
medium spiny neuron activity during the natural sleep-wake cycle. Journal of Neuroscience 26:12587–12595.
DOI: https://doi.org/10.1523/JNEUROSCI.3987-06.2006, PMID: 17135420
Manvich DF, Webster KA, Foster SL, Farrell MS, Ritchie JC, Porter JH, Weinshenker D. 2018. The DREADD
agonist clozapine N-oxide (CNO) is reverse-metabolized to clozapine and produces clozapine-like interoceptive
stimulus effects in rats and mice. Scientific Reports 8:3840. DOI: https://doi.org/10.1038/s41598-018-22116-z,
PMID: 29497149
Mayer ML, Westbrook GL, Guthrie PB. 1984. Voltage-dependent block by Mg2+ of NMDA responses in spinal
cord neurones. Nature 309:261–263. DOI: https://doi.org/10.1038/309261a0, PMID: 6325946
Mayer ML, Westbrook GL. 1987. Permeation and block of N-methyl-D-aspartic acid receptor channels by
divalent cations in mouse cultured central neurones. The Journal of Physiology 394:501–527. DOI: https://doi.
org/10.1113/jphysiol.1987.sp016883, PMID: 2451020
Misgeld U, Wagner A, Ohno T. 1982. Depolarizing IPSPs and depolarization by GABA of rat neostriatum cells in
vitro. Experimental Brain Research 45-45:108–114. DOI: https://doi.org/10.1007/BF00235769
Pasek JG, Wang X, Colbran RJ. 2015. Differential CaMKII regulation by voltage-gated calcium channels in the
striatum. Molecular and Cellular Neuroscience 68:234–243. DOI: https://doi.org/10.1016/j.mcn.2015.08.003,
PMID: 26255006
Planert H, Berger TK, Silberberg G. 2013. Membrane properties of striatal direct and indirect pathway neurons
in mouse and rat slices and their modulation by dopamine. PLOS ONE 8:e57054. DOI: https://doi.org/10.1371/
journal.pone.0057054, PMID: 23469183
Raimondo JV, Kay L, Ellender TJ, Akerman CJ. 2012. Optogenetic silencing strategies differ in their effects on
inhibitory synaptic transmission. Nature Neuroscience 15:1102–1104. DOI: https://doi.org/10.1038/nn.3143
Roth BL. 2016. DREADDs for Neuroscientists. Neuron 89:683–694. DOI: https://doi.org/10.1016/j.neuron.2016.
01.040
Saloman JL, Scheff NN, Snyder LM, Ross SE, Davis BM, Gold MS. 2016. Gi-DREADD Expression in Peripheral
Nerves Produces Ligand-Dependent Analgesia, as well as Ligand-Independent Functional Changes in Sensory
Neurons. The Journal of Neuroscience 36:10769–10781. DOI: https://doi.org/10.1523/JNEUROSCI.3480-15.
2016
Sheng M, Greenberg ME. 1990. The regulation and function of c-fos and other immediate early genes in the
nervous system. Neuron 4:477–485. DOI: https://doi.org/10.1016/0896-6273(90)90106-P
Staley K, Soldo B, Proctor W. 1995. Ionic mechanisms of neuronal excitation by inhibitory GABAA receptors.
Science 269:977–981. DOI: https://doi.org/10.1126/science.7638623
Thompson SM, Gähwiler BH. 1989. Activity-dependent disinhibition. I. repetitive stimulation reduces IPSP driving
force and conductance in the Hippocampus in vitro. Journal of Neurophysiology 61:501–511. DOI: https://doi.
org/10.1152/jn.1989.61.3.501, PMID: 2709096
Waters J, Helmchen F. 2006. Background synaptic activity is sparse in neocortex. Journal of Neuroscience 26:
8267–8277. DOI: https://doi.org/10.1523/JNEUROSCI.2152-06.2006, PMID: 16899721
Wayman GA, Lee YS, Tokumitsu H, Silva AJ, Silva A, Soderling TR. 2008. Calmodulin-kinases: modulators of
neuronal development and plasticity. Neuron 59:914–931. DOI: https://doi.org/10.1016/j.neuron.2008.08.021,
PMID: 18817731
Wiegert JS, Mahn M, Prigge M, Printz Y, Yizhar O. 2017. Silencing neurons: tools, applications, and experimental
constraints. Neuron 95:504–529. DOI: https://doi.org/10.1016/j.neuron.2017.06.050, PMID: 28772120
Gantz et al. eLife 2021;10:e64241. DOI: https://doi.org/10.7554/eLife.64241 16 of 16You can also read