Two Faces of Arbutine in Hepatocelluler Carcinoma (HepG2) Cells: Anticarcinogenic Effect in LD50 Dose and Protective Effect Against Cisplatin ...
←
→
Page content transcription
If your browser does not render page correctly, please read the page content below
Two Faces of Arbutine in Hepatocelluler Carcinoma
(HepG2) Cells: Anticarcinogenic Effect in LD50
Dose and Protective Effect Against Cisplatin
Toxication Through its Antioxidant and Anti-
in ammatory Activity in LD0 Dose
Ömer Hazman ( omerhazman@hotmail.com )
Afyon Kocatepe Universitesi Fen Edebiyat Fakultesi https://orcid.org/0000-0002-2702-6847
Hatice Evin
Afyon Kocatepe Universitesi Fen Edebiyat Fakultesi
Mehmet Fatih Bozkurt
Afyon Kocatepe University: Afyon Kocatepe Universitesi
İbrahim Hakkı Ciğerci
Afyon Kocatepe Universitesi Fen Edebiyat Fakultesi
Research Article
Keywords: Cancer, Arbutine, Cytotoxicity, Genotoxicity, In ammation, Oxidative Stress
DOI: https://doi.org/10.21203/rs.3.rs-220164/v1
License: This work is licensed under a Creative Commons Attribution 4.0 International License.
Read Full License
Page 1/29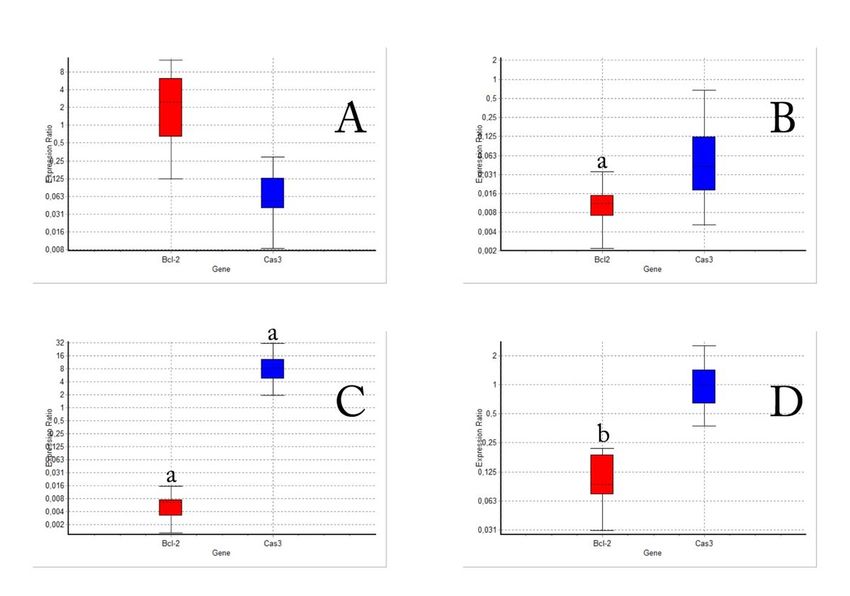
Abstract
Arbutine is one of the active substances used as a skin whitening agent in cosmetic products. Possible
effects of arbutine on hepatocelluler carcinoma (HepG2) cells and cisplatin toxication in HepG2 cells
were investigated in this study. Cytotoxicity, genotoxicity, oxidative stress, in ammation, apoptosis and
proliferation levels were determined in experimental groups established for the purpose above. It was
determined that when low dose of α-arbutine (in LD 0 dose) was administered to HepG2 cells alone, it had
no genotoxic and cytotoxic effects and no effects on in ammation, apoptosis and proliferation. However,
when low dose of arbutine was used with cisplatin, it was observed that oxidative stress, in ammation,
and genotoxicity levels increased as a result of cisplatin toxicity, but caspase 3 levels were not affected
by this situation. As a result of high dose (in LD 50 dose) of α-arbutine administration to HepG2 cells, it
was determined that it would have anticarcinogenic effects by increasing oxidative stress, genotoxicity,
in ammation and apoptosis and by suppressing proliferation. In the presented study it was determined
that as well as α-arbutine had an anticarcinogenic effect on HepG2 cells in high doses, it might be
protective to reduce the side effects caused by low dose (LD 0 dose) of cisplatin treatment. In addition, it
was concluded that α/β-arbutine-including cosmetic products were safe for cancer patients because α/β-
arbutine had no effect on proliferation in HepG2 cells. In order to present the activity of arbutine isoforms
more clearly it is recommended that studies should be conducted using healthy and different cell lines.

Introduction
Cancer is among the global problems affecting public health and economy. According to GLOBOCAN
database data prepared by International Agency for Research on Cancer (IARC) using the data from 185
countries, 18.1 million people in the world were diagnosed as cancer and 9.6 million died of cancer in
2018. If cancer types are listed in terms of incidence, lung (11,6%), breast (11,6%), colon (10.2%), prostate
(7,1%), stomach (5.7%) cancers can be uttered in the top ve. Liver cancer is the 6th most common
cancer type with its 4.7% of incidence rate [1].

From past to present Cisplatin [cis-diamminedichloroplatin (II)] has been one the most commonly used
chemotherapeutics whose biological activity was rst reported in 1965. Cisplatin is among the effective
chemotherapeutics that can be also used for the treatment of hepatic cancer. Cisplatin is also effective
against various types of cancer including carcinomas, germ cell tumors, lymphomas and sarcomas.
However, side effects of cisplatin (nephropathy, allergic reactions, decreased immunity to infections,
bleeding and hearing loss especially in young patients, etc.) and developing drug resistance may restrict
the activity of cisplatin in the treatment [2–4].

Arbutine is used as a powerful skin whitening agent in cosmetic industry due to its strong inhibitory effect
on human tyrosinase activity [5]. It can also cure cystitis and urinary tract infections as it expels kidney
stones and has antibacterial properties [6]. Moreover, it is commonly used in pharmaceutic industry due
to its antioxidant, antimicrobial and anti-in ammatory activities [7]. Many studies have shown that it can
be particularly effective on skin cancer [8, 9].
                                                   Page 2/29
Arbutine in glyloside form has two different isomers depending on the binding way of the hydroquinone
bound to the anomeric carbon atom in the glucose molecule. These isomers are α-arbutine and β-
arbutine. Natural arbutine isolated from plants is β isomer [10]. Alpha arbutine is usually produced
through the transglucosylation of hydroquinone by microbial glycosyltransferases. Seven different
microbial enzymes that can produce α-arbutine including alpha amylase, sucrose phosphorylase,
cyclodextrin glycosyltransferase, α-glucosidase, dextransucrase, amylosucrose and sucrose isomerase
were identi ed [5]. In addition, deoxycarbutin (4-[(tetrahydro-2H-pyran-2-yl) oxy] phenol) obtained by
reducing arbutine (removing hydroxides from the pattern in glucose ring in the hydroquinone side chain)
was also produced synthetically and used in the composition of cosmetic products [11]. The conducted
studies indicate that cytotoxicity of arbutine types is lower than hydroquinone and therefore it can be
regarded as a safer skin whitening agent [11–13].

Hydroquinones have been used for nearly half a century in the treatment of melasma, hyperpigmentation
and especially facial freckles. The use of hydroquinone which is a derivative of benzene, a carcinogenic
substance, has recently been forbidden especially in cosmetic products [14]. One of the most important
reasons is that it has been shown by scienti c studies conducted in clinics, experimental animals and cell
culture models that hydroquinones can induce formations such as oxidative stress and DNA damage in
the organism [15–18]. Hydroquinones can easily be formed through arbutine hyrolysis (Fig. 1).
Hydroquinone in low concentrations was found in human urine and plasma [19]. These hydroquinone
amounts are lower than the amounts of arbutine taken with food. This means that arbutine isoforms
release the hydroquinone in glycoslated form through hydrolysis only when they reach the tissues or cells
they will affect. Therefore, arbutine isoforms can only have effects on some tissues and cells (including
enzymes that can hydrolise the arbutine hydroquinone) without having toxic effects for the whole
organism as hydroquinones do.

Figure 1 Hydrolise of Arbutine

Concerning the reliability of α-arbutine and β-arbutine in cosmetics, Scienti c Committee of Consumer
Safety (SCCS) states that α-arbutine rate in cosmetics should have to be 2% in face creams and 0.5% in
body lotions [20] and this rate can be increased to 7% in face creams for β-arbutine [21]. This information
indicates us that β-arbutine isolated from natural sources is used in cosmetic products in higher rates
than α-arbutine produced sythetically. In other words, it states that synthetically produced α-arbutine can
have effects even in low concentrations. This can be due to the fact that α-arbutine inhibites the
tyrosinose enzyme in 15 times lower concentrations than β-arbutine. Thus, the conducted studies indicate
that while LD 50 doses which are effective in inhibation of tyrosinose enzyme are 2 mM for α-arbutine,
they are 30 mM for β-arbutine [22, 23].

New treatment protocols that are non-toxic because of their side effects, multi-targeted and do not cause
drug resistance are needed in the treatment of liver cancer and other types of cancer. In this context,
natural active substances with limited toxic effects continue to be alternative. The studies conducted in
this eld indicate that natural active substances may contribute to the development of new solutions for

                                                  Page 3/29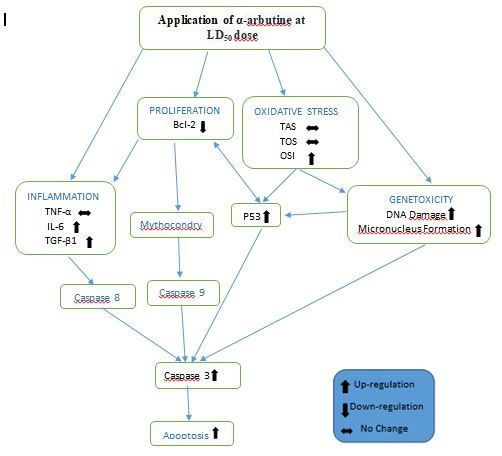
cancer treatment. The effects of α-arbutine and cisplatin in HepG2 cells were investigated separately and
together in this study. Thus, the possible bene ts/harms of arbutine against liver cancer and cisplatin
intoxication in liver cancer were tried to be determined on an in-vitro model.

Materials And Methods
Cell lines and culture conditions
HepG2 cells were obtained from the American-Type Culture Collection (ATCC) (Manassas, VA, USA). The
complete medium used for the reproduction of cells was prepared using low glucose (1000 mg/L) DMEM
(Sigma) including 10% of Fetal bovine serum (Copricorn), 1% of penicillin streptomycin (Sigma), 1% of
sodium pyruvate (Sigma), 1% of glutamin (Sigma). All incubations administered to the cells throughout
the study were performed in a CO2 incubator (Panasonic) at 37 C and in a medium containing 5% of
CO2.

Thawing and Culturing Cells
HepG2 cells were brought to the laboratory in cryotubes in liquid nitrogen. The frozen cells in the
cryotubes were rst taken from liquid nitrogen to -80°C. After waiting for 10 minutes, it was left to
dissolve by incubating in a hot water bath at 37°C for 1–2 minutes. In the meantime, 5 mL of medium
was placed on a 15 mL of falcon tube. The cells in the cryotube which were about to dissolve completely
in the water bath were taken to the prepared falcon tube (that medium was put into it). It was then gently
pipetted and centrifuged immediately. At the end of the centrifuge, the medium was drawn with a pipette
without contacting the cells accumulated on the falcon base. A second wash was performed by adding 2
mL of medium onto the cell palette again and gently pipetting. The medium remaining on the cells after
the centrifuge was drawn again. HepG2 cells, which were dissolved as explained and puri ed from
dimethyl sulfoxide (DMSO) in 2 washes, were dissolved in 1 mL of medium and then cultured to a 25 mL
of ask. When the 25 mL of ask became capacious, the cells continued to be replicated by passaging to
the 75 mL of ask.

Counting the Cells by Trypan Blue Method
When the cells are cultured to wellplates or asks in order to use in analyses, it is essential to culture the
same / close number of cells in each ask or wellplate. For that reason, before the cells were cultured in
well plates, how many cells per mL were determined and the cells were counted. For this purpose, trypan
blue cell counting method was used. Trypan blue is a paint that enables live cells to be seen bright under
the light. While live cells painted with trypan blue applied to the slide to be counted are seen as bright
under the microscope, dead cells are seen as blue and at. The cells in four counting zones (A-D)
consisting of 16 squares each on the counting slide were counted and averaged and therefore the cell
counting was completed. Trypan blue method used in live cell counting was tried to be outlined in Fig. 2.

Figure 2 The methodology used in counting the cells by trypan blue method

                                                   Page 4/29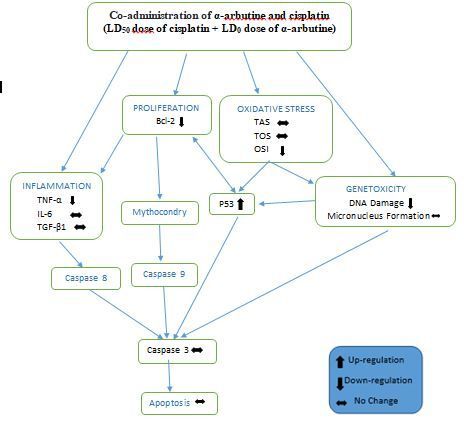
The number of cells per milliliter of medium-cell suspension is calculated using the formula following the
cell count. The amount of dilution is important in terms of the reliability of counting. The average number
of cells between 50 and 150 is an indicator that the cell suspension was processed to ideal dilution. If the
average number of cells is very high, volume of the cells in trypan blue-cell mixture is reduced and more
diluted cell suspension is obtained and the count is repeated. In this case dilution rate will also increase.
The counting can be performed using the mixture obtained after the volume is completed to 100 µL with
trypan blue (dilution rate is 10 or 5) by taking 10 or 20 µL of cell suspension in cases where the number
of cells is very high. The following formula is used in order to determine the number of cell per mL:

Number of live cells per mL = (Average Number of Cells) x (104) x (Dilution Factor)

Cells were counted in the presented study as the following. Cells removed from the ask base by
trypsinization and puri ed from trypsin by detripinization were dissolved in 4 mL of medium. 50 µL of cell
suspension was taken and mixed with 50 µL of trypan blue (dilution rate is 2). Slides and lamellas
(Neubauer counting chamber) to be used in counting were prepared. 10 µL of trypan-blue suspension
mixture was taken by pipetting and mounted to the neubauer slide properly. Taking the averages of the
cells counted in counting zones, the amount of cells per mL of cell suspension was found with the help of
the formula. Afterwards, how many mL of the cell suspension should be taken according to the number
of cells to be used in the applications was calculated and manipulations with the cells were initiated.
Cytotoxicity Analyses (MTT analyses)
Cytotoxicity levels of the arbutine isoforms, α-arbutine and β-arbutine, in HepG2 cells were determined by
MTT (3–4,5-dimethyl-thiazolyl-2,5-diphenyltetrazolium bromide) method. Cancer cells were cultured in 96
piece-well plates as 5000 cells per 200 µL of medium in each well. Cells were incubated for 24 hours so
that the cultured cells could take roots to the ask base. Following the incubation mediums of cells were
exchanged with the mediums prepared by dissolving α-arbutine and β-arbutine in appropriate
concentrations. The mediums with α/β-arbutines used in MTT analyses were prepared in 7 different
concentrations between 0,5 and 200 mM. Each dose application was studied as at least 3 replications.
Mediums without arbutines were added into the control wells in the same volume. Then, cells were again
left to incubation for 24 hours.

The MTT solution was prepared as in 5 mg / mL of concentration by dissolving the MTT salt (Sigma) in
phosphate buffer (PBS) with pH 7.4. At the end of the incubation, MTT solution in a volume of 10% of the
well volume was added to each well. Cells were incubated in this way for 2–4 hours more. Incubation
may be limited to 2 hours if there is excessive formation of formazan crystals (purple) in the wells.
Because excessive increase in colour density in wells may lead to higher optical densities to be obtained
from spectrophotometers. In this case it is possible to get no results from MTT analyses. For that reason,
it is important to monitor the colouration in wells after the rst two hours as the cells are incubated with
MTT solution. If the formation of formazan crystals in the wells in MTT analysis is low, duration of the
incubation can be extended to four hours. However, duration of incubation should not be exceed to 4

                                                   Page 5/29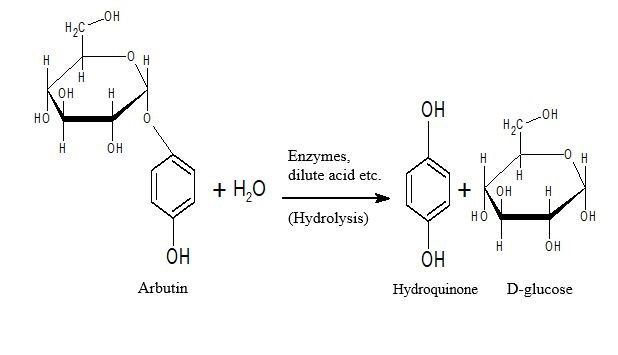
hours. Because long incubation durations may lead to coloration in dead cells due to the coloration in
mediums by formazan crystals occuring in wells. This may cause to get false results from MTT analysis.

The medium in the wells was pipetted without damaging the formazan crystals formed after incubation
with the MTT solution. Following this operation, 200 µL of DMSO was added to each well and formazan
crystals were dissolved. Finally, optical density of the samples were almost immediately determined at
540 nm using ELISA microtype reader (Biotek, ELx800). Cell viability of the control group without any
arbutine was regarded as 100 % and the effect of each dose on cell viability was calculated using the
given formula below [24, 10].

Cell viability (%) = [ (100 * Absorbancesample)/ (Absorbancecontrol) ]

Lethal doses (such as LD 0, LD 50) belonging to arbutine isoforms in HepG2 cells were determined using %
viability rates that each dose created in cells. Lethal doses were calculated using Epa Probit Analysis
Program (Version 1.5). After the lethal doses were determined in the study, experimental groups were
created and administrations were initiated. The experimental groups created within the scope of the study
were presented in Table 1.

                                                 Table 1
                 Experimental groups created in the study and the administrations to cells
 Groups                Administrations to the cells

 Group 1 :             The medium used as a solvent to dissolve α-arbutine and saline solution used as
                       a solvent for cisplatin were administered in the same volume.
 Control

 Group 2 :             α-arbutine dissolving in the medium was administered to cells in LD 0 dose.

 α-arbutin (LD 0)

 Group 3:              α-arbutine dissolving in the medium was administered to cells in LD 50 dose.

 α-arbutin (LD 50)

 Group 4:              Cisplatin dissolving in the sadline solution was administered to cells in LD 50
                       dose.
 Cisplatin (LD 50)

 Group 5:              Arbutine in LD 0 dose was administered to the cells with cisplatin in LD 50 dose
                       simultaneously.
 Cisplatin
 (LD 50)+α-
 Arbutin(LD 0)

Table 1. Experimental groups created in the study and the administrations to cells
Genotoxicity (Comet Assay and Micronucleus Test)
Analyses
                                                   Page 6/29
In order to determine how high and low doses of β-arbutin affect genotoxicity when administered to
HepG2 cells, DNA damage and micronucleus frequencies were determined in the samples. 24 hours after
the necessary operations in experimental groups indicated in Table 1, the cells were collected from the
ask base by trypsinisation and detrypsinisation. Cell suspensions belonging to the experimental groups
created in 1 mL of PBS (phosphate buffer seline) were used in the analyses.
Comet assay was used in order to determine DNA damage. 20 µL was taken from the cell suspension
prepared for this purpose and mixed with 100 µL of LMA (low melting agarose) in eppendorf. All of the
cell-LMA mixture in eppendorf was taken and mounted to slides prepared by treating with NMA (normal
melting agarose) the day before. Each prepared material was painted following the lysis and
electrophoresis stages. Painted preparations were scored by counting as 100 cells under uorescence
microscope [25].
Numbers (frequencies) of micronucleus as a result of arbutine administrations in samples were
determined using micronucleus test. For this purpose, the cells belonging to the samples in each group
were spread on clean slides. Dried slides were xed with pure ethanol for 20 minutes. Then, slides were
air dried. Cell nuclei were painted by waiting the dried slides for 20 minutes in 5 % of Giemsa solution.
Three slides were prepared from each sample in the analyses. 1000 cells from each preparation were
counted at 100X [26]. Micronucleus index values were evaluated over an average of 1000 cells.
Biochemical Analyses
Biochemical analyzes were performed on cell lysates obtained from cells. Cell lysates were prepared as
the following. 24 hours after the mentioned administrations to the experimental groups (Table 1) cells
were collected from falcon base following trypsinisation and detrypsinisation. Cells were nally washed
with 1 mL of PBS. After the wash, 500 µL of lysis buffer (PBS solution containing 1 % of triton-X-100 and
8 % of protease inhibitor cocktail) was added onto the cells. They were pipetted. Then, they were
sonicated (Binder) for 20 seconds in ice. It was waited for 40 seconds. Sonication was repeated for 10
times in this way. As a result of sonication, intracellular / organelle uids were allowed to pass into the
lysis buffer. Insoluble proteins in lysis buffer despite all administrations were precipitated by
centrifugation at 8500 rpm at 4 0C for 10 minutes. The supernatants obtained in this way were used as
cell lyzates in chemical analyses. Lysis buffer was used as a blank in analyses. Total protein, oxidative
stress and proin ammatory cytokine levels were determined through biochemical analyses in the
obtained cell lyzates.
Total antioxidant status (TAS) and total oxidant status (TOS) analyzes, which were analyzed as oxidative
stress parameters, were spectrophotometrically conducted using commercial kits (Rell Assays). In
addition, OSI levels were calculated by considering TAS levels determined as a general expression of
antioxidants in the samples and TOS levels determined as a general expression of oxidants in the
samples. OSI levels were calculated according to the following formula in accordance with the kit
protocols [10].
Page 7/29Oxidative Stress Index (OSI) = [(TOS/TAS) x 100]
Proin ammatory cytokine (TNF-α, IL-6 and TGF-β) levels were determined at 540 nm in a microplate
reader (Biotek ELx800) using human speci c ELISA kits (Sun Red). The data obtained from the
biochemical analysis were normalized by dividing each sample's own total protein levels. Protein levels of
cell lyzates used in biochemical analyses were determined by spectrophotometrical method at 595 nm
with the help of a commercial ELISA kit (Fluka) in which Coommassi Brilliant Blue reactive was used.
Determination of RNA Isolation, cDNA Synthesis and mRNA
Expression Levels
Bcl-2 and Caspase 3 mRNA expression levels were analyzed by Reverse Transcription-Polymerase Chain
Reaction (RT-PCR) method using total RNA isolated from control and treatment groups in HepG2 cells
and cDNAs synthesized afterwards. In the analyses total RNAs belonging to HepG2 cells were isolated by
using commercial kit (Gene Matrix). Concentration and quality of the obtained RNAs were determined in
nanodrop (BioTek, Epoch 2). Among the isolated RNAs the ones with optical densities (OD 260/280)
between 1.7 and 2.2 obtained at 260 nm and 280 nm were used in the study.
In order to be used as a template in the PCR reaction, 2 µg of total RNA belonging to each sample was
taken and complementary DNA (cDNA) synthesis was rst performed through reverse transcriptase (RT).
For this purpose, cDNA synthesis kit was used (Thermo). Sybr Green PCR Master Mix (12.5 µL) and
primer pair (oligonucleotide) were added in accordance with the protocols using 1.5 µL of the cDNA
belonging to each sample. Primers are speci c for each transcription analysis and were determined using
studies in the literatüre [24, 28]. The primers presented in Table 2 were used as 100 ng in each RT-PCR
reaction.
Table 2
Oligonucleotide primer series and RT-PCR programs
Transcripts Primer Sequences RT-PCR programs Cycles
β-Aktin F-5′CACCCCAGCCATGTACGTTGC 93o-15 s / 61o-30 s / 68o-1 dk 35
R-5′CCGGAGTCCATCACGATGCCA
Caspase 3 F-5′GGAAGCGAATCAATGGACTCTGGA 94o-1 dk / 59o-1 dk / 72o-1 dk 35
R-5′CCTGAGGTTTGCTGCATCGAC
Bcl-2 F-5′GACGGGCTACGAGTGGGATGC 94o-1 dk / 58o-1 dk / 72o-1 dk 35
R-5′GGAGGAGAAGATGCCCGGTGC
Table 2. Oligonucleotide primer series and RT-PCR programs
With reference to the cycling threshold (Ct) values of the ampli cation curves of each sample in the
analysis performed on the RT-PCR device (Biorad CFX-96), the relative changes in the mRNA expression
Page 8/29levels of the target genes were calculated by 2− ΔΔCt method [29]. Calculations were performed using
REST 2009 software (Qiagen, Germany). mRNA expression levels were determined as fungible decrease
or increase. Beta actin gene was used as the endogenous control. Expression levels of other genes were
emended (normalized) according to the beta actin gene level of each sample.
Immunocytochemical Analyses
The number of caspase 3 positive (Cas3+) cells and the percentage of the number of p53 (p53+) positive
cells in experimental groups were determined in the study through immunocytochemical analyses. For
this purpose, the cells detected in 4 % of buffered neutral paraformaldehyde solution for 24 hours were
washed 3 times with distilled water at the end of incubation. Routine tissues were monitored using
palettes through cytoblock administration. Cells were blocked in para ne and sections with 4 µm of
thickness were cut using a microtome. The samples taken onto the adhesive coated slides were stained
using immunocytochemical technique. For this purpose, rabbit anti-caspase 3 (1/200 of dilution, Abcam,
ab13847, Cambridge, UK) and Mouse anti-p53 (1/25 of dilution, DAKO, M7001, CA, US) antibodies were
instilled on the samples. Avidin Biotin Complex (ABC) method kit (TA-125-UDX, UltraVision Polyvalent
HRP Kit, LabVision/ThermoScienti c-US) administration was initiated. First, biotinylated igG was
dropped. It was incubated for an hour at room temperature. Then, horse radish peroxidase enzyme
conjugated avidin was instilled and left to the reaction for 30 minutes at 37 ºC. Slides were washed and
tissues were treated with 3-amino-9-ethylcarbazole (AEC) peroxidase substrate (TA-060-HA, AEC
Substrate System, LabVision/ThermoScienti c-US). Finally, Gill's (III) hematoxylin was used for the
background staining and the slides were covered using an aqueous mounting medium. All samples were
examined under light microscopes. They were analyzed by using Zeiss Axio Lab.A1 Microscope-
AxioCam ICc 5 Camera (ZEN 2, Carl Zeiss Microscopy GmbH) and image J software [10]. The number of
caspase 3 positive (Cas3+) cells per mm2 was used when evaluating caspase 3. The percentage of the
number of p53+ cells per unit squares (10 largest magni cation zones) was used when evaluating p53.
Statistical Analyses
The obtained data were identi ed as average ± standard deviation (SH) and SPSS 18 package program
was used in data evaluation. Whether the data were normally distributed or not was initially tested. One-
way analysis of variance (ANOVA), one of the parametrical tests, and Duncan test as post hoc test were
applied to the data with normal distribution. Kruskal-Wallis test, one of the non-parametrical tests, was
applied to the analysis results without normal distribution to determine whether there was a statistical
difference or not. Which groups from the control groups indicated statistical difference in the parameters
in which there was a statistical difference between each other was determined by the Mann-Whitney U
test.
Results
Page 9/29Determination of cytotoxicity levels of arbutine isoforms
and cisplatin in HepG2 cells
Data of the cells applied arbutine in different doses were compared with control group and the obtained
% cell viability rates were presented in Fig. 3.
Figure 3 Cytotoxicity levels of α-arbutine ve β-arbutine in different doses in HepG2 cells
The effect of seven different concentrations (0,5mM, 1 mM, 10 mM, 25 mM, 50 mM, 100 mM ve 200 mM)
of α/β-arbutines on HepG2 cell viabilities were determined in the conducted analyses. The obtained
ndings indicate that α/β-arbutines have cytotoxic effect in all used doses. It was determined that
cytotoxicity increased in direct proportional to used α/β-arbutine doses.
Cytotoxicity of the cisplatin in HepG2 cells was also determined through MTT analysis. The effect of
seven different concentrations (1µg, 2µg, 5µg, 10µg, 20µg, 40µg, 60µg, 80µg, and 100µg) of cisplatin on
HepG2 cell viability was determined in the conducted analyses. It was concluded that cisplatin had
cytotoxic effect in all used doses. Toxicity of cisplatin in HepG2 cells were indicated in Fig. 4.
Figure 4. Cytotoxicity of cisplatin in HepG2 cells
Lethal doses of both α-arbutine and β-arbutine and cisplatin in HepG2 cells were calculated using the
data obtained from MTT analyses (Tablo 3). When the calculated lethal doses of α-arbutine and β-
arbutine are compared, it is observed that LD 50 dose of α-arbutine is lower. This means that the same rate
of cytotoxicity in HepG2 cells can be achieved with lower doses of α-arbutine in LD 50 dose. In other
words, toxicity of α-arbutine is higher than toxicity of β-arbutine. Therefore, α-arbutine was used for the
rest of the study.
Table 3. Lethal doses of cisplatin, α-Arbutine and β-Arbutine (LDs)
Page 10/29Table 3
Lethal doses of cisplatin, α-Arbutine and β-Arbutine (LDs)
Lethal Dozlar Cisplatine ait α-Arbutine ait β-Arbutine ait Lethal Dozlar
Lethal Dozlar Lethal Dozlar (mM)
(µg/mL) (mM)
LD 0 0,006 0,003 0,022
LD 5 0,055 0,057 0,226
LD 10 0,178 0,261 0,779
LD 15 0,393 0,733 1,795
LD 50 11,060 57,471 61,270
The Effect of α-Arbutine in HepG2 Cells on Genotoxicity,
Oxidative Stress and In ammation
Conducted genotoxicity tests indicate that α-arbutine in HepG2 cells in LD 0 dose has no genotoxic effect.
However, as a result of the administration of α-arbutine and cisplatin in LD 50 doses, it was determined
that both DNA damage (Comet scores) and micronucleus formation were statistically higher than the
control group (Table 4) and therefore genotoxicity occurred. With the administration of cisplatin, it was
determined that α-arbutine in LD 0 dose reduced the DNA damage (comet scores) and decreased the
genotoxicity induced by cisplatin.
Page 11/29Table 4
The effect of α-arbutine administered to experimental groups on genotoxicity, oxidative stress and
in ammation
Analyzed Experimental Groups P
parameters Group 1 Group 2 Group 3 Group 4 Group 5
Control α- α-arbutin Cisplatin Cisplatin (LD 50) +
arbutin (LD 50) (LD 50) α-arbutin (LD 0)
(LD 0)
Comet Scores 3,33 ± 4,67 ± 7,67 ± 13,67 ± 10,00 ± 3,95b 0,000**
0,82 1,21 0,52 a 2,07a
(Arbitrary Unit)
Micronucleus 0,0117 0,0183 0,0433 ± 0,0533 ± 0,0467 ± 0,0082 0,000**
frequencies (%) ± ± 0,0041 0,0052 a 0,0163 a
0,0041
TAS 0,297 ± 0,152 ± 0,226 ± 0,136 ± 0,192 ± 0,032 0,253*
0,079 0,037 0,041 0,060
(mmolTroloxEquiv/g-
protein)
TOS 2,66 ± 2,34 ± 7,24 ± 4,74 ± 2,52 ± 1,26 1,26*
1,16 1,18 2,45 a 0,96
(µmolH2O2Equiv./g-
protein)
OSI 862,8 ± 1635,4 3400,7 ± 4695,3 ± 1289,6 ± 493,9 b 0,006*
256,1b ± 550,6 977,3 a,b 1089,8 a
(Arbitrary Unit) b
MDA 1,81 ± 3,51 ± 5,29 ± 3,53 ± 2,32 ± 0,49 0,138*
0,94 1,62 2,78 a 2,46
(nmol/g-protein)
GSH 45,65 ± 33,34 ± 49,67 ± 38,69 ± 29,36 ± 7,64 0,225*
31,76 1,86 28,65 26,90
(µmol/g-protein)
NO 3,74 ± 7,03 ± 10,52 ± 11,93 ± 7,54 ± 2,58 0,026*
0,45 b 3,36 2,88 a 5,29 a
(µmol/g-protein)
Data are given as mean ± standard deviation (n = 4–7). * Shows the P value of the data showing
normal distribution and applying the ANOVA test and Duncan posttest. ** It shows the P value of the
data that do not show normal distribution and which are applied Kruskal-Wallis test, which is one of
the non-parametric tests. Statistical differences between data belonging to a single parameter in the
same row are expressed as superscript (a, b) with letters. LD 0: Lethal dose that does not cause any
death or proliferation in cancer cells, LD 50: Lethal dose that causes the death of half of cancer cells,
a
p 0.05; refers to the groups that are statistically different from the control group.
b
p 0.05; refers to the groups that are statistically different from the cisplatin group.
Page 12/29Analyzed Experimental Groups P
parameters Group 1 Group 2 Group 3 Group 4 Group 5
Control α- α-arbutin Cisplatin Cisplatin (LD 50) +
arbutin (LD 50) (LD 50) α-arbutin (LD 0)
(LD 0)
TNF-α 39,94 ± 43,05 ± 27,71 ± 85,42 ± 51,16 ± 29,78 b 0,008*
14,86 b 16,30 b 15,88 b 15,88 a
(pg/mg-protein)
IL-6 55,75 ± 48,80 ± 97,17 ± 82,72 ± 73,72 ± 25,93 0,085*
17,42 5,84 42,72 a 15,73 a
(pg/mg-protein)
TGF-1β 22,53 ± 17,79 ± 45,47 ± 24,94 ± 26,87 ± 10,52 0,011*
7,06 2,90 16,20 a 5,95
(pg/mg-protein)
Total Protein 2,12 ± 2,35 ± 1,36 ± 1,51 ± 1,54 ± 0,36 0,025*
0,72 0,20 0,49 a 0,18
(mg/L)
Data are given as mean ± standard deviation (n = 4–7). * Shows the P value of the data showing
normal distribution and applying the ANOVA test and Duncan posttest. ** It shows the P value of the
data that do not show normal distribution and which are applied Kruskal-Wallis test, which is one of
the non-parametric tests. Statistical differences between data belonging to a single parameter in the
same row are expressed as superscript (a, b) with letters. LD 0: Lethal dose that does not cause any
death or proliferation in cancer cells, LD 50: Lethal dose that causes the death of half of cancer cells,
a
p 0.05; refers to the groups that are statistically different from the control group.
b
p 0.05; refers to the groups that are statistically different from the cisplatin group.
Table 4. The effect of α-arbutine administered to experimental groups on genotoxicity, oxidative stress
and in ammation
When the effect of arbutine in HepG2 cells on oxidative stress was examined, it was determined that
arbutine did not affect TAS, TOS, OSI, MDA, GSH, NO parameters in LD 0 dose as compared to control
group. It was observed that oxidative stress increased as levels TOS, OSI, MDA, NO went up when α-
arbutine was administered in LD 50 doses. It was determined that oxidative stress increased as OSI, NO
levels went up when cisplatin was administered. However, it was observed that oxidative stress index
decreased in the cells (Group 5) administered α-arbutine in LD 0 dose with cisplatin (Table 4).
In this studies conducted in order to identify the effect of α-arbutine on in ammation it was determined
that arbutine in LD 0 dose did not affect the in ammation as compared to control group. It can be stated
that acute in ammation occurs as IL-6 and TGF-β levels increase when α-arbutine is administered in LD 50
dose and TNF-α, IL-6 and TGF-β levels increase when cisplatin is administered. It was identi ed that in the
Page 13/29group (Group 5) in which α-arbutine was administered in LD 50 dose along with cisplatin only TNF-α levels
decreased as compared to the group in which cisplatin was administered.
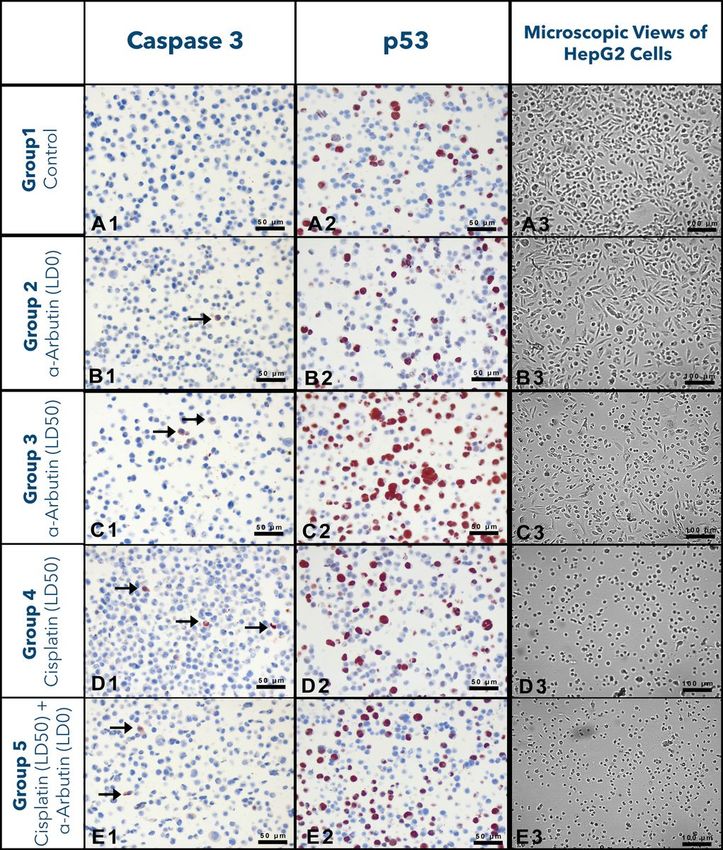
The effect of cisplatin and α-arbutine on expression levels of caspase 3 and Bcl-2 mRNA in HepG2 cells
mRNA expression levels of Bcl-2, a proliferative gene and caspase 3, an apoptotic gene, were determined
when α-arbutine and cisplatin were administered to HepG2 cells in different doses (Fig. 5). While Cas3
and Bcl-2 gene expression levels did not change compared to control group as α-arbutine was
administered to the cells in LD 0 dose, Bcl-2 levels were suppressed as α-arbutine was administered to the
cells in LD 50 dose (Fig. 5A and Fig. 5B). However, it was found that when cisplatin in LD 50 dose was
administered to the cells, it suppressed the proliferation (Bcl-2) as expected from a chemotherapeutic
agent, but induced apoptosis (Cas 3) (Fig. 5C). When the data of the group in which α-arbutine was
administered to the cells in LD 0 dose along with cisplatin, it was observed that Bcl-2 levels were
suppressed (Fig. 5D).
Figure 5 The effect of α-arbutine on apoptasis (Cas3) and proliferation (Bcl-2) in HepG2 cells
The numbers of Cas3 and p53 positive cells belonging to
experimental groups
As a result of immunocytological analyses, the numbers/rates of Cas3+ and p53+ cells in experimental
groups were calculated and presented in Table 5. The obtained data refer that number of Cas3+ cells
statistically increased in the groups in which α-arbutine or cisplatin was administered in LD 50 dose. It was
determined that α-arbutine in LD 0 dose did not affect the number of Cas3+ cells. When p53+ cell rates %
were examined, it was found out that α-arbutine in LD 0 dose decreased the number of p53+ cells; however,
α-arbutine in LD 50 dose could noticeably induce p53-mediated apoptosis. The microscope images
obtained from the slides used in the statistical evaluation of the experimental groups mentioned in
Table 5 were presented in Fig. 6.
Page 14/29Table 5
Numbers of caspase 3 and p53 positive cells
Experimental Groups Caspase 3 p53
(Number of Cas3 + cells in mm2) (p53+ cell percentage
per unit area)
Grup 1: 60,45 ± 6,03b 48,82 ± 12,38b
Kontrol
Grup 2 : 75,59 ± 30,92 31,28 ± 9,81a,b
α-Arbutın (LD 0)
Grup 3: 104,93 ± 45,16a 73,20 ± 8,63a,b
α-Arbutın(LD 50)
Grup 4: 121,35 ± 41,02a 49,97 ± 10,81
Cisplatin LD 50
Grup 5: 107,81 ± 43,41a 59,68 ± 15,76a,b
Cisplatin LD 50 + α-Arbutın (LD 0)
P 0,004 0,000
The data were presented as average ± standard deviation (n = 6). Statistical differences between
experimental groups are expressed in letters as superscripts (a, b).
a
p 0.05; refers to the groups that are statistically different from the control group.
b
p 0.05; refers to the groups that are statistically different from the cisplatin group.
Table 5. Numbers of caspase 3 and p53 positive cells
Figure 6 Microscope images of the cells used in immunocytochemical evaluation.
Discussion
New treatment protocols that are non-toxic because of their side effects, multi-targeted and do not cause
drug resistance are needed in the treatment of liver cancer and other types of cancer. In this context,
natural active substances with limited toxic effects continue to be alternative. The studies conducted in
this eld indicate that natural active substances may contribute to the development of new solutions for
cancer treatment. It was aimed to determine the potential effects of α-arbutine in HepG2 cells, liver cancer
cell lines, in this study. In addition, the effects of α-arbutine on in ammation, oxidative stress and
genotoxicity occuring as a result of cisplatin toxication in HepG2 cells were tried to be determined. Thus,
Page 15/29the question of “Are there any possible bene ts/ harms of α-arbutine in reducing side effects by cisplatin
in liver?” was sought to be answered.
Oxidative stress and in ammation are also regarded among the signi cant reasons of cellular damage
occuring in cancer etiology. An increase in oxidative stress and in ammation with weakening of the
immune system in the organism in advanced stages is observed during the cancer development.
Therefore, antioxidant supplements may be important to increase the body resistance. However,
considering that supplements can contribute to the growth of cancer cells, the use of antioxidant
supplements in right doses (LD 0 dose) and in conscious way is important. For that reason, analyzing the
effects of antioxidant substances on cancer cells and sharing those effects with the science world may
contribute to the development of new approaches in cancer treatment.
While several antioxidants such as arbutine have a protective role for organisms and cells in low doses,
they can be cytotoxic by inducing apoptosis and suppressing proliferation in high doses. Bioactive
substances having protective effect in low doses and cytotoxic effect in high doses have been the subject
of researches for many years due to their anticarcinogenic effects in cancer cells. In order to determine by
which mechanisms α-arbutine in high doses induces apoptosis in HepG2 cells, in ammation, oxidative
stress and genotoxicity levels were analyzed in experimental groups as well as apoptosis level. In the
light of the ndings, it was tried to be outlined that by which mechanisms α-arbutine applied to HepG2
cells especially in LD 50 dose might have anticarcinogenic effect.
As a result of MTT analyses, it was determined that high doses of arbutine isoforms in HepG2 cells might
have a cytotoxic effect. It was observed that as the doses of both α-arbutine and β-arbutine increased in
HepG2 cells, cell viability decreased, but their cytotoxicity increased. No similar study was found in
literature on HepG2 cells and arbutine. However, it is stated in the literature that arbutine does not indicate
cytotoxicity in low doses [1], but it may have cytotoxic effects in high doses, therefore we can mention
about the anticarcinogenic activity [10].
As a result of MTT analyses, it was determined that the cytotoxicity of α-arbutine, one of the isoforms of
arbutine, was higher than β-arbutine in HepG2 cells. Different cytotoxicities of arbutine isomers may be
related to the different pharmacokinetics of both isomers. It is stated also in a study conducted with a
different cell line in literature that the cytotoxicities of α-arbutine and β-arbutine in MCF-7 cells are
different. It is stated in the related study that β-arbutine has more cytotoxic effects than α-arbutine in
MCF-7 cells [10].
Since it was also aimed to determine the effects of arbutine on cisplatin toxication in this study, LD 50
dose of cisplatin that might have cytotoxic effect in HepG2 cells were determined through MTT analyses.
It was determined that cytotoxicity of cisplatin in HepG2 cells rapidly increased as of 2 µg/mL of
concentration. LD 50 dose of cisplatin for HepG2 cells was found as 11,06 µg/mL in the calculations. As
the studies on HepG2 cells in literature are examined, it is stated that cytotoxic doses of cisplatin are
higher. For instance, in a study using cisplatin doses in the 5–80 µg/mL concentration range, it is stated
Page 16/29that cisplatin can only reduce proliferation in HepG2 cells by 30–40 % in high doses (40–80 µg / mL) [3].
Such different cytotoxicities of cisplatin in HepG2 cells can be related to the used cisplatin solution.
Because additional buffering agents such as mannitol can be added to cisplatin solutions in injectable
form used for cancer patients in order to reduce toxic effects and side effects. Not the injectable cisplatin
solution prepared for the treatment of cancer in humans, but the active substance cisplatin itself was
used in the presented study. For that reason, toxication rate of cisplatin might have been found higher
than the literature.
After the lethal doses of α-arbutine, β-arbutine and cisplatin were determined in this study, the second part
of the study was initiated to determine the effects of arbutine on genotoxicity, oxidative stress,
in ammation, apoptosis and proliferation in HepG2 cells. As previously mentioned, only α-arbutine was
administered to the cells since the cytotoxicity of α-arbutine was found higher in this stages of studies.
Possible therapeutic (toxication decreasing) effect of arbutine was tried to be determined by using LD 0
dose (0,003 µM) of α-arbutine against cisplatin toxication.
It can be said that cisplatin in LD 50 dose has a genotoxic effect in HepG2 cells by increasing both DNA
damage and micronucleus development. In literature it was stated with different studies that cisplatin
caused genotoxicity by increasing DNA damage and micronucleus development [31, 32]. It was identi ed
that when α-arbutine was administered to HepG2 cells in LD 50 dose, α-arbutine had statistically more
signi cant and higher genotoxic effects not as much as cisplatin as compared to control group. No study
has been found in the literature on arbutine and HepG2 cells. However, in an in-vitro study it is stated that
orally administered arbutine did not cause DNA damage in rat hepatocytes [33]. However, in a study on
MCF-7 cells, a cell line out of HepG2, it is stated that β-arbutine, another isomer of arbutine, might have
genotoxic effects by increasing both DNA damage and micronucleus development in high doses [10].
It was determined in this study that when α-arbutine was administered in LD 0 dose (group 5) after
cisplatin toxication was induced in HepG2 cells, DNA damage decreased as compared to cisplatin group
(Group 4). These data bring to mind that α-arbutine in LD 0 dose may be bene cial in reducing possible
side effects of cisplatin in healthy cells by reducing toxicity caused by cisplatin toxication. In addition, the
reason why low doses of α-arbutine reduce DNA damage may be related to the antioxidant activity of
arbutine administered in low doses. In fact, in a study conducted by using U937 macrophage cells [34], it
is stated that arbutine has antioxidant activity by reducing the oxidative stress caused by ionizing
radiation in U937 cells. It is stated that arbutine shows this activity by neutralizing (scavenging) hydroxyl
radicals.
It is seen in the studies conducted using arbutine and different cell lines that the use of arbutine for
therapeutic purposes is in low doses. Studies indicate that arbutine in low doses may create antioxidant
and anti-in ammatory effects without having any cytotoxicity. The effects of arbutine on oxidative stress
and in ammation increasing as a result of toxication created with lipopolisaccharide in rat BV2 microglia
cells were investigated in a study. The ndings indicate that arbutine reduces the oxidative stress and
in ammation caused by the lipopolisaccharide without any cellular toxicity [35]. Protective effects of
Page 17/29arbutine in low doses (50–100 ve 150 µM) determined as non-cytotoxic against the toxication created
with tert-butyl hydroperoxide (t-BHP) in HepG2 cells were investigated in another study [36]. It is stated
that the administration of arbutine in low doses before toxication increases the antioxidant power in
HepG2 cells and therefore might reduce the cell deaths as a result of toxication. In this study cisplatin
toxication was created and it was determined that both oxidative stress and in ammation increased in
HepG2 cells as a result of toxication. It was also determined that α-arbutine treatment in low doses
following the toxication with cisplatin in HepG2 cells reduced the oxidative stress by decreasing OSİ
levels and the in ammation by decreasing TNF-α levels. (Table 4). Probably, these effects of arbutine in
low doses may be related to strong antioxidant activity of Arbutine [37, 34].
When a high dose of α-arbutine (57,471 mM) was administered to HepG2 cells, it was determined that
oxidative stress was induced by the increase in MDA, NO and OSI levels and acute in ammation was
induced by the increase in IL-6 and TGF-1β levels (Table 4). No source studies have been found in the
literature regarding the administration of arbutine in high doses in HepG2 cells. However, it is stated in a
study with MCF-7 cells, another cell line, that β-arbutine used in a high dose may increase the oxidative
stress and in ammation in cells [10].
The effects of arbutine, cisplatin and arbutine following the cisplatin toxication on apoptosis and
proliferation were also aimed to be determined in our study. As a result of the analyses through RT-PCR
and immunocytochemical methods it was determined that cisplatin caused apoptosis by inducing Cas3
expression in HepG2 cells. These data are parallel with the information in literature. Because it is stated
that when cisplatin is administered to HepG2 cells, Cas3 can be induced and it can lead to apoptosis [38].
According to the obtained results, it can be said that cisplatin inducing the apoptotic Cas3 is an effective
anticarcinogenic drug in HepG2 cells considering that it also supresses Bcl-2 mRNA gene expression
levels as well (Fig. 5).
In the immunostochemical analyses, it was indicated that the number of p53 positive cells in the cisplatin
group did not change compared to the control group. P53 is a highly important gene which plays a role in
regulation of apoptosis and cellular cycle. Because cellular cycle can be deactivated by p53 effect for
DNA repair in case of DNA damage. If DNA repair is not possible, apoptosis can be induced by p53 effect.
Therefore, excessive inhibition or loss in function of p53 is considered among the reasons of cancer
diseases. For that reason, if there is an induction / suppression of the p53 gene in HepG2 cells as a result
of cisplatin toxication, it is important to clearly reveal it. As previously mentioned, although it was
determined in the presented study that cisplatin did not cause any change in the number of p53+ cells in
HepG2 cells, it is stated in the literature that p53 can be induced via cisplatin and deactivate the cell cycle
[39, 40]. Information in literature partly contradicts with our ndings. To determine and clarify the possible
effects of cisplatin on p53 in hepatocellular carcinoma is important for explaining cisplatin activity in
treatment. For that reason, it would be bene cial to carry out further studies on this subject.
It was determined that the number of p53+ cells increased (Table 5, Fig. 6) when HepG2 cells were treated
with α-arbutine in LD 0 dose after administration of cisplatin. The fact that an agent used in combination
Page 18/29with cisplatin induces apoptotic p53 means that anticarcinogenic activity is increased. Therefore, it can
be considered that a low dose of arbutine treatment along with cisplatin in liver cancer may contribute to
the current treatments. Hence, the studies with arbutine and HepG2 indicate that the number of apoptotic
cells may increase as a result of the increase in Bax/Bcl-2 rate and the induction of Cas3 as the used
arbutine dose increases [41]. In this context, it was determined in this study that while the number of p53
positive cells signi canty increased when α-arbutine was administered to HepG2 cells in LD 50 dose, Bcl-2
mRNA expression levels were suppressed. These data indicate that while high doses of arbutine induce
apoptosis through p53, it may have anticarcinogenic effect (Fig. 7) by suppressing the proliferation
through Bcl-2. Similarly, in a study conducted with B16 murine melanoma cells, a different cell line, it was
indicated that arbutine induced apoptosis [42] while it reduced the proliferation of cancer cells by
suppressing the genes such as Bcl-xL and Bcl-2.
Figure 7 Mechanism that mediates the anticarcinogenic effects of α-arbutine in HepG2 cells (obtained by
comparing the data of control group and the experimental group administered α-arbutine in LD 50 dose.)
In conclusion, it was determined that when a low dose of α-arbutine (in LD 0 dose) alone was
administered to hepatocellular carcinoma (HepG2) cells, it had no genotoxic and cytotoxic activity and
did not affect in ammation, apoptosis and proliferation. In addition, it was determined that when a low
dose of arbutine was used for therapeutic purpose following the cisplatin toxication, decreases in
oxidative stress, in ammation and genotoxicity levels increasing as a result of cisplatin oxidation were
observed; however, caspase 3 levels were not affected by this situation. In other words, arbutine
administered in LD 0 dose reduces the severity of symptoms accompanying toxication without impairing
the anticarcinogenic activity of cisplatin created by apoptosis in HepG2 cells (Fig. 8).
Figure 8 Mechanism that mediates the cisplatin toxication reducing effects of α-arbutine in HepG2 cells
(obtained by comparing the data of cisplatin and the experimental group administered LD 0 dose of α-
arbutine following cisplatin toxication.)
These data bring to mind that when low doses of arbutine is used combined with cisplatin, it may be
bene cial to reduce the side effects that may occur in other healthy cells. In order to determine this
precisely, it may be useful to conduct similar studies using in-vitro models with healthy cell lines or in-vivo
models using experimental animals.
As previously mentioned and the mechanism of activity is indicated in Fig. 7, it was determined that α-
arbutine may have anticarcinogenic effects on hepatocellular carcinoma cells by increasing oxidative
stress, genotoxicity, in ammation, apoptosis and suppressing proliferation as a result of arbutine
administration in high doses (LD 50 dose) to HepG2 cells. It may be recommended to determine what kind
of positive/negative effects the arbutine in high dose may have on cells in other tissues and organs while
the activity of α-arbutine, which is determined in the cellular dimension, occurs. For this purpose, by
creating a hepatocellular carcinoma model in experimental animals, as well as determining the
Page 19/29therapeutic effects on liver cancer with high dose of arbutine administrations, the possible effects on
other tissues and organs can be determined.
Conclusion
It is important to determine the effects of active substances such as arbutine on different disease models
primarily in cell culture medium. Afterwards, if there are possible bene cial effects of the active
substance whose effects are investigated, it is necessary to carry out further studies using modelings to
be created with experimental animals and then phase studies in clinics. When the presented study is
regarded in this context, the possible effects of arbutine as an active substance in liver cancer (HepG2)
cells were investigated. It was determined that low doses of arbutine might be bene cial to remove the
side effects of chemotherapeutics (cisplatin) used in cancer treatment; however, in high doses it might be
used as an active substance with anticarcinogenic effect in hepatocellular carcinoma (HepG2) cells. In
the light of the obtained ndings, it is thought that it might be bene cial to carry out further studies in
order to present the possible effects of arbutine on liver cancer and metabolism in detail.
Declarations
Ethics approval and consent to participate: The study does not involve human participants, human data,
or human tissue. In adition this article does not contain any studies with animals performed by any of the
authors.
Consent for Publication: Not applicable.
Availability of Supporting Data: Not applicable
Competing Interests: The authors declare that they have no competing interests.
Funding: This study is supported by Afyon Kocatepe University Scienti c Research Projects Coordination
Unit (Project Number: 17.FENBIL.10).
Authors’contributions: Ömer Hazman: Methodology, Investigation, Writing-Reviewing and Editing; Hatice
Evin: Investigation, Writing- Original draft preparation; Mehmet Fatih Bozkurt: Pathological analyses,
Visualization, Data curation, İbrahim Hakkı Ciğerci: Software, genotoxicity analysis, Validation.
Knowledge and Acknowledgement: Thanks to Ahmet Büyükben for helping in editing
immunocytochemical images in the study. In addition, some parameters (MDA, GSH, NO levels) related to
oxidative stress in the study were presented in a congress called “lnternational Congress on Science and
Education 2019 (ICSE2019)” .
Authors’contributions: Ömer Hazman: Methodology, Investigation, Writing-Reviewing and Editing; Hatice
Evin: Investigation, Writing-Original draft preparation; Mehmet Fatih Bozkurt: Pathological analyses,
Page 20/29Visualization, Data curation, İbrahim Hakkı Ciğerci: Software, genotoxicity analysis, Validation.
References
1. Ferlay, J., M. Colombet, I. Soerjomataram, C. Mathers, D.M. Parkin, M. Piñeros, B. Znaor, and F. Bray.
2019. Estimating the global cancer incidence and mortality in 2018: GLOBOCAN sources and
methods. International Journal of Cancer 144, 1941-1953.
2. Dasari, S.,and P.B. Tchounwou. 2014. Cisplatinin cancer therapy: molecular mechanisms of Action.
European Journal of Pharmacology 740, 364-78.
3. Shu, X.L., C.B. Fan, B. Long, C.B. Fan, X. Zhou, and Y. Wang. 2016. The anti-cancer effects of cisplatin
on hepatic cancer are associated with modulation of miRNA-21 and miRNA-122 expression.
European Review For Medical And Pharmacological Sciences 20, 4459-4465.
4. Hazman, Ö., M.F. Bozkurt, A.F. Fidan, F. Erkan Uysal, and S. Çelik. 2018. The Effect of Boric Acid and
Borax on Oxidative Stress, In ammation, ER Stress and Apoptosis in Cisplatin Toxication and
Nephrotoxicity Developing as a Result of Toxication. In ammation 41, 1032-1048.
5. Zhu, X., Y. Tian, W. Zhang, T. Zhang, C. Guang, and M. Wanmeng. 2018. Recent developments related
to the biological production of Alfa Arbutin. Applied Microbiology and Biotechnology 102, 8145-
8152.
6. Funayama, M., H. Arakawa, R. Yamamoto, T. Nishino, T. Shin, and S. Murao. 1995. Effects of alpha
and beta arbutin on activity of tyrosinases from mushroom and mouse melanoma. Bioscience,
biotechnology and biochemistry 59, 143-4.
7. Shen, X., J. Wang, J. Wang, C. Zhenya, Y. Qipeng, and Y. Yajun. 2017. High-level De novo biosynthesis
of arbutin in engineered Escherichia coli. Metabolic Engineering Communications 42, 52-58.
8. Cheng, S.L., R.H. Liu, S. Jin-Nan, C. Shui-Tein, S. Supachok, and J.T. Gregory. 2007.
Toxicogenomicsof A375human malignant melanoma cells treated with Arbutin. Journal of
Biomedical Science 14, 87-105.
9. Nawarak, J., R. Huang-Liu, S.H. Kao, H.H Liao, S. Sinchaikul, S.T Chen, and S.L Cheng. 2009.
Proteomic analysis of A375 human malignant melanoma cells in response to arbutin treatment.
Biochim Biophys Acta1794, 159-67.
10. Hazman, Ö., A. Sarıova, M.F. Bozkurt, and İ. Hakkı Ciğerci. 2021. The anticarcinogen activity of β-
arbutin on MCF-7 cells: Stimulation of apoptosis through estrogen receptor-α signal pathway,
in ammation and genotoxicity. Molecular and Cellular Biochemistry 476, 349-360.
11. Miao, F., Y. Shi, Z.F. Fanı, S. Jiang, X. Shi-Zheng, and L. Tie-Chi. 2016. Deoxyarbutin Possesses a
Potent Skin-Lightening Capacity with No Discernible Cytotoxicity against Melanosomes. Public
Library of Science 11(10):e0165338.
12. Boissy, R.E., M. Visscher, and M.A. DeLong. 2005. DeoxyArbutin: a novel reversible tyrosinase
inhibitor with effective in vivo skin lightening potency.Experimental dermatology 8:601-8.
Page 21/2913. Hu, Z.M., Q. Zhou, T.C. Lei, S.F. Ding, and S.Z. Xu. 2009. Effects of hydroquinone and its glucoside
derivatives on melanogenesis and antioxidation: Biosafety as skin whitening agents. Journal of
Dermatological Science 55(3):179-84.
14. Nordlund, J.J., P.E. Grimes, and J.P. Ortonne. 2006. The safety of hydroquinone. Journal of the
European Academy of Dermatology and Venereology 20(7):781-7.
15. Westerhof, W., and T.J Kooyers. 2005. Hydroquinone and its analogues in dermatology-a potential
health risk. Journal of Cosmetic Dermatology 4:55–9.
16. Horita, M., D.H. Wang, K. Tsutsui, K. Sano, N. Masuoka, and S. Kira. 2005. Involvement of oxidative
stress in hydroquinone-induced cytotoxicity in catalase-deficient Escherichia coli mutants. Free
radical research 39:1035–41.
17. Levitt, J. 2007. The safety of hydroquinone: a dermatologist’s response to the 2006 Fedral Register.
Journal of the American Academy of Dermatology 57:854–72.
18. Jurica, K., I.B. Karačonji, V. Benković, and N. Kopjaret. 2017. In vitro assessment of the cytotoxic, DNA
damaging, and cytogenetic effects of hydroquinone in human peripheral blood lymphocytes.
Archives of Industrial Hygiene and Toxicology 68(4):322-335.
19. Deisinger, P.J., T.S. Hill, and J.C. English. 1996. Human exposure to naturally occurring Hydroquinone.
Journal of Toxicology And Environmental Health 47, 31-46.
20. SccsDegen, G.H. 2016. Opinion of the Scientific Committee on Consumer Safety (SCCS) Opinion on
the safety of the use of α-arbutin in cosmetic products. Regulatory Toxicology and Pharmacology 74,
75–76.
21. SccsDegen, G.H. 2015. Opinion of the Scientific Committee on Consumer Safety (SCCS) Opinion on
the safety of the use of β-arbutin in cosmetic products. Regulatory Toxicology and Pharmacology 73,
866–867.
22. Garcia-Jimenez, A., J.A. Teruel Puche, J. Berna, J.N. Rodriguez-Lopez, J. Tudela, and F.Garcia-
Canovas. 2017. The effect of tyrosinase on alpha and betaarbutin. Public Library of Science One 12,
e0177330.
23. Sugimoto, K., T. Nishimura, K. Nomura. K. Sugimoto, and T. Kuriki. 2003. Syntheses of arbutin-alpha-
glycosides and a comparison of their inhibitory effects with those of alpha-arbutin and arbutin on
human tyrosinase. Chemical & Pharmaceutical Bulletin 51(7):798-801.
24. Ersin, G., S. Çelik, S.S. Ulasli, A. Özyürek, Ö. Hazman, S. Günay, M. Özdemir, and M. Ünlü. 2016.
Comparison of the Anti-in ammatory Effects of Proanthocyanidin, Quercetin, and Damnacanthal on
Benzo(a)pyrene Exposed A549 Alveolar Cell Line. In ammation 39, 744-51.
25. Singh, N.P., M.T. McCoy, R.R. Tice, and E.L. Schneider. 1988. A simple technique for quantitation of
low levels of DNA damage in individual cells. Experimental Cell Research 175, 184–191.
26. Fenech, M. 2000. The in vitro micronucleus technique. Mutation research 455,81–95.
27. Hazman, Ö., L. Aksoy, and A. Büyükben. 2016. Effects of crocin on experimental obesity and type-2
diabetes. Turkish Journal of Medical Sciences 46(5):1593-1602.
Page 22/29You can also read