Genetic diversity analysis of brown marmorated stink bug, Halyomorpha halys based on mitochondrial COI and COII haplotypes - BMC Genomic Data
←
→
Page content transcription
If your browser does not render page correctly, please read the page content below
Yan et al. BMC Genomic Data       (2021) 22:7
https://doi.org/10.1186/s12863-021-00961-8
                                                                                                                                 BMC Genomic Data

 RESEARCH ARTICLE                                                                                                                                   Open Access

Genetic diversity analysis of brown
marmorated stink bug, Halyomorpha halys
based on mitochondrial COI and COII
haplotypes
Juncong Yan1, Chandan Pal1, Diane Anderson2, Gábor Vétek3ˆ, Péter Farkas3, Allan Burne4, Qing-Hai Fan1,
Jinping Zhang5, Disna N. Gunawardana1, Rebijith Kayattukandy Balan1, Sherly George1 and Dongmei Li1*

  Abstract
  Background: In the past decade, the brown marmorated stink bug (BMSB), Halyomorpha halys (Hemiptera:
  Pentatomidae) has caused extensive damage to global agriculture. As a high-risk pest for many countries, including
  New Zealand, it is important to explore its genetic diversity to enhance our knowledge and devise management
  strategies for BMSB populations. In this study, two mitochondrial genes, Cytochrome c oxidase I (COI) and
  Cytochrome c oxidase II (COII) were used to explore the genetic diversity among 463 BMSB individuals collected
  from 12 countries.
  Result: In total, 51 COI and 29 COII haplotypes of BMSB were found, which formed 59 combined haplotypes (5
  reported and 54 novel). Of these, H1h1 was the predominant haplotype. The haplotype diversity (Hd) and
  nucleotide diversity (π) were high while the neutrality (Fu’s Fs) values were negative for the BMSB populations in
  the native countries, China, and Japan. For the BMSB populations from the invaded countries, the Fu’s Fs values
  were negative for populations from Chile, Georgia, Hungary, Italy, Romania, Turkey, and USA, indicating that those
  populations are under demographic expansion. In comparison, the Fu’s Fs values were positive for the populations
  from Austria, Serbia, and Slovenia, revealing a potential population bottleneck. Analysis of molecular variance
  (AMOVA) suggested that significant genetic difference exists among the BMSB populations from China, Japan, and
  the invasive countries.
  Conclusion: This study revealed that the haplotype diversity of the BMSB populations was high in those two
  studied countries where BMSB is native to (China and Japan) but low in those countries which have been invaded
  by the species. The analysis indicated that multiple invasions of BMSB occurred in Europe and the USA. The study
  also revealed three ancestral lines and most of the novel haplotypes were evolved from them. Moreover, we
  observed two genetic clusters in the invasive populations that are formed during different invasion events. Our
  study provided a comprehensive overview on the global haplotypes distribution thus expanding the existing
  (Continued on next page)

* Correspondence: dongmei.li@mpi.govt.nz
1
 Plant Health and Environment Laboratory, Ministry for Primary Industries, PO
Box 2095, Auckland 1140, New Zealand
Full list of author information is available at the end of the article

                                        © The Author(s). 2021 Open Access This article is licensed under a Creative Commons Attribution 4.0 International License,
                                        which permits use, sharing, adaptation, distribution and reproduction in any medium or format, as long as you give
                                        appropriate credit to the original author(s) and the source, provide a link to the Creative Commons licence, and indicate if
                                        changes were made. The images or other third party material in this article are included in the article's Creative Commons
                                        licence, unless indicated otherwise in a credit line to the material. If material is not included in the article's Creative Commons
                                        licence and your intended use is not permitted by statutory regulation or exceeds the permitted use, you will need to obtain
                                        permission directly from the copyright holder. To view a copy of this licence, visit http://creativecommons.org/licenses/by/4.0/.
                                        The Creative Commons Public Domain Dedication waiver (http://creativecommons.org/publicdomain/zero/1.0/) applies to the
                                        data made available in this article, unless otherwise stated in a credit line to the data.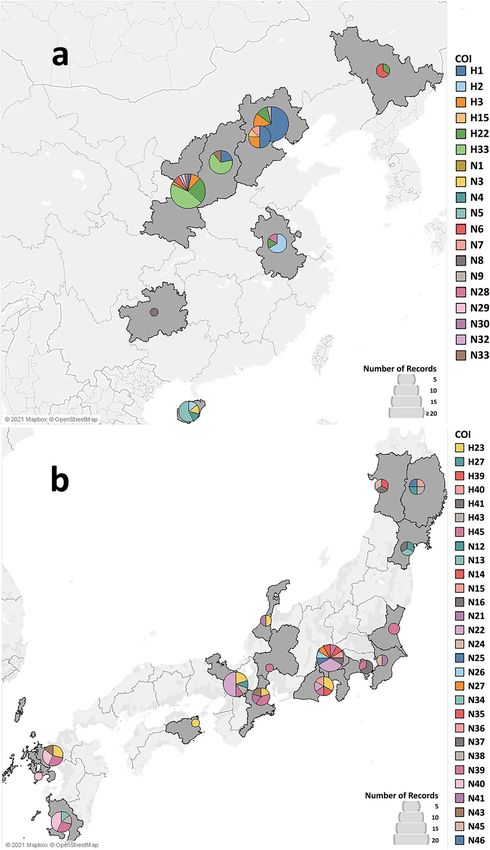
Yan et al. BMC Genomic Data       (2021) 22:7                                                               Page 2 of 16

 (Continued from previous page)
 knowledge on BMSB genetic diversity that potentially could play an important role in formulating feasible pest
 management strategies.
 Keywords: BMSB, Invasion, Mitochondrial DNA, Nucleotide diversity, Haplotype diversity, Pathway

Background                                                     Mitochondrial DNA (mtDNA) sequence analysis is
Brown marmorated stink bug (BMSB), Halyomorpha               one of the most widely used methods to examine genetic
halys (Stål, 1855) (Hemiptera: Pentatomidae) is a highly     diversity and determine the locality of origin of an inva-
polyphagous insect, which feeds on more than 300 host        sive species [27], and has been applied in a number of
plants [1, 2]. BMSB has been causing extensive damage        studies for BMSB [13, 20, 28–30]. Previous studies on
to a wide variety of agricultural crops and poses a global   BMSB populations from Asia and the USA have se-
economic threat for agricultural and horticultural indus-    quenced the mitochondrial Cytochrome Oxidase II
try [3, 4]. As per 2010 reports, the economic losses         (COII) and the ribosomal 12S genes to trace the origin
caused by BMSB valued more than 37 million USD in            of the invading BMSB populations in the USA [27].
North America [5]. BMSB is capable of long-distance          Additional studies, focusing on BMSB populations in
flight as well as local walking dispersal during the grow-   Europe, used Cytochrome Oxidase I (COI) gene alone
ing season [6, 7]. They are also considered nuisance         [13], or in combination with the COII gene [20, 30], and
pests as adults search for human-made structures to          revealed additional information on the genetic diversity
overwinter and discharge an unpleasant and long-lasting      of BMSB [13, 31]. To expand the knowledge on the gen-
odor once disturbed [8].                                     etic diversity of BMSB populations around the world, we
   BMSB is native to China (including Taiwan), Japan         collected BMSB adult specimens from different geo-
and the Korean peninsula [9–11] and has invaded 30           graphical locations, including the countries where BMSB
countries [12] including most of the states in the USA       is native to, China and Japan and the countries which
[4, 5], Canada [13], many countries in Europe [13–20]        have been invaded by the pest, such as the USA, Chile,
and Chile [21]. Climate modelling predicted that New         and several European countries. In the current study,
Zealand at high risk for BMSB establishment should a         two mitochondrial barcoding genes, COI and COII, were
successful invasion occur [22, 23]. The climatic suitabil-   sequenced from 463 BMSB specimens collected from 43
ity of this species is wide, ranging from 30 to 50 degrees   regions/provinces in 12 countries (2 native and 10 in-
of latitude, with an annual mean temperature range be-       vaded) across four different continents to develop new
tween 10 °C and 30 °C (NOAA-CIRES Climate Diagnos-           insights into BMSB genetic diversity and their potential
tics Center, Boulder, Colorado). It covers wide              pathways of invasion.
geographical regions including northern Europe, north
eastern part of North America, southern Australia, and       Results
the North Island of New Zealand [22, 23]. BMSB has in-       COI and COII haplotypes in the BMSB populations
creasingly been intercepted at the border and post-          A total of 441 COI sequences (657 bp each) were ob-
border scenarios due to the rise of international travel     tained from 463 BMSB individuals collected from the 12
and trade [24] since 2005 when BMSB was first inter-         countries (Additional file 1). We identified 51 haplotypes
cepted at the border of New Zealand [25]. BMSB is con-       using COI, consisting of 36 newly identified and 15 pre-
sidered as “high risk” organism, and there were 1620         viously reported haplotypes (Additional file 2). For the
recorded interceptions of BMSB at the border of New          sequences sharing 100% identity in the same region
Zealand since 2005 (accessed in June 2020) [25]. As agri-    (657 bp) with those previously reported, the same haplo-
cultural exports comprise a significant proportion of the    type names were given while new names were given
New Zealand Gross Domestic Product (GDP), the estab-         accordingly for the rest of the sequences obtained in this
lishment of the pest would be highly detrimental to the      study. All the new haplotypes identified were confirmed
country. The study by New Zealand Institute of Eco-          by BLASTn search [32]. The result showed that all the
nomic Research (NZIER) predicts a worst-case scenario        new haplotypes were unique in the COI region (657 bp).
of 3.6 billion New Zealand dollars in agricultural losses    Further analysis showed that the haplotype N22 shared
by 2038 if BMSB successfully establishes in New Zealand      the same sequences with two shorter reference se-
[26]. Therefore, it is imperative to study the genetic di-   quences, KY710432 (651 bp) and KY710450 (648 bp).
versity of BMSB to trace the origin of captured individ-     However, it is not clear whether the missing bases from
uals to better manage the border biosecurity risks and       the two reference sequences are the same or different
predict the pathways for trade.                              from the sequence we obtained, thus the sequence was
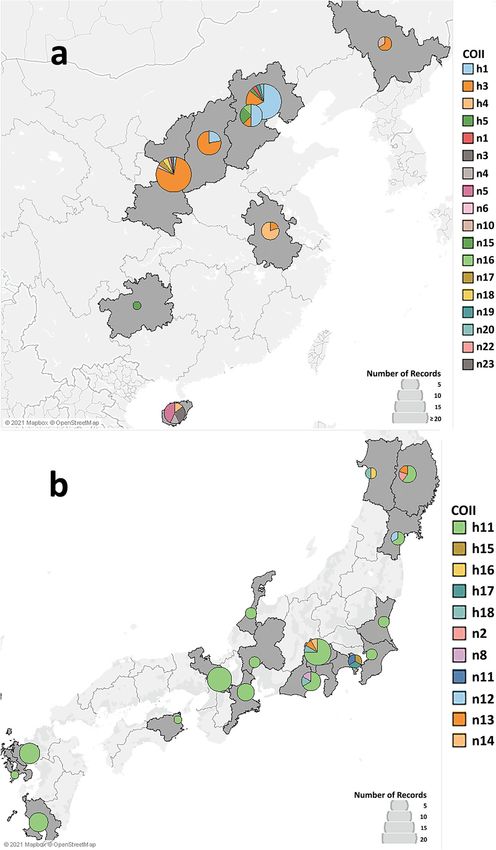
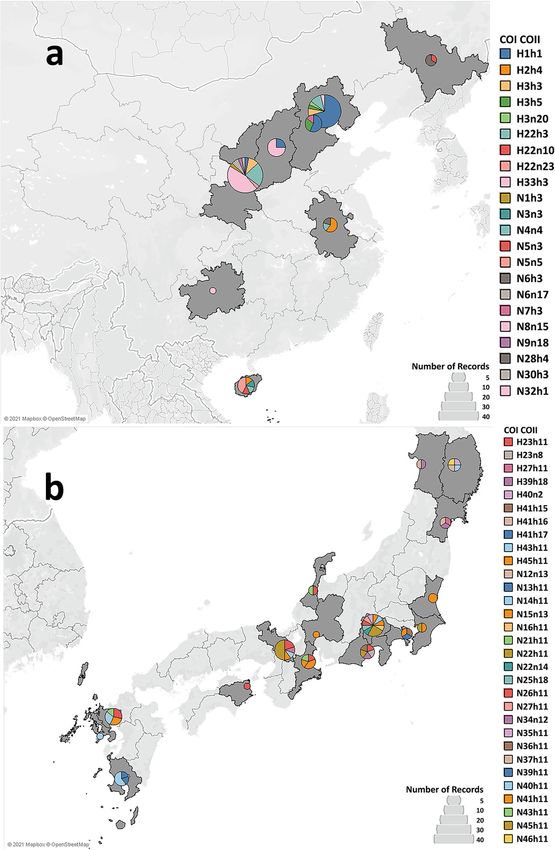
Yan et al. BMC Genomic Data        (2021) 22:7                                                                                       Page 3 of 16

 Fig. 1 Geographical distribution of mtDNA COI haplotypes (657 bp fragment of the COI) of BMSB in native countries - (a) China, and (b) Japan.
 Provinces where BMSB was collected from are shaded in grey. The size of pie is proportional to the frequency of haplotypes. Each colour
 represents a different haplotype. The figure was generated using Tableau 2019 (https://www.tableau.com/) [34]
Yan et al. BMC Genomic Data        (2021) 22:7                                                                                       Page 4 of 16

 Fig. 2 Geographical distribution of mtDNA COII haplotypes (518 bp fragment of the COII gene) of BMSB in native countries in the current study –
 (a) China, and (b) Japan. Regions where BMSB was collected from are shaded in grey. The size of pie is proportional to the frequency of
 haplotypes. Each colour represents a different haplotype. The figure was generated using Tableau 2019 (https://www.tableau.com/) [34]
Yan et al. BMC Genomic Data        (2021) 22:7                                                                          Page 5 of 16

considered as a new haplotype. The analysis also indi-            detected in Austria. The newly identified haplotypes
cated that it might not be accurate to assign the same            were mainly observed in the native countries (Fig. 1a for
haplotype name for the sequence with different length.            China and Fig. 1b for Japan) except N47 in Slovenia
   There are three Barcode Index Numbers (BINs) for               (Additional file 2). All the novel COI and COII haplo-
the COI sequences of BMSB specimens submitted in                  types identified were detected from the two native coun-
Barcode of Life Data System (BOLD) [33]: BIN                      tries, China (Figs. 1 and 2a) and Japan (Figs. 1 and 2b).
AAM9563 (containing 682 sequences), ADT6053 (one                    Overall, high haplotype diversity was observed in
sequence) and AAK5312 (six sequences). Further com-               China. The main haplotypes from China were H1, H33,
parison with those COI sequences in BOLD showed that              H22, H3 for COI and h3 and h1 for COII (Table 1). The
all the sequences obtained in this study belong to BIN            predominant haplotypes from Japan were H23, H45,
AAM9563, with over 98% identity. In contrast, the se-             N22, N40 for COI and h11 for COII (Table 1). Outside
quences shared over 94 and 82% identity to the se-                of the native regions, low haplotype diversity was ob-
quences of two other BINs, ADT6053 and AAK5312,                   served, and H1, H3 for COI, h1, h3 for COII were the
respectively.                                                     main haplotypes detected in those countries. Only one
   A total of 450 COII sequences (518 bp) were obtained           haplotype of each (H1 and h1) was detected in Georgia,
from the 463 BMSB individuals (Additional file 1), which          Romania, Turkey and the USA (Table 1).
formed 29 haplotypes including 20 novel and 9 previ-
ously reported (Additional file 2). BLASTn search [32]            COI-COII combined haplotypes of the BMSB populations
showed that the new haplotypes did not share any iden-            In total, 428 individuals were identified with both COI
tical sequences in the 518 bp overlap COII region with            and COII sequences (Additional file 1), and thus used
that of the previous reported sequences.                          for COI-COII combined haplotype analysis. The com-
   The geographical distribution of the identified COI            bined COI-COII haplotype analysis produced 59 haplo-
and COII haplotypes are shown in Figs. 1 and 2. Of the            types, in which only five were previously reported and
identified haplotypes, H1 (61.9% of the total individuals)        54 were novel (Additional file 2). All these newly identi-
and h1 (61.7% of the total individuals) were predominant          fied haplotypes were detected in China and Japan except
for COI and COII, respectively, and were detected in all          a single haplotype in Slovenia (N47h3). The predomin-
the countries studied except Japan (Table 1 and                   ant haplotype H1h1 (62.6%) was observed in all the
Additional file 2). Haplotypes H3 (7% of the total indi-          countries except Japan (Additional file 2). The geograph-
viduals) and h3 (16% of the total individuals) were the           ical distribution of the identified COI-COII combined
second most predominant haplotypes detected in China,             haplotypes is shown in Fig. 3. In the native countries of
Austria, Chile, Hungary, Italy, Serbia, and Slovenia. In          BMSB, high haplotype diversity was observed with 24
addition, haplotypes H8 and H48 for COI were only                 haplotypes in China (Fig. 3a) and 32 in Japan (Fig. 3b),

Table 1 Percentage (%) of the dominant mtDNA COI and COII haplotypes of H. halys detected in the studied countries. The COI
haplotypes are named in uppercase letters. The haplotype names with a prefix ‘H’ represent the previously reported haplotypes
while those with ‘N’ are the newly detected haplotypes identified in this study. The percentages of the individuals for each
dominant haplotype in the country are listed in the table
Country         COI                                                                                     COII
                H1            H3        H22      H33       H23        H45         N22        N40        h1         h3           h11
China           28            10        14       22        –          –           –          –          26         46           –
Japan           –             –         –        –         16         16          14         9          –          –            81
Austria         25            50        –        –         –          –           –          –          20         67           –
Serbia          50            50        –        –         –          –           –          –          44         56           –
Slovenia        69            25        –        –         –          –           –          –          67         33           –
Chile           97            3         –        –         –          –           –          –          97         3            –
Georgia         100           –         –        –         –          –           –          –          100        –            –
Hungary         93            5         –        –         –          –           –          –          94         4            –
Italy           96            4         –        –         –          –           –          –          93         7            –
Romania         100           –         –        –         –          –           –          –          100        –            –
Turkey          100           –         –        –         –          –           –          –          100        –            –
USA             100           –         –        –         –          –           –          –          100        –            –
Yan et al. BMC Genomic Data (2021) 22:7 Page 6 of 16 Fig. 3 Geographical distribution of mtDNA COICOII haplotypes (1175 bp fragment) of BMSB in native countries in the current study, (a) China, and (b) Japan. Provinces where BMSB was collected from are shaded in grey. COI-COII combined haplotypes were formed by combing COI and COII haplotypes. The size of pie is proportional to the frequency of haplotypes. Each colour represents a different haplotype. The figure was generated using Tableau 2019 (https://www.tableau.com/) [34] with no haplotypes shared between the two countries with an individual from Hungary (Additional file 2). (Additional file 2 and Fig. 3). In comparison, out of the Similarly, 22 out of 24 haplotypes detected in China 32 haplotypes identified in Japan, 31 were uniquely de- were unique, and two haplotypes (H1h1 and H3h3) were tected in Japan, and one haplotype, H41h15 was shared also predominantly shared with the BMSB samples from
Yan et al. BMC Genomic Data (2021) 22:7 Page 7 of 16
those invaded countries (Additional file 2). In the in- The AMOVA (Analysis of molecular variance) showed
vaded countries, H1h1 was the predominant haplotype, that the genetic variation among the 12 populations
identified in more than 90% of the studied samples from contributed 71.26% while variation within population
most of the BMSB-invaded countries, including Chile, contributed 28.74%. The overall FST value was 0.71 (p <
Georgia, Hungary, Italy, Romania, Turkey and the USA 0.05), indicating that the genetic variation among popu-
(Additional file 2). lations was high.
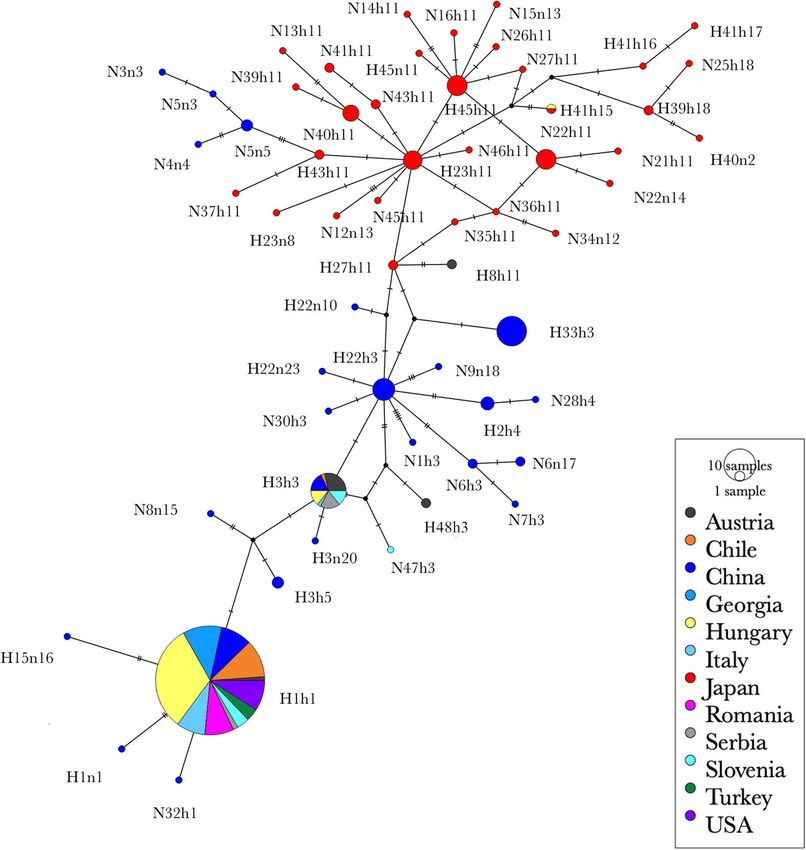
The haplotype network of the BMSB individuals fur-
Population genetic analysis based on the combined ther revealed the widespread occurrence of H1h1 and
haplotypes of COI and COII H3h3, except the populations from Japan, whereas all
Japan and China had the highest haplotype diversity the other haplotypes were mainly detected in the native
(Hd), with Hd values of 0.942 and 0.858, and nucleotide countries (Fig. 5). The analyses showed that there were
diversity (π) values of 0.00238 and 0.00327, respectively three ancestral lines found in this study namely h1, h3
(Table 2). Outside of the native regions of BMSB, the and h11. Most of the other haplotypes mutated from
highest haplotype diversity was observed in Austria these three lines with differences of several base pairs.
(Hd = 0.686, π = 0.00206), Serbia (Hd = 0.556, π = Moreover, an interesting phenomenon was observed that
0.00095) and Slovenia (Hd = 0.514, π = 0.00115). In con- some haplotypes (N3n3, N5n3, N4n4, N5n5) detected
trast, little to no haplotype diversity was observed in the only in the Hainan population (China) was highly iso-
BMSB samples collected from Chile, Georgia, Hungary, lated and closer to Japanese populations rather than to
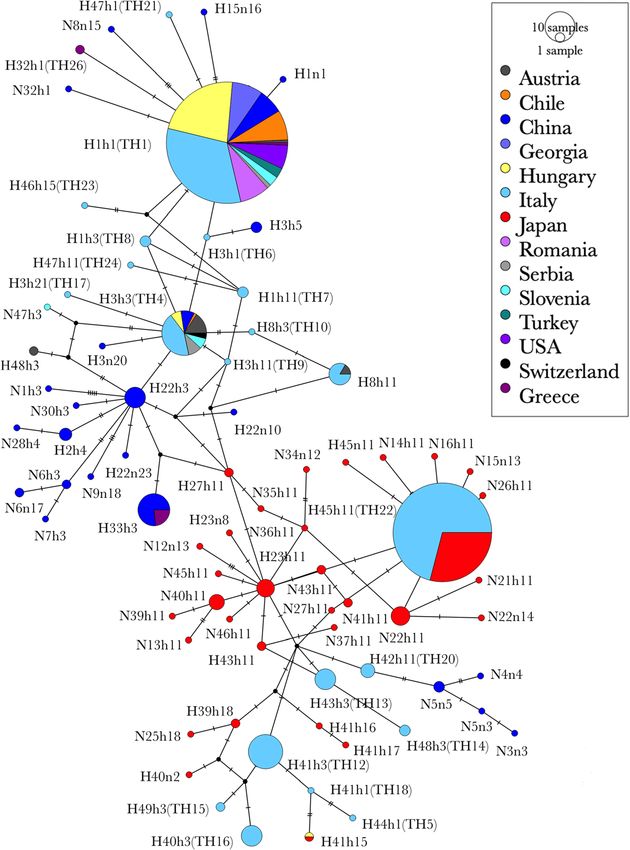
Italy, Romania, Turkey and the USA. Therefore, two Chinese populations. To further explore the distribution
genetic groups were defined based on the Hd values ob- of those haplotypes, the combined COI and COII dataset
tained from the haplotype analysis: group A (Chile, from the present and previous studies [20, 30] were ana-
Georgia, Hungary, Italy, Romania, Turkey and the USA) lysed together and resulted in a total of 80 haplotypes.
and group B (Austria, Serbia and Slovenia). It is note- The haplotype network analysis (Fig. 6) indicated similar
worthy that in Hungary five sampling sites were studied, genetic relationships as previously reported except that a
of which at two sites no haplotype diversity was ob- few BMSB specimens from Italy had close relationship
served, while the other three sites showed variable diver- with Japanese populations (Fig. 6).
sity with an Hd value from 0.038 to 0.5 and a π value
from 0.00085 to 0.0017036, with an overall Hd value of Discussion
0.107 and a π value of 0.00028. This indicates that the This study revealed 51 COI haplotypes (36 novel) and
invasion of BMSB in Hungary may have come from gen- 29 COII haplotypes (20 novel) from 463 BMSB individ-
etically distinct populations. uals of 12 countries. However, most of these haplotypes
In the neutrality test, the Fu’s Fs statistic values were (80%) were detected only once (Table 1 and Additional
very low in the two native countries of BMSB, China file 2), indicating that these new haplotypes are less
and Japan, with − 7.852 (p < 0.02) and − 29.707 (p < 0.02) abundant in the populations we studied. The haplotype
(Table 2) while for the BMSB-invaded countries, Fu’s Fs analysis of mtDNA sequences of the BMSB populations
statistic value was − 1.174 (p < 0.02) for group A (Chile, from 12 countries provided genetic information for the
Georgia, Hungary, Italy, Romania, Turkey and the USA) identification of the pathways of invasion and the pos-
suggesting that group A was under population expan- sible sources of origin.
sion. In comparison, the haplotype diversity was slightly In terms of haplotype distribution, the predominant
higher with an average of 0.63 for group B (Austria, COII haplotypes for Beijing (China), Shaanxi (China),
Serbia, and Slovenia), but with Fu’s Fs values of 1.453 Japan and the USA were h1 (67.8%), h3 (75%), h11
(p > 10), indicating that group B was under bottleneck. (81.1%) and h1 (100%). Xu et al. [29] made a similar
The Principle Coordinates analysis (PCoA) using the conclusion that the major COII haplotypes for Beijing
FST values showed that there were at least three popula- (China) and Shaanxi (China), and Japan and the USA
tion clusters, namely China, Japan and group A (Chile, were h1 (50%), h3 (100%), h11 (38%) and h1 (100%). Lee
Georgia, Hungary, Italy, Romania, Turkey and the USA) et al. [28] identified COI haplotype H1 as the main COI
(Fig. 4, Additional file 3). The recent invasion in Slovenia haplotype for China (68%), Hungary (98.8%), Italy (80%)
showed genetic similarities to those from Hebei and and the USA (92.5%). Similarly, this current study identi-
Beijing provinces of China (Fig. 4). The BMSB popula- fied haplotype H1 as the predominant one, accounting
tions from Austria and Serbia were also closely related for 27.6% of the Chinese samples, 93.4% of the
to the Chinese populations of Shanxi and Anhui. The Hungarian samples, 95.8% of the Italian samples, and all
population from the Chinese province of Hainan also samples from the USA. The percentage of each haplo-
showed close relationship with a population from the type in those countries varies slightly between the
Japanese province of Akita. current and previous studies, which is likely due to theYan et al. BMC Genomic Data (2021) 22:7 Page 8 of 16
Table 2 The sample information and mtDNA diversity. The total sample size (N) for each province and country is listed. The number
of haplotypes (Hn), haplotype diversity (Hd) and nucleotide diversity (π) were calculated based on the combined haplotypes of COI
and COII. Two genetic groups were identified based on the COI and COII diversity from invaded populations. The genetic group A
comprises Chile, Georgia, Hungary, Italy, Romania, Turkey, and the USA. The genetic group B comprises Austria, Serbia, and Slovenia.
The analysis was conducted for each population, the populations from each country and each genetic group. Asterisk (*) represents
statistically significant difference (p < 0.02)
Country Province N Hn Hd π Fu’s Fs
China Anhui 5 3 0.7 0.00102
Beijing 27 7 0.553 0.00113
Hainan 7 5 0.857 0.00284
Hebei 8 4 0.75 0.00225
Jiling 3 2 0.667 0.00227
Shannxi 31 9 0.751 0.00205
Shanxi 8 2 0.429 0.00182
Guizhou 1 1 NA NA
Combined 90 24 0.858 0.00327 −7.852*
Japan Akita 2 2 1 0.0017
Chiba 2 2 1 0.0017
Gifu 1 1 NA NA
Ibaraki 2 1 0 0
Ishikawa 2 2 1 0.00255
Iwate 4 4 1 0.00426
Kagoshima 5 3 0.7 0.00102
Kanagawa 3 3 1 0.00454
Kyoto 10 5 0.756 0.00127
Mie 5 4 0.9 0.00136
Miyagi 3 3 1 0.0034
Nagasaki 1 1 NA NA
Saga 7 4 0.857 0.00105
Shizuoka 5 5 1 0.00221
Tokushima 1 1 NA NA
Yamanashi 12 10 0.955 0.00253
Combined 65 32 0.942 0.00238 −29.707*
Serbia Senta 9 2 0.556 0.00095 2.302
Slovenia Ljubljana 15 3 0.514 0.00115 1.626
Austria Vienna 15 4 0.686 0.00206 1.84
Turkey Arhavi 11 1 0 0 0
the USA Maryland 15 1 0 0
West Virginia 9 1 0 0
Combined 24 1 0 0 0
Georgia Eki 28 1 0 0
Samegrelo 3 1 0 0
Combined 31 1 0 0 0
Hungary Budapest 61 3 0.038 0
Debrecen 10 1 0 0
Pécs 6 1 0 0.00085
Szeged 2 2 0.5 0.00136Yan et al. BMC Genomic Data (2021) 22:7 Page 9 of 16
Table 2 The sample information and mtDNA diversity. The total sample size (N) for each province and country is listed. The number
of haplotypes (Hn), haplotype diversity (Hd) and nucleotide diversity (π) were calculated based on the combined haplotypes of COI
and COII. Two genetic groups were identified based on the COI and COII diversity from invaded populations. The genetic group A
comprises Chile, Georgia, Hungary, Italy, Romania, Turkey, and the USA. The genetic group B comprises Austria, Serbia, and Slovenia.
The analysis was conducted for each population, the populations from each country and each genetic group. Asterisk (*) represents
statistically significant difference (p < 0.02) (Continued)
Country Province N Hn Hd π Fu’s Fs
Szombathely 11 3 0.345 0
Combined 90 3 0.107 0.00028 −0.195*
Italy Codroipo (UD) 4 1 0 0
Mantova 2 1 0 NA
Pozzuolo del Friuli (UD) 17 1 0 0
Trentino Alto 1 1 NA 0
Combined 24 2 0.083 0.00014 −0.192
Romania Bucharest 23 1 0 0 0
Chile Santiago 31 2 0.065 −0.426
Group A 234 3 0.059 0.00045 −1.174*
Group B 39 5 0.63 0.00158 1.453
differences in the sample size. On the other hand, some that the BMSB populations in Italy had genetic related-
divergences were also observed between the current and ness to Japanese populations, sharing the same haplo-
previous studies. For example, COII haplotype h14 was type H45h11 (TH22). It has been shown that the
identified as the predominant haplotype (33%) in the predominant haplotypes, such as H1h1 and H3h3, found
Japanese population in Xu’s study [29] but was not de- in Italy were also widespread in China, the USA, and
tected in this study (Additional file 2). Variations in the other European countries [20, 30]. Therefore, it can be
haplotype numbers and percentages between the current hypothesised that the BMSB populations in Italy possibly
study and that of Cesari et al. [30] were also observed. have originated from Asia, which can be supported by
Cesari et al. [30] reported a total of 26 COI and COII the extensive, ongoing cross-border travel and trade
combined haplotypes for BMSB specimens, mainly from between Asia and Italy. However, invasion from North
Italy [30]. In contrast, only five haplotypes [H1h1 (TH1), America cannot be ruled out as H1h1 was found also in
H3h3 (TH4), H33h3 (TH25), H8h11 (TH11) and the USA. Furthermore, haplotype H8 was detected in
H45h11 (TH22)] were detected in our study, thus, the Switzerland [13] in 2012, in France [31] and Northern
total number of known BMSB COI and COII combined Italy in 2013 [20], suggesting the possible invasion of
haplotypes (both known and novel) has increased to 80 BMSB to Italy was from Switzerland [30] based on the
known so far. Cesari et al. [30] included relatively large geographical proximity. The detection of the same
number of samples from Italy (209 samples from 10 re- haplotype of H8 in Austria in the current study raised
gions) and identified 22 unique COI and COII combined the possibility that the invasion in Austria might
haplotypes. Our study was unable to identify any add- have originated from the neighbouring countries of
itional COI and COII combined haplotypes beside the Switzerland or Italy as they share borders. However, the
common ones (H1h1, H3h3) in Italy due to the small widespread distribution of H1 and H3 haplotypes in
sample size (24 samples from 3 locations) studied. How- Austria (Table 1) opens the likelihood of invasion from
ever, there were five shared haplotypes [H1h1 (TH1), China as well.
H3h3 (TH4), H33h3 (TH25), H8h11 (TH11) and The combined data for COI and COII led to the ob-
H45h11 (TH22)] among the samples studied here and servation of several ancestral lineages, including h1
by Cesari et al. [30]. Of these, the first two haplotypes (H1h1), h3 (H3h3, H22h3, H33h3) and h11 lines
were the two most common haplotypes. Interestingly, (H45h11, N22h11, N40 h11). The haplotype networks
the last 3 haplotypes [H33h3 (TH25), H8h11 (TH11) support that most of the less abundant haplotypes were
and H45h11 (TH22)] detected in Italy by Cesari et al. possibly evolved from these lines.
[30] were also detected in this study from China, The haplotype diversity of BMSB from the native re-
Austria, and Japan. After combining the haplotype data gions is much higher than that of the invaded popula-
from the two studies, haplotype network (Fig. 6) revealed tions. The haplotype diversity (Hd) of BMSB populationsYan et al. BMC Genomic Data (2021) 22:7 Page 10 of 16 Fig. 4 Principal Coordinates Analysis (PCoA) plot based on population pairwise genetic distances. The points from Austria, Chile, Georgia, Hungary, Italy, Romania, Serbia, Slovenia, Turkey and the USA represent the samples collected from one country while the points from China and Japan represent the samples collected from one province. The colour represents the countries where the samples were collected from. The provinces are labelled with name tags. The X axis is the value of Coord.1 while Y axis is the value of Coord.2. Percentage of variation explained by coord.1, Coord.2 was 43.39 and 12.99%, respectively. The figure was generated using Tableau 2019 (https://www.tableau.com/) [34] from China and Japan was 0.858 and 0.942, respectively, by themselves except populations from regions of Akita which clearly indicates that the genetic diversity of these (JP) and Hainan (CN). This phenomenon was also found two populations was much higher than that of the most in Zhu’s study [35] that the BMSB from Hainan and of the BMSB populations in the invaded countries (Hd < Japan were in the same clade. 0.182). This conclusion agreed with the observations The PCoA also revealed that the genetic group A (Chile, from the study by Xu et al. [29]. Another interesting re- Georgia, Hungary, Italy, Romania, Turkey, and the USA) sult from our study was the absence of shared haplo- could have become a relatively independent genetic group. types from the two neighbouring native countries of The neutrality test supported this, where the Fu’s Fs value BMSB, China and Japan, which was congruent with of the genetic group A (− 1.174, p < 0.02) was negative as previous studies [20, 29]. The haplotype network that of the ancestral Chinese (− 7.852, p < 0.02) and highlighted that China and Japan had their own haplo- Japanese populations (− 29.707, p < 0.02), indicating that type clusters, suggesting that there is limited or no inter- the populations belong to genetic group A could have breeding, probably the geographical barriers of the strait been under population expansion stage [35]. The relatively restricted gene flow among populations. It is also pos- low differences in FST values between the populations sible that China and Japan have put in place a strict within the genetic group A indicate that these populations quarantine inspection for BMSB to prevent human- could have originated from the same ancestral line. The mediated transportation with current intensive trade ac- close genetic relatedness among the BMSB populations tivities. As a result, these BMSB populations could have from Chile, Georgia, Hungary, Italy, Romania and Turkey been evolving independently. The Principal Coordinates with the USA populations suggests that the late detection Analysis also supported this conclusion, in which, most in those European countries might have originated from of the Japanese and Chinese populations were clustered the USA. This also aligns well with the past invasion
Yan et al. BMC Genomic Data        (2021) 22:7                                                                                       Page 11 of 16

 Fig. 5 Haplotype network derived from the TCS analysis using COI-COII combined haplotypes (1175 bp fragment) of BMSB around the world.
 Each pie represents one haplotype with the haplotype name next to it. The size of pie is proportional to the frequency of haplotypes. The colour
 represents the countries where the samples were collected from. The tick marker on each line represents a base pair difference. The figure was
 constructed based on the combined COI and COII haplotypes obtained in the current study

history of BMSB, where BMSB was first detected in the                      [38]. The haplotype diversity (Hd) and nucleotide diversity
USA in mid-90s, and then spread throughout the country.                    (π) of these three populations in group B were higher than
Ten years after establishing in the USA, BMSB was de-                      0.5 and 0.001, respectively, implying that these countries
tected in Switzerland in 2007 [36], then spread in Europe                  have been invaded multiple times by BMSB from different
[14–19, 37] and Chile [21] recently. This study further                    origins.
suggested the secondary invasion from the USA to the                         This study further revealed that the predominantly
European countries such as Georgia, Hungary, Italy,                        common haplotypes H1h1 and H3h3 exist in China and
Romania and Turkey, and to Chile. In contrast, the popu-                   the invaded countries. The reasons for this need further
lations of the genetic group B (Austria, Serbia and                        investigation, though one possibility could be due to the
Slovenia) were clustered with the Chinese populations,                     dominant distribution of these haplotypes in Asia, and
but were genetically distant from the group A, indicating                  thus they have higher chances to be transported pas-
that these populations in group B originated from a differ-                sively to other regions. It is not clear whether there is a
ent pedigree line or genetic group. The neutrality test’s                  possibility that these BMSB haplotypes can adapt more
Fu’s Fs value of genetic group B was positive (1.453, p >                  easily to new environments than other haplotypes. Since
10), which is consistent with the more recent detection of                 the COI and COII haplotype analyses are only based on
BMSB in these locations as the positive Fs indicated that                  the information from the female lineages, further study
these populations were under a population bottleneck                       on the genomic level using high-throughput sequencing
Yan et al. BMC Genomic Data        (2021) 22:7                                                                                       Page 12 of 16

 Fig. 6 Haplotype network derived from the TCS analysis using COI-COII combined haplotypes (1175 bp fragment) of BMSB around the world.
 Each circle represents one kind of haplotype. The size of the circle represents the frequency of each haplotype. The colour represents the
 countries where the samples were collected. The tick marker on each line represents a base pair difference. The figure was constructed based on
 the haplotypes obtained in the current study and those from the study of Cesari et al. [30]. The haplotypes obtained from Cesari et al. [30] are
 labelled with TH

techniques might be able to provide more information                       probably at least partially due to international trade and
on the genetic diversity of the BMSB populations and                       travel. BMSB populations from the invaded countries,
may help clarify the past invasion scenarios in the                        such as Chile, Georgia, Hungary, Italy, Romania, Turkey,
future.                                                                    and the USA were genetically close, but well separated
                                                                           from the Chinese populations. However, the BMSB pop-
Conclusions                                                                ulations from Austria, Serbia and Slovenia were more
The present study has revealed genetic diversity among                     closely related to the Chinese populations. The results
BMSB populations using combined COI and COII data-                         indicated that some individuals of the recent invasions
sets and provided better understanding of their potential                  into Chile, Hungary, Georgia, Turkey, Romania and Italy
invasion pathways. The genetic diversity among the                         potentially originated from the USA without ignoring
BMSB populations from the native regions was much                          the likely chances of possible invasions from China due
higher than those from the BMSB-invaded countries.                         to the presence of the ancestral predominant haplotype
The haplotype analysis further indicated that the inva-                    H1h1. Moreover, the BMSB populations from Austria,
sion of BMSB has occurred multiple times in the past,                      Serbia and Slovenia were possibly of recent invasions
Yan et al. BMC Genomic Data (2021) 22:7 Page 13 of 16
from China. In conclusion, we believe that the novel product was evaluated on 1% agarose gel against a 100 bp
haplotype information and the genetic diversity among DNA ladder (Invitrogen™) in TAE buffer stained with SYBR
the global BMSB populations will lay down the founda- safe (Life Technologies) and visualised using a Gel Doc
tion for future population genomic studies and could Software system (BioRad, Hercules, CA, the USA). The
help in formulating effective BMSB management strat- resulting product was diluted 5-fold with sterile water, and
egies. This study will also help in tracing the origin of sent for Sanger sequencing Macrogen (Soul, South Korea)
BMSB intercepted at the border in those countries, such using the amplification primers in both directions. The
as New Zealand, where the species has not yet quality of the Sanger sequencing dataset was manually ex-
established. amined and analysed in Geneious software (Biomatters,
Auckland, New Zealand) [40]. The resulting quality-filtered
Methods COI and COII gene sequences for each haplotype were
Sample collection and DNA extraction submitted to GenBank under the accession numbers,
BMSB specimens were collected from 43 regions/prov- MT517228 - MT517274 for COI and MT490838 -
inces in 12 countries (Austria, Chile, China, Georgia, MT490860 for COII. All the metadata for each specimen
Hungary, Italy, Japan, Romania, Serbia, Slovenia, Turkey, and their sequences were submitted into BOLD under pro-
and the USA). All BMSB specimens were stored in 95% ject code BMSB. The BOLD processed IDs for each speci-
ethanol at − 20 °C and the species identity was confirmed men are listed in Additional file 1. All the sequences were
by morphological characteristics by MPI entomologists. used to create a dataset in BOLD, under the DOI: dx.doi.
Total genomic DNA was extracted from each individual org/10.5883/DS-BMSB.
specimen using QIAGEN DNeasy® Blood & Tissue Kit
with QIAGEN RNase A (Qiagen, Valencia, CA, the Public COI and COII sequence data acquisition and
USA). The DNA quality and purity were determined haplotype calling
using NanoDrop™ (CA, the USA) and quantified using A comparative barcoding analysis of COI and COII
QuantiFluor™ (CA, the USA) (Additional file 1). genes from the BMSB cohort of the current study and
the publicly available COI and COII sequences from
Polymerase Chain Reaction (PCR) and sequencing BMSB were conducted. The reference COI and COII se-
The genetic diversity of the BMSB populations was deter- quences were created, respectively, by the following
mined by analysing the mitochondrial DNA (mtDNA) steps. Firstly, previously reported COI and COII barcode
cytochrome c oxidase subunit I (COI) and cytochrome c sequences of BMSB were downloaded from the Gen-
oxidase subunit II (COII). The two markers were chosen Bank. The COI (UID: 1674561291, 1,591,437,641, 1,334,
due to their fairly high variability and large number of se- 761,755, 1,304,534,304, 1,240,496,350, 1,201,369,261, 1,
quences previously reported. Partial sequence of the COI 024,298,892, 985,693,878, 443,298,673, 537,366,792, 552,
(657 bp) and COII (518 bp) genes were amplified using the 099,040) and COII (UID: 1334762135, 552,098,974) se-
genomic DNA as a template. The LCO1490 (5′-GGTCAA quences were aligned separately using Geneious software
CAAATCATAAAGATATTGG-3′) and HCO2198 (5′- v10.2.5 [40]. Secondly, for COI, a 657 bp region was se-
TAAACTTCAGGGTGACCAAAAAATCA-3′) [39] pri- lected for further analysis while a 518 bp region was se-
mer pairs were used for amplification of the COI region. lected for COII. Sequences not from the same region of
Similarly, the HhalysCO2F2 (5′-TAACCCAAGATGCAAA COI or COII were discarded. Finally, the aligned se-
TTCT-3) and HhalysCO2R2 (5′-CCATATATAATTCC quences were trimmed to 657 bp for COI and 518 for
TGGACGA-3′) primer pairs were used for amplification of COII and duplicated sequences removed. The remaining
the COII region [29]. The PCR reagents (reaction volume unique sequences were used as the reference dataset for
of 20 μl) for COI and COII were the same except the haplotype assignment.
primers, comprising of 4.4 μl sterile deionized water, 10.0 μl All the COI and COII sequences obtained in this study
2X GoTaq® Green Master Mix (Promega), 1.0 μl of 5 μM were checked and edited in Geneious software [40] to
Forward primer, 1.0 μl of 5 μM Reserve primer, 0.6 μl of 50 remove poor quality sequences. A 657 bp COI and a
mM MgCl2, 1.0 μl of 10 μg/μl BSA. Thermocycling condi- 518 bp COII regions were used for further analysis, thus
tions for both reactions comprised of an initial denaturation no missing data and ambiguous base-calls such as Y, W,
step of 94 °C for 5 mins, followed by 40 cycles of denatur- N. S in the sequences obtained. Using the previously re-
ation at 94 °C for 15 s, annealing at 50 °C for 30 s, and ex- ported BMSB haplotypes as a reference, an in-house py-
tension at 72 °C for 45 s, followed by a final extension phase thon script was developed to allocate the haplotype
at 72 °C for 7 min. All reactions were performed using a name for each obtained sequence. The script automatic-
Veriti 96-well thermal cycler (Life Technologies). In this ally allocated haplotype name to each individual of this
study, 463 specimens were used for COI and COII sequen- study by searching the database. Sequences identical
cing. The amplified DNA fragments in the final PCR with those previously reported were assigned the sameYan et al. BMC Genomic Data (2021) 22:7 Page 14 of 16
haplotype name (with a prefix H for COI or h for COII). Additional file 1. Metadata information of the collected BMSB cohort.
The remaining sequences which did not share 100% se- Additional file 2. Haplotype information of the BMSB populations.
quence identity with the previously reported were given Additional file 3. FST values of all the BMSB populations.
a new haplotype name (with a prefix N for COI and n
for COII). Finally, a Microsoft Excel file was created Abbreviations
(Additional file 1) and the number of haplotypes per AMOVA: Analysis of molecular variance; BMSB: Brown marmorated stink bug;
population was calculated in Microsoft Excel. To further COI: Cytochrome c oxidase I; COII: Cytochrome c oxidase II;
mtDNA: Mitochondrial DNA; MPI: Ministry for Primary Industries; NZIER: New
confirm those new haplotypes, all the sequences Zealand Institute of Economic Research; PCoA: Principle Coordinates Analysis
detected in this study were also BLAST searched in
GenBank database [32]. To better illustrate the popula- Acknowledgments
This work is dedicated to the memory of the late Dr Vétek Gábor, a co-author
tion genetics, the COI and COII sequences were of this paper.
concatenated into one linked longer haplotype, namely We would like to thank Drs David Waite and Luciano Rigano from the Plant
COI-COII combined haplotype. All the subsequent gen- Health and Environment Laboratory (PHEL), Ministry for Primary Industries
(MPI) for critically reviewing the manuscript. We would like to thank Drs
etic analyses were conducted based on the COI-COII Zhidong Yu, Claire McDonald and Sue Escott-Brown for their support, sug-
combined haplotypes. gestions, and feedback to the project. Our special thanks go to the Entomol-
ogy team members of the PHEL of MPI for supplying the BMSB specimens
intercepted at the New Zealand border or from the post-border surveillance
Population genetic analysis and assisting in morphological identification of the specimens. Finally, we
The genetic diversity as the percentage of each haplotype would like to thank the following researchers for providing the BMSB speci-
present from different regions and/or countries was esti- mens from a range of different countries:
Dr. Catherine Duthie of Readiness Programmes, MPI, New Zealand; Ms.
mated by calculating the number of haplotypes detected Xinyao Gu from Institute of Entomology, Guizhou University, China; Ms.
at the country, divided by the total number of individ- Jianyun Wang from Environment and Plant Protection Institute, Chinese
uals sampled using Microsoft Excel. Population genetic Academy of Tropical Agriculture sciences, China; Dr. Shu-Jun Wei from Insti-
tute of Plant and Environmental Protection, Beijing Academy of Agriculture
diversity, as indexed by the number of haplotype (Hn), and Forestry Sciences, China; Dr. Jun Ma from Institute of Plant Quarantine,
haplotype diversity (Hd) and nucleotide diversity (π) was Guangzhou Customs Technology Center, China; Dr. Yongliang Fan from
estimated using DnaSP v6 [41] to quantify the degree of Northwest A & F University, China; Dr. Dong Liu from Chines Academy of Sci-
ences, China; Dr. Xiaofen Xue from Nanjing Agricultural University, China; Dr.
genetic diversity. Analyses of haplotype and nucleotide Lixia Xie from Shandong Agricultural University, China; Dr. Gonzalo Avila from
diversity were conducted separately for each population Plant & Food Research, New Zealand; Dr. Kyo Itoyama from Meiji University,
as well as for populations in one country and one Japan; Valerio Mazzoni from Edmund Mach Foundation, Iris Bernardinelli
from Servizio fitosanitario e chimico, ricerca, sperimentazione e assistenza
genetic group. To examine the historical demographic tecnica, Italy; Drs Laura Nixon and Kim Hoelmer from US Department of Agri-
expansion, a neutrality test was performed under DnaSP culture, the USA; Dr. Roxana Ciceoi from University of Agricultural Sciences
v6. Based on the Hd values, the BMSB populations in and Veterinary Medicine of Bucharest, Romania; Dr. Ilania Astorga Leiva from
Subdepto Vigilancia y control de plagas agrícolas, División Protección Agríc-
the invaded countries were divided into two groups: gen- ola y Forestal, Servicio Agrícola y Ganadero, Gobierno de Chile; Dr. Attila
etic group A (Chile, Georgia, Hungary, Italy, Romania, Torma from University of Szeged, Dr. Ákos Varga from Government Office of
Turkey and the USA) and genetic group B (Austria, Pest County, Hungary; Dr. Temel Göktürk from Artvin Coruh University,
Turkey; Dr. Maka Murvanidze from Agricultural University of Georgia, Georgia;
Serbia and Slovenia). Therefore, the neutrality test was Dr. Wolfgang Rabitsch from University of Vienna, Austria.
also performed among the BMSB populations from This research was partly supported by the Hungarian Ministry for Innovation
China, Japan, group A, and group B. and Technology within the framework of the Higher Education Institutional
Excellence Program (NKFIH-1159-6/2019) in the scope of plant breeding and
Genetic differentiation among the BMSB populations plant protection research of Szent István University, and the NKTH 2017-2.3.3-
was estimated by the fixation index (FST), and the overall TÉT-VN-2017-00006 (Biological control of invasive pest species in Vietnam
genetic variance was calculated by AMOVA (Analysis of and Hungary) research project. Finally, we would like to thank the editor and
two anonymous reviewers for their suggestions in improving the
molecular variance). Both calculations were fulfilled manuscript.
using Arlequin 3.5 [42]. To show the genetic relation-
ships among the populations, a Principal Coordinates Authors’ contributions
DL, JY, CP, SG and RKB conceived and designed the study. QF, DA, DG, JZ
Analysis (PCoA) was conducted based on the FST data and GV collected the samples and conducted the morphological
(Additional file 3) using GenAlEx 6.5 [43]. The relation- identification. JY conducted the laboratory experiments, bioinformatics, and
ships among the COI and COII combined haplotypes statistical analyses. CP assisted the bioinformatics analysis. JY drafted the
manuscript with input from DL, CP, GV, PF, AB. All authors have read, edited,
were examined using a parsimony network by applying and approved the final version of the manuscript.
the method described by TCS analysis [44] based on the
COI-COII combined haplotypes and visualized using Funding
The research was funded by the Operational Research programme under the
PopART [45]. project number 405731 from the Ministry for Primary Industries (MPI), New
Zealand. The funding body provided the financial supports for conducting
Supplementary Information the experiments and generating the data, and the costs for publishing the
The online version contains supplementary material available at https://doi. findings. The funding body played no role in the design of the study and
org/10.1186/s12863-021-00961-8. collection, analysis, and interpretation of data and in the preparation of the
manuscript.Yan et al. BMC Genomic Data (2021) 22:7 Page 15 of 16
Availability of data and materials potential of damage on agricultural crops in Romania. Lucrări Ştiinţifice,
The in-house script can be found using the link below. seria Agronomie. 2015;58(1):105–8.
https://1drv.ms/u/s!AvRFcQuxR5sIgpZzg_Ch02Lm2u4tJA?e=u9CoLx 15. Heckmann R. First evidence of Halyomorpha halys (Stal, 1855) (Heteroptera:
The dataset for the COI and COII sequences in BOLD can be found under Pentatomidae) in Germany. Heteropteron. 2012;36:17–8.
the DOI: dx.doi.org/10.5883/DS-BMSB. 16. Vétek G, Papp V, Haltrich A, Rédei D. First record of the brown marmorated
stink bug, Halyomorpha halys (Hemiptera: Heteroptera: Pentatomidae), in
Ethics approval and consent to participate Hungary, with description of the genitalia of both sexes. Zootaxa. 2014;
Not applicable. 3780(1):194–200.
17. Maistrello L, Dioli P, Vaccari G, Nannini R, Bortolotti P, Caruso S, Costi E,
Consent for publication Montermini A, Casoli L, Bariselli M: First records in Italy of the Asian stinkbug
Not applicable. Halyomorpha halys, a new threat for fruit crops. Atti, Giornate
Fitopatologiche, Chianciano Terme (Siena), 18–21 marzo 2014, Volume
Competing interests primo. 2014;283–288.
The authors declared no conflicts of interest to this work. 18. Wermelinger B, Wyniger D, Forster B. First records of an invasive bug in
Europe: Halyomorpha halys Stål (Heteroptera: Pentatomidae), a new pest on
Author details woody ornamentals and fruit trees? Mitteil Schw Entomol Gesellschaft.
1
Plant Health and Environment Laboratory, Ministry for Primary Industries, PO 2008;81:1–8.
Box 2095, Auckland 1140, New Zealand. 2Plant Health and Environment 19. Milonas PG, Partsinevelos GK. First report of brown marmorated stink bug
Laboratory, Ministry for Primary Industries, PO Box 14018, Christchurch 8544, Halyomorpha halys Stål (Hemiptera: Pentatomidae) in Greece. EPPO Bul.
New Zealand. 3Department of Entomology, Szent István University, Villányi út 2014;44(2):183–6.
29-43, Budapest H-1118, Hungary. 4Biosecurity Science and Risk Assessment, 20. Cesari M, Maistrello L, Ganzerli F, Dioli P, Rebecchi L, Guidetti R. A pest alien
Ministry for Primary Industries, Wellington, New Zealand. 5MARA-CABI Joint invasion in progress: potential pathways of origin of the brown marmorated
Laboratory for Bio-safety, Institute of Plant Protection, Chinese Academy of stink bug Halyomorpha halys populations in Italy. J Pest Sci. 2015;88(1):1–7.
Agricultural Sciences, No. 2 Yuanmingyuan West Road, Beijing 100193, 21. Faúndez EI, Rider DA. The brown marmorated stink bug Halyomorpha halys
People’s Republic of China. (Stål, 1855) (Heteroptera: Pentatomidae) in Chile. Arquivos Entomolóxicos.
2017;17:305–7.
Received: 20 August 2020 Accepted: 5 January 2021 22. Zhu G, Bu W, Gao Y, Liu G. Potential geographic distribution of brown
marmorated stink bug invasion (Halyomorpha halys). PLoS One. 2012;7(2):
e31246.
References 23. Kriticos DJ, Kean JM, Phillips CB, Senay SD, Acosta H, Haye T. The potential
1. MacLellan R. Plants and environment brown marmorated stink bug: a global distribution of the brown marmorated stink bug, Halyomorpha halys,
potential risk to New Zealand. Surveillance (Wellington). 2013;40(1):34–6. a critical threat to plant biosecurity. J Pest Sci. 2017;90(4):1033–43.
2. Nielsen AL, Hamilton GC. Life history of the invasive species Halyomorpha 24. Vandervoet TF, Bellamy DE, Anderson D, MacLellan R. Trapping for early
halys (Hemiptera: Pentatomidae) in northeastern United States. Ann detection of the brown marmorated stink bug, Halyomorpha halys, in New
Entomol Soc Am. 2009;102(4):608–16. Zealand. N Z Plant Protect. 2019;72:36–43.
3. Leskey TC, Hamilton GC, Nielsen AL, Polk DF, Rodriguez-Saona C, Bergh JC, 25. Labware LIMS. Ministry for Primary Industries. 2020. (Accessed June 2020).
Herbert DA, Kuhar TP, Pfeiffer D, Dively GP. Pest status of the brown 26. Ballingall J, Pambudi D. Quantifying the economic impacts of a Brown
marmorated stink bug, Halyomorpha halys in the USA. Outlooks Pest Marmorated stink bug incursion in New Zealand: a dynamic computable
Manag. 2012;23(5):218–26. general equilibrium modelling assessment; 2017.
4. Hoebeke ER, Carter ME. Halyomorpha halys (Stål) (Heteroptera: 27. Ficetola GF, Bonin A, Miaud C. Population genetics reveals origin and
Pentatomidae): a polyphagous plant pest from Asia newly detected in number of founders in a biological invasion. Mol Ecol. 2008;17(3):773–82.
North America. Proc Entomol Soc Wash. 2003;105(1):225–37. 28. Lee W, Guidetti R, Cesari M, Gariepy TD, Park Y, Park C. Genetic diversity of
5. Leskey TC, Nielsen AL. Impact of the invasive brown marmorated stink bug Halyomorpha halys (Hemiptera, Pentatomidae) in Korea and comparison
in North America and Europe: history, biology, ecology, and management. with COI sequence datasets from East Asia, Europe, and North America. Fla
Annu Rev Entomol. 2018;63:599–618. Entomol. 2018;101(1):49–54.
6. Wiman NG, Walton VM, Shearer PW, Rondon SI, Lee JC. Factors affecting 29. Xu J, Fonseca DM, Hamilton GC, Hoelmer KA, Nielsen AL. Tracing the origin
flight capacity of brown marmorated stink bug, Halyomorpha halys of US brown marmorated stink bugs, Halyomorpha halys. Biol Invasions.
(Hemiptera: Pentatomidae). J Pest Sci. 2015;88(1):37–47. 2014;16(1):153–66.
7. Lee D, Nielsen AL, Leskey TC. Dispersal capacity and behavior of nymphal 30. Cesari M, Maistrello L, Piemontese L, Bonini R, Dioli P, Lee W, Park C,
stages of Halyomorpha halys (Hemiptera: Pentatomidae) evaluated under Partsinevelos GK, Rebecchi L, Guidetti R. Genetic diversity of the brown
laboratory and field conditions. J Insect Behav. 2014;27(5):639–51. marmorated stink bug Halyomorpha halys in the invaded territories of Europe
8. Hamilton GC. Brown marmorated stink bug. Am Entomol. 2009;55(1):19–20. and its patterns of diffusion in Italy. Biol Invasions. 2018;20(4):1073–92.
9. Josifov MV, Kerzhner IM. Heteroptera aus Korea. II. Teil (Aradidae, Berytidae, 31. Haye T, Gariepy T, Hoelmer K, Rossi J, Streito J, Tassus X, Desneux N. Range
Lygaeidae, Pyrrhocoridae, Rhopalidae, Alydidae, Coreidae, Urostylidae, expansion of the invasive brown marmorated stinkbug, Halyomorpha halys:
Acanthosomatidae, Scutelleridae, Pentatomidae, Cydnidae, Plataspidae). an increasing threat to field, fruit and vegetable crops worldwide. J Pest Sci.
Fragmenta Faunistica. 1978;23(9):137–96. 2015;88(4):665–73.
10. Rider DA, Zheng LY, Kerzhner IM. Checklist and nomenclatural notes on the 32. Altschul SF, Gish W, Miller W, Myers EW, Lipman DJ. Basic local alignment
Chinese Pentatomidae (Heteroptera). II Pentatominae Zoosystematica search tool. J Mol Biol. 1990;215(3):403–10.
Rossica. 2002;11(1):135–53. 33. Ratnasingham S, Hebert PDN. BOLD: The Barcode of Life Data System
11. Lee D, Short BD, Joseph SV, Bergh JC, Leskey TC. Review of the biology, (www.barcodinglife.org). Mol Ecol Notes. 2007;7:355–64. https://doi.org/10.
ecology, and management of Halyomorpha halys (Hemiptera: 1111/j.1471-8286.2006.01678.x.
Pentatomidae) in China, Japan, and the Republic of Korea. Environ Entomol. 34. Deardorff A. Tableau (version. 9.1). J Med Lib Assoc. 2016;104(2):182–3.
2013;42(4):627–41. 35. Zhu G, Ye Z, Du J, Zhang D, Zhen Y, Zheng C, Zhao L, Li M, Bu W. Range
12. EPPO: Halyomorpha halys (HALYHA). EPPO Global database, Paris: wide molecular data and niche modeling revealed the Pleistocene history
EPPO 2020. https://gd.eppo.int/taxon/HALYHA/distribution (Accessed 3 of a global invader (Halyomorpha halys). Sci Rep. 2016;6(1):1–10.
August 2020). 36. Wermelinger BEAT, Wyniger D, Forster BEAT. First records of an invasive bug in
13. Gariepy TD, Haye T, Fraser H, Zhang J. Occurrence, genetic diversity, and Europe: Halyomorpha halys Stal (Heteroptera: Pentatomidae), a new pest on
potential pathways of entry of Halyomorpha halys in newly invaded areas of woody ornamentals and fruit trees? Schweiz Entomol Ges. 2008;81(1/2):1.
Canada and Switzerland. J Pest Sci. 2014;87(1):17–28. 37. Güncan A, Gümüş E. Brown marmorated stink bug, Halyomorpha halys (Stål,
14. Macavei LI, Bâeţan R, Oltean I, Florian T, Varga M, Costi E, Maistrello L. First 1855) (Hemiptera: Heteroptera, Pentatomidae), a new and important pest in
detection of Halyomorpha halys Stål, a new invasive species with a high Turkey. Entomol News. 2019;128(2):204–10.Yan et al. BMC Genomic Data (2021) 22:7 Page 16 of 16
38. Fu Y. Statistical tests of neutrality of mutations against population growth,
hitchhiking and background selection. Genetics. 1997;147(2):915–25.
39. Folmer O, Black M, Hoeh W, Lutz R, Vrijenhoek R. Phylogenetic uncertainty.
Mol Mar Biol Biotechnol. 1994;3:294–9.
40. Kearse M, Moir R, Wilson A, Stones-Havas S, Cheung M, Sturrock S, Buxton S,
Cooper A, Markowitz S, Duran C. Geneious basic: an integrated and
extendable desktop software platform for the organization and analysis of
sequence data. Bioinformatics. 2012;28(12):1647–9.
41. Rozas J, Ferrer-Mata A, Sánchez-DelBarrio JC, Guirao-Rico S, Librado P,
Ramos-Onsins SE, Sánchez-Gracia A. DnaSP 6: DNA sequence polymorphism
analysis of large data sets. Mol Biol Evol. 2017;34(12):3299–302.
42. Excoffier L, Lischer HE. Arlequin suite ver 3.5: a new series of programs to
perform population genetics analyses under Linux and windows. Mol. Ecol.
Resour. 2010;10(3):564–7.
43. PE PRS: GenAlEx 6.5: genetic analysis in Excel. Population genetic software
for teaching and research – an update. Bioinformatics. 2012;28(19):2537.
44. Clement M, Snell Q, Walker P, Posada D, Crandall K. TCS: estimating gene
genealogies. In proceedings of the 16th international parallel and
distributed processing symposium (IPDPS '02), vol. 311: IEEE computer
society; 2002.
45. Leigh JW. Bryant D: popart: full-feature software for haplotype network
construction. Methods Ecol Evol. 2015;6(9):1110–6.
Publisher’s Note
Springer Nature remains neutral with regard to jurisdictional claims in
published maps and institutional affiliations.You can also read