Wide dispersion of B chromosomes in Rhammatocerus brasiliensis (Orthoptera, Acrididae) - SciELO
←
→
Page content transcription
If your browser does not render page correctly, please read the page content below
Genetics and Molecular Biology 43, 3, e20190077 (2020)
            Copyright © 2020, Sociedade Brasileira de Genética.
            DOI: https://doi.org/10.1590/1678-4685-GMB-2019-0077

Research Article
Animal Genetics
Wide dispersion of B chromosomes in Rhammatocerus brasiliensis
(Orthoptera, Acrididae)

Adriana S. Melo1, Geyner A.S. Cruz1,2            , Aline P. Félix1, Marília F. Rocha1, Vilma Loreto3 and
Rita C. Moura1
1
  Universidade de Pernambuco (UPE), Instituto de Ciências Biológicas, Laboratório de Biodiversidade e
Genética de Insetos, Recife, PE, Brazil.
2
  Universidade de Pernambuco (UPE), Laboratório de Biodiversidade e Genética Evolutiva, Campus
Petrolina, Petrolina, PE, Brazil.
3
  Universidade Federal de Pernambuco (UFPE), Departamento de Genética, Laboratório de Genética
Animal e Humana e Citogenética, Recife, PE, Brazil.

Abstract
The grasshopper Rhammatocerus brasiliensis shows polymorphism of B chromosomes, but the magnitude of
B-chromosome occurrence and the factors that may contribute to their dispersion in the species remain unknown
thus far. The present study analyzed the occurrence and dispersion of B chromosomes in R. brasiliensis individuals
from 21 populations widely distributed in the Brazilian Northeast. The genetic connectivity between 10 populations
was verified through analysis of ISSR markers from 200 individuals. Of the 21 populations, 19 presented individuals
with one B chromosome, three with two, and one with three B chromosomes. The B chromosome is of medium size
and constitutive heterochromatin (CH) located in the pericentromeric region. A variant B chromosome was observed
in three populations, similar in size to that of chromosome X, gap and CH, and located in the terminal region. B chro-
mosome frequencies in different populations varied from 0% to 18,8%, mean 8,5%. The wide distribution of the B
chromosome is likely a consequence of the positive gene flow among the analyzed populations. B-chromosome oc-
currence in populations of R. brasiliensis possibly follows the population genetic structure of the species and, owing
to the existence of a variant, its origin may not be recent.
Keywords: Grasshopper, supernumerary chromosome, chromosome polymorphism, ISSR, genetic connectivity.
Received: March 13, 2019; Accepted: July 16, 2019.

Introduction                                                      control of the cell cycle (Valente et al., 2014; Ramos et al.,
      B chromosomes, also known as supernumerary chro-            2016).
mosomes, are extra elements of the karyotype. These chro-                The occurrence of B chromosomes is almost univer-
mosomes do not obey the Mendelian laws of inheritance             sal, being found in approximately 15% of the analyzed
and do not present homology with the other chromosomes            eukaryotes (Camacho, 2005). Among the animals, the in-
of the A complement (Camacho et al., 2000). Moreover,             sects of the order Orthoptera stand out for the great fre-
they generally differ by the accumulation of repetitive           quency of B chromosomes, being hotspots in the super-
DNA sequences, such as satellite DNA (Ruiz-Ruano et al.,          families Acridoidea, Grylloidea, Pyrgomorphoidea and
2017; Milani et al., 2017a), ribosomal DNA and histone H3         Tetrigoidea (Palestis et al., 2010). In Acridoidea, the Acri-
(Oliveira et al., 2011), U2 small nuclear RNA (Bueno et al.,      didae family is considered a hotspot representing 17,1%
2013), and transposable elements (Palacios-Gimenez et al.,        (Palestis et al., 2010). Locusta migratoria (Linnaeus, 1758)
2014). Although repetitive sequences are common in the            and Eyprepocnemis plorans (Charpentier, 1825) of this
composition of B chromosomes, genes conferring resis-             family are used as models to better understand the occur-
tance to antibiotics and pathogens have also been identified      rence, origin and evolution of the B chromosomes (Bueno
(Coleman et al., 2009), besides others that participate in the    et al., 2013).
                                                                         When the frequency of B chromosomes in a popula-
Send correspondence to Rita de Cássia de Moura. Universidade de
                                                                  tion is equal to or higher than 25%, it is suggested that their
Pernambuco (UPE), Instituto de Ciências Biológicas, Laboratório
de Biodiversidade e Genética de Insetos. Rua Arnóbio Marques      origin is recent (Araújo et al., 2001). Contrarily, in popula-
310, Santo Amaro, 50.100-130 Recife, PE, Brazil. E-mail:          tions where the frequency is relatively low (below 25%),
ritamoura.upe@gmail.com.                                          the B chromosome is considered as stable or in process of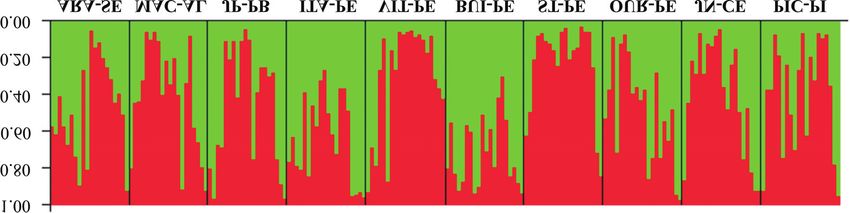
2                                                                                                                     Melo et al.

elimination (Riera et al., 2004). According to some authors      2) based on the relatively low frequency of B chromosomes
(Camacho et al., 1997, 2015; Zurita et al., 1998), B chro-       in R. brasiliensis, as verified in different populations by
mosomes present four main life-cycle stages: 1) invasion,        Loreto et al. (2008b), it is expected that the B chromosome
where a B chromosome arrives or emerges in a natural pop-        is currently in the near-neutrality stage.
ulation and its frequency rises rapidly within only a few               With this in mind, we analyzed the occurrence, fre-
tens of generations; 2) resistance, when a B chromosome          quency and distribution of B chromosomes in R. brasili-
remains in the host genome through drive mechanisms; 3)          ensis individuals from 21 populations from the Brazilian
near neutrality, when the frequency of B chromosomes var-        Northeast, of which 10 were also analyzed regarding popu-
ies randomly by genetic drift, or decreases due to negative      lation genetic structure. In addition, the position of the con-
selection in individuals with increased number of B chro-        stitutive heterochromatin (CH) was established in the B
mosomes (this constitutes the longest stage, which can last      chromosomes of the species.
for thousands of generations); and 4) regeneration, where
the B chromosome depends on the accumulation of muta-            Material and Methods
tions for the emergence of novel variants that may be able
to remain in the genome and substitute the former, neutral-      Sampling
ized B chromosome, reinitiating the B chromosome cycle                 Specimens of R. brasiliensis (Bruner 1904) were col-
and prolonging its evolutionary life.                            lected from 21 populations in the Brazilian Northeast, of
      For Neotropical grasshoppers, particularly those oc-       which 13 were located in the state of Pernambuco (PE), one
curring in Brazil, most works performed so far have fo-          in Sergipe (SE), one in Alagoas (AL), one in Paraíba (PB),
cused on the analysis of the origin and composition of B         one in Ceará (CE), one in Piauí (PI), and three in Bahia
chromosomes through the mapping of different repetitive          (BA) (Figure 1). Of these populations, 11 have been previ-
sequences, as observed for the species Abracris flavoli-         ously sampled and analyzed with regard to the occurrence
neata (2n = 24, X0 + B and 2n = 25, X0 + 2Bs) (Bueno et          and prevalence of B chromosomes by Loreto et al. (2008a)
al., 2013; Milani and Cabral-de-Mello, 2014; Palacios-           and Oliveira et al. (2011).
Gimenez et al., 2014; Menezes-de-Carvalho et al., 2015;                The grasshoppers were collected with the help of an
Milani et al., 2017a,b) and Xyleus discoideus angulatus (2n      entomological net and transported to the Laboratório de
= 24, X0 + B and 2n = 25, X0 + 2Bs) (Loreto et al., 2008a;       Biodiversidade e Genética de Insetos (LBGI), Instituto de
Machado et al., 2014; Bernardino et al., 2017). For Rham-        Ciências Biológicas da Universidade de Pernambuco. The
matocerus brasiliensis, the frequency of B chromosomes           collections were permitted by ICMBio/SISBIO under the
has also been analyzed in eight populations from Pernam-         license number 16278-1.
buco and three from Bahia, states of the Brazilian North-
east, showing 2n = 24, X0 + B and 2n = 25, X0 + 2Bs              Conventional staining and C-banding
(Loreto et al., 2008a,b; Oliveira et al., 2011). Regarding             The karyotypes of 590 adult male specimens of R.
Neotropical species, the distribution of B chromosomes in        brasiliensis were analyzed by conventional staining. First,
natural grasshopper populations has not been analyzed un-        the classic technique of testicular follicle squashing was
der consideration of the genetic structure of the popula-        performed, consisting in the maceration of the gonads in
tions, and such studies have only been performed in Palear-      one drop of 45% acetic acid. Subsequently, the slides were
ctic grasshoppers (Keller et al., 2013; Manrique-Poyato et       subjected to heat of 65 °C for approximately 3 min for fixa-
al., 2013a,b, 2015). This kind of approach allows estimat-       tion of the chromosome preparation onto the slide, then
ing the gene flow among individuals within and between           stained with 5% Giemsa. The C-banding technique was
populations, which may be a parameter directly related to        performed according to Sumner (1972), with duration of
the dispersion or isolation of B chromosomes (Manrique-          exposure to the basic solution [Ba(OH)2] altered to 2 min,
Poyato et al., 2015).                                            in individuals carrying B chromosomes from the popula-
      R. brasiliensis is widely distributed in the Northeast     tions of VIT and LC (Pernambuco – PE).
of Brazil, with records in the states of Rio Grande do Norte,
Paraíba, Pernambuco (Assis-Pujol, 1998), and Bahia (Lo-          Analysis of occurrence and frequency of B
reto et al., 2008a). In Pernambuco, the species is found         chromosomes and statistical test
across the entire state, having been reported in 11 localities         The occurrence, frequency, and distribution of B
(Carbonell, 1995; Assis-Pujol, 1998; Loreto et al., 2008a).      chromosomes were analyzed in a total of 1.274 specimens.
Because of its wide distribution (Carbonell, 1988), R. bra-      Of these, 394 were individuals from 10 populations being
siliensis is an interesting species for understanding the        analyzed for the first time (GOI–PE, LC–PE, SAL–PE,
life-cycle stages of B chromosomes and how they may dis-         BUI–PE, OUR–PE, ARA–SE, MAC–AL, JP–PE, JN–PE
perse. In this study, the following hypotheses were tested:      and PIC–PI) and 196 were individuals from four popula-
1) B chromosomes are dispersed among R. brasiliensis             tions with samplings being expanded (ITA–PE, VIT–PE,
populations according to gene flow existing among them;          BEZ–PE and ST–PE). The data for the remaining speci-
B chromosomes in Rhammatocerus brasiliensis 3
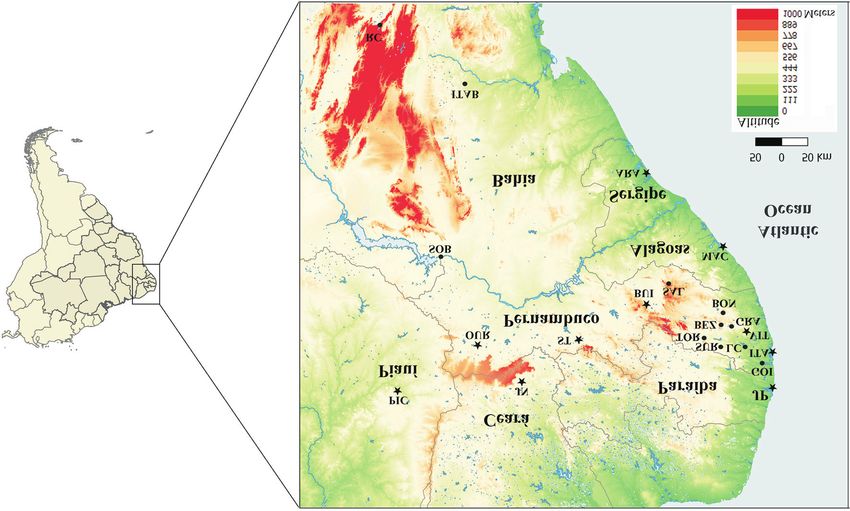
Figure 1 - Partial map of the Brazilian Northeast indicating the sampling locations of Rhammatocerus brasiliensis populations. Aracaju (ARA) – SE;
Maceió (MAC) – AL; João Pessoa (JP) – PB; Itamaracá (ITA) – PE; Vitória de Santo Antão (VIT) – PE; Goiana (GOI) – PE; Gravatá (GRA) – PE; Bonito
(BON) – PE; Toritama (TOR) – PE; Saloá (SAL) – PE; Buíque (BUI) – PE; Lagoa do Carro (LC) – PE; Surubim (SUR) – PE; Bezerros (BEZ) – PE; Serra
Talhada (ST) – PE; Ouricuri (OUR) – PE; Juazeiro do Norte (JN) – CE; Picos (PIC) – PI; Sobradinho (SOB) – BA; Itaberaba (ITAB) – BA; and Rio de
Contas (RC) – BA. Circles indicate populations with karyotyped individuals. Stars indicate populations with karyotyped individuals also analyzed for
population genetics.
mens were obtained from the literature (Loreto et al., thermocycler (Biosystems) as follows: Standard program at
2008b; Oliveira et al., 2011), and included to provide a 94 °C for 4 min; 35 cycles at 94 °C for 30 s; annealing step
wider sampling for this species. (with temperature varying for each primer) for 45 s; exten-
Using the software OpenEpi 3.01, a statistical signifi- sion at 72 °C for 2 min; and final extension at 72 °C for 7
cance test was carried out based on Fisher’s exact test in or- min. The PCR products were visualized in 1,8% agarose
der to verify whether the frequency of B chromosomes gel using a transilluminator (Gel Logic/Carestream MI SE).
differs significantly among the populations. Furthermore, A total of 49 ISSR primers (Biotechnology Labora-
using the same software, analysis of confidence intervals tory, University of British Columbia, Canada) were tested
(CI) was performed to estimate the maximum and mini- in one R. brasiliensis individual, with 33 presenting high
mum number that the frequency of B chromosomes may numbers of amplified DNA fragments with good resolu-
reach in an analysis with a population size of 1.000.000 tion. Selection of the most informative primers was accom-
specimens. plished by applying the 33 pre-selected primers to a sample
of nine specimens from three populations (PIC–PI, JN–CE
DNA extraction and ISSR marker amplification
and JP–PB). Based on the genotyping, the data were
The genomic DNA of R. brasiliensis specimens was grouped into a binary matrix of presence and absence. The
extracted from the leg muscle according to protocol de- analysis of the most informative primers was carried out ac-
scribed by Sambrook and Russell (2001). Subsequently, cording to the parameters number of total, monomorphic
the DNA was purified through enzymatic digestion with and polymorphic DNA fragments, and polymorphism indi-
RNase (10 mg/mL) for 1 h at 37 °C. Next, the concentration ces: Polymorphism Information Content (PIC) (Roldán-
and quality of the extracted DNA were verified via electro- Ruiz et al., 2000), Marker Index (MI) (Prevost and Wil-
phoresis in 1% agarose gel by comparison with DNA from kinson, 1999) and Resolving Power (RP) (Varshney et al.,
phage Lambda DNA/HindIII marker (Fermentas Life Sci- 2007). Furthermore, the Pearson correlation was calculated
ences). among the PIC, MI, and RP indices. The seven most-
Polymerase chain reaction (PCR) amplification was informative primers (807, 835, 844, 845, 846, 857, 866)
performed from a total volume of 10 mL containing 5 ng of were applied to 200 individuals from 10 populations, with
DNA, 1X PCR buffer, 5 mM of MgCl2, 0,2 mM of dNTPs 20 obtained from each population, thus representing the
(2,5 mM), 1 pmol of primer (0,2 mM) and 1 U Taq poly- wide distribution of the species in the Northeast of Brazil
merase (Invitrogen). The reactions were carried out in a (Figure 1, Table 1).4 Melo et al.
Table 1 - State, mesoregion, altitude and geographic coordinate for the sampled populations of Rhammatocerus brasiliensis in the Northeast of Brazil.
State/ Mesoregion Locality Altitude Geographic coordinates Predominant biome / sampled area
Pernambuco/ Metropolitana do ITA - PE 3m 07°45’0”S; 34°05’10”W Atlantic forest - Mangrove/open area
Recife GOI - PE 13 m 07º33’38”S; 35º00’9”W Atlantic forest - Restinga/open area
Pernambuco/ Zona da Mata VIT - PE 162 m 08º07’35”S; 35º18’27”W Atlantic forest/open area
LC - PE 128 m 07º50’56”S; 35º19’14”W Atlantic forest/open area
Pernambuco/ Agreste GRA - PE 447 m 08º12’04”S; 35º33’53"W Atlantic forest - Brejo de altitude/open area
SAL - PE 745m 08º58’33”S; 35º41’15”W Caatinga/open area
BON - PE 443 m 08º28’13”S; 35º43’43"W Atlantic forest - Brejo de Altitude/open area
BUI - PE 798 m 08º37’23”S; 37º09’21”W Atlantic forest - Brejo de Altitude/open area
SUR - PE 394 m 07º59’31”S; 38º17’54”W Caatinga/open area
BEZ - PE 470 m 08º14’00”S; 35º47’49”W Atlantic forest - Brejo de Altitude/open area
TOR - PE 349 m 08°00’24”S; 36°03’24”W Caatinga/open area
Pernambuco/ Sertão ST - PE 444 m 07º49’59”S; 35º45’17”W Caatinga/open area
OUR - PE 451 m 07º52’57”S; 40º04’54”W Caatinga/open area
Aracaju/ Leste Sergipano ARA - SE 4m 10º59’07”S; 37º04’24”W Atlantic forest - Restinga/open area
Alagoas/ Leste Alagoano MAC - AL 4m 09º39’59”S; 35º44’06”W Atlantic forest - Restinga/open area
Paraíba/ Mata Paraibana JP - PB 37m 07º06’54”S; 34º51’47”W Atlantic forest - Restinga/open area
Ceará/ Sul Cearense JN - CE 377 m 07º12’47”S; 39º18’55”W Caatinga/open area
Piauí/ Sudeste Piauiense PIC - PI 206 m 07º04’37”S; 41º28’01”W Caatinga/open area
Bahia/ Vale São Franciscano SOB - BA 0m 09º27’19”S; 40º49’24”W Caatinga/open area
Bahia/ Centro-Sul RC - BA 999 m 13º34’44”S; 41º48’41”W Caatinga/open area
Bahia/ Centro-Norte ITAB - BA 265 m 12º31’39”S; 40º18’25”W Caatinga/open area
Reproducibility test and iv) the free model, where the values are chosen ran-
domly, independent of a priori information. The choice of
The reproducibility of the ISSR markers was verified
the most suitable model was based on the parameters devi-
through analyses based on two independent PCR amplifi-
ance information criterion (DIC), an analog of the Akaike
cations for all seven primers that were applied to all indi-
information criterion (AIC) in the selection via Bayesian
viduals of the studied populations. Non-reproducible loci
models, and Dbar, a measure of the level of adjustment with
were excluded from the genetic analysis.
which the model adapts to the analyzed data (the lower the
Genetic diversity and population structure value of both, the better).
The genetic diversity index (GD), mean expected Number of genetic clusters
heterozygosity (HE), Wright’s fixation index (FST) and mo-
The genetic clusters were analyzed with the software
lecular variance (AMOVA) were calculated with the soft-
Structure 2.3.1 (Pritchard et al., 2000) using the Bayesian
ware Arlequin 3.5 (Excoffier and Lischer, 2010). The num-
algorithm, where the K-value was identified and analyzed
ber of migrants (Nm) and coefficient of genetic
to determine the level of genetic mixture among the popula-
differentiation (GST) were calculated in the software Pop-
tions. For each value of K (from 1 to 10), 10 independent
gen 1.31 (Yeh et al., 1999). The level of isolation by dis-
rounds were performed with 600.000 replications and
tance (IBD) was analyzed from the correlation between ge-
burn-in of 60.000 interactions. Finally, we used the website
netic and geographical distances (Mantel test, Sokal and
Structure Harvester (Earl, 2012), which implements the
Rohlf, 1995) using the software Arlequin 3.5 (Excoffier
method of Evanno et al. (2005), to estimate the number of
and Lischer, 2010), based on 10.000 permutations. At last,
genetic groups (K) which best adjust the data.
the population model most adequate to the data was estab-
lished with the software Hickory 1.1 (Holsinger et al.,
2002) considering four possible models: i) full model, whe- Results
re the values of population differentiation (theta, q, an ana-
Cytogenetic data
log of Wright’s parameter FST) and inbreeding (, an analog
of FIS) differ from zero; ii) model =0, which assumes ab- The karyotype 2n = 23, X0, described for the species
sence of inbreeding within the populations; iii) model R. brasiliensis, was observed in 1.162 specimens. All chro-
theta=0, based on the absence of population differentiation; mosomes of the complement are acrocentric and were cate-B chromosomes in Rhammatocerus brasiliensis 5
gorized, by size, into large (G1 – G3), medium (M4 – M8) lations (p-values > 0.05) identified by Fisher’s pairwise ex-
and small pairs (P9 – P11). In addition, 2n = 24, X0 + B was act test, namely: ITA–JP, 0.032; GRA–SUR, 0.031;
seen in 107 individuals, with the B chromosome being GRA–ST, 0.012; GRA–OUR, 0.045; GRA–MAC, 0.008;
acrocentric and of medium size (Figures 2a,b,d) in all popu- GRA–JP, 0.007; GRA–JN, 0.031; GRA–PIC, 0.045; and
lations exhibiting this polymorphism (ITA–PE, GOI–PE, BEZ–JP, 0.038 (Table 3).
VIT–PE, LC–PE, GRA–PE, SAL–PE, BON–PE, BUI–PE, The C-banding procedure revealed positive C bands
SUR–PE, BEZ–PE, TOR–PE, ST–PE, OUR–PE, in the pericentromeric region of all chromosomes of the A
MAC–AL, JN–CE, PIC–PI, SOB–BA, RC–BA, and complement, as well as in the B chromosomes (Figure 2d).
ITAB–BA); 2n = 25, X0 + 2Bs (Figure 2b) was observed in An additional block was observed in the terminal region of
four specimens from ITA–PE, BEZ–PE, and OUR–PE; and the variant B chromosome (Figure 2e).
2n = 26, X0 + 3Bs in one individual from ITA–PE (Figure
2c, insert) (Table 2). Two distinct B chromosomes were ob- Genetic diversity and population structure data
served: one verified in 19 of the 21 analyzed populations, of
medium size and smaller than X. Another, here denoted as The seven ISSR primers used in the 10 analyzed pop-
variant, was identified in the populations from ITA, BEZ ulations generated a total of 95 reproducible fragments that
and LC, with size similar to that of X and presence of a gap varied in size between 300 and 2.500 base pairs (bp).
in the long arm (Figure 2c). In specimens with a single B Among the 95 analyzed loci, 71.05% were polymorphic,
chromosome, association with the X chromosome was ob- with the populations OUR–PE and ARA–SE presenting the
served (Figure 2a), whereas in the case of two B chromo- highest and lowest percentages of polymorphism (90.5%
somes, the association occurred with autosomes instead and 13.6%), respectively (Table 4). In addition, the mean
(Figure 2b). value for expected heterozygosity (HE) in the populations
The presence of B chromosomes was verified in al- was 0.311, with OUR–PE and MAC–AL presenting the
most all populations, with the exception of ARA–SE and highest and lowest values, corresponding to 0.36 and 0.28,
JP–PB. Among populations with B chromosomes, respectively (Table 4).
ITAB–BA presented the highest frequency (18.8%) and The analysis of population models indicated the full
SAL–PE the lowest (2.32%). The values for total frequency model and =0 as the most adequate according to the param-
of males with B chromosomes in the populations varied eters DIC and Dbar (Spiegelhalter et al., 2002). However,
from 0% to 18.8%, with a mean of 8.5% (Table 2). A signif- the model =0, which assumes absence of inbreeding within
icant difference existed in this regard between some popu- the populations, is the most probable, owing to the gene
Figure 2 - Meiotic cells of the species Rhammatocerus brasiliensis conventionally stained (a, b, c) and C-banded (d, e). a, c, d, e) Diplotene stage with one
B chromosome. b) Diakinesis with two B chromosomes. c) Observe the variant B and the insect with three variant B chromosomes. Bar = 5 mm.6 Melo et al.
Table 2 - Occurrence, distribution, frequency and confidence interval of B chromosomes in the analyzed populations of Rhammatocerus brasiliensis in
the Northeast of Brazil.
Locality Individuals Individuals Total Prevalence Confidence Interval Number of individuals analyzed / reference
1B > 1B (%) 95%
ITA - PE 8 2 73 13.69 7.2 - 23% 27/ Loreto et al., 2008b; 46 / present study
GOI - PE 4 36 11.11 3.6 - 25% Present study
VIT - PE 11 101 10.89 5.8 - 18% 57/ Oliveira et al., 2011; 44 / present study
LC - PE 4 27 14.8 4.9 - 32% Present study
GRA - PE 15 84 17.85 10 - 28% Loreto et al., 2008b
SAL - PE 1 43 2.32 0.12 - 11% Present study
BON - PE 8 64 12.5 6 - 22% Loreto et al., 2008b
BUI - PE 1 27 3.7 0.18 – 16% Present study
SUR - PE 11 147 7,48 4 - 13% Oliveira et al., 2011
BEZ - PE 15 2 142 11.97 7.4 - 18% 88/ Loreto et al., 2008b; 54 / present study
TOR - PE 6 66 9.1 3.8 - 18% Loreto et al., 2008b
ST - PE 9 144 6.25 3.1 - 11% 12/ Loreto et al., 2008b; 80/ Oliveira et al., 2011 and 52 /
present study
OUR - PE 1 1 46 4.35 0.7 - 14% Present study
ARA - SE 0 10 - 0 - 26% Present study
MAC - AL 2 63 3.17 0.5 - 10% Present study
JP - PB 0 35 - 0 - 8.2% Present study
JN - CE 3 61 4.92 1.3 - 13% Present study
PIC - PI 2 46 4.35 0.7 - 14% Present study
SOB - BA 2 30 6.7 1.1 - 20% Loreto et al., 2008b
RC - BA 2 13 15.4 2.7 - 42% Loreto et al., 2008b
ITAB - BA 3 16 18.8 5 - 43% Loreto et al., 2008b
Total 107 5 1274
flow evidenced by other analyses (FST, AMOVA) and the (Palestis et al., 2010). The broad distribution of R. bra-
dispersion capacity of R. brasiliensis (Table 5). siliensis individuals carrying B chromosomes suggests that
Molecular variance (AMOVA) reached 15.32% this polymorphism is widespread among the populations,
among the populations and 64.68% within them. Moreover, apparently there is a relation between the higher frequency
low genetic differentiation and high gene flow were ob- of Bs and the geographical distribution, for example in
served upon analysis of the fixation index, FST =0.15; the GRA-PE, BEZ-PE, SUR-PE and VIT-PE. This tendency is
coefficient of genetic differentiation, GST = 0.17; and the likely associated with positive gene flow among those pop-
number of migrants, Nm=2.3869. Most of the pairwise FST ulations (better discussed below). Moreover, studies in
values were low, though significant values were obtained other grasshopper species such as Eyprepocnemis plorans
for the populations JN–CE and MAC–AL, ST–PE and (Camacho et al., 1980), Trimerotropis pallidipennis (Con-
ITA–PE, ST–PE and BUI–PE, and JN–CE and ST–PE (Ta- falonieri, 1992) and Dichroplus elongatus (Remis, 1989)
ble 6). The Mantel test revealed lack of correlation between reported an increase in the frequency of recombination and
the genetic and geographical distances (r: 0.023121; P: chiasmata in host species, resulting in an advantageous in-
0.828000), which indicates the absence of IBD. crease in genetic variability (Camacho et al., 1980, 2002;
The genetic clustering analysis performed with the Riera et al., 2004), which may be one of the reasons for the
software Structure presented K=2 as highest value, accord- wide distribution of B chromosomes in R. brasiliensis.
ing to the method described by Evanno et al. (2005) (Figure The frequency of B chromosomes in R. brasiliensis
3), with two genetic groups being observed in all analyzed was considered as high when above 11%, and as low when
populations (Figure 4). below 5%. However, all populations had values below
25%, which is indicative of the phase in which the B chro-
Discussion mosome is in the life cycle (Camacho et al., 1997; Araújo et
al., 2001). Given the values of the observed frequencies,
B chromosomes in R. brasiliensis the B of R. brasiliensis populations is probably in the stage
The polymorphism of the B chromosome in R. brasi- of near neutrality of its life cycle. This is the longest phase,
liensis is well represented in Acrididae grasshoppers with successive generations being necessary to disperse theTable 3 - Statistical significance by Fisher’s exact test between populations of Rhammatocerus brasiliensis analyzed for the presence of B chromosomes. Values of p < 0.05 are in boldface.
Locality ITA GOI VIT LC GRA SAL BON BUI SUR BEZ TOR ST OUR ARA MAC JP JN PIC SOB RC ITAB
ITA-PE - 0.961 0.739 0.633 0.625 0.077 0.999 0.287 0.220 0.871 0.562 0.119 0.173 0.510 0.057 0.032 0.152 0.173 0.517 0.999 0.851
GOI-PE - 0.999 0.965 0.523 0.258 0.999 0.559 0.673 0.999 0.993 0.494 0.458 0.721 0.251 0.121 0.457 0.458 0.855 0.999 0.733
VIT-PE - 0.908 0.252 0.154 0.936 0.462 0.480 0.962 0.921 0.285 0.326 0.671 0.128 0.065 0.306 0.326 0.778 0.908 0.586
LC-PE - 0.315 0.658 0.762 0.350 0.999 0.765 0.999 0.999 0.947 0.999 0.694 0.371 0.977 0.947 0.999 0.783 0.519
GRA-PE - 0.017 0.511 0.113 0.031 0.303 0.191 0.012 0.045 0.318 0.008 0.007 0.031 0.045 0.231 0.999 0.999
SAL-PE - 0.121 0.999 0.396 0.093 0.314 0.569 0.999 0.999 0.999 0.999 0.900 0.999 0.732 0.262 0.113
BON-PE - 0.375 0.360 0.999 0.731 0.217 0.255 0.587 0.100 0.051 0.236 0.255 0.642 0.999 0.764
BUI-PE - 0.831 0.353 0.682 0.999 0.999 0.999 0.999 0.871 0.999 0.999 0.999 0.484 0.274
B chromosomes in Rhammatocerus brasiliensis
SUR-PE - 0.275 0.876 0.855 0.722 0.945 0.387 0.177 0.739 0.722 0.999 0.570 0.287
BEZ-PE - 0.720 0.138 0.217 0.587 0.067 0.038 0.188 0.217 0.633 0.985 0.656
TOR-PE - 0.633 0.570 0.831 0.304 0.143 0.573 0.570 0.999 0.783 0.482
ST-PE - 0.952 0.999 0.590 0.268 0.995 0.952 0.999 0.454 0.206
OUR-PE - 0.999 0.999 0.638 0.999 0.999 0.999 0.415 0.206
ARA-SE - 0.999 0 0.999 0.999 0.999 0.616 0.430
MAC-AL - 0.821 0.969 0.999 0.775 0.266 0.107
JP-PB - 0.503 0.638 0.418 0.138 0.053
JN-CE - 0.999 0.999 0.419 0.200
PIC-PI - 0.999 0.415 0.206
SOB-BA - 0.700 0.441
RC-BA - 0.999
ITAB-BA -
78 Melo et al.
Table 4 - Genetic diversity (GD) and mean heterozygosity (HE) estimated
for the analyzed populations of Rhammatocerus brasiliensis.
Locality HE DG
ARA – SE 0.312 13.6
MAC – AL 0.285 68.4
JP – PB 0.320 83.1
ITA - PE 0.297 74.7
VIT – PE 0.329 50.5
BUI – PE 0.324 87.3
ST – PE 0.291 81.0
OUR - PE 0.363 90.5
JN – CE 0.290 82.1
PIC – PI 0.298 78.9
0.311 71.0
Figure 3 - Delta K values according to the method of Evanno et al. (2005).
Note the highest peak of K = 2.
Table 5 - Parameters estimated by the software Hickory for the model f = 0. B chromosome, which has strictly vertical transmission.
These frequencies may arise from stability, considering
Parameter Mean S.D. 2.5% 97.5%
that these chromosomes tend to reach a balanced frequency
Theta-I 0.223 0.016 0.193 0.258 over the years due to the efforts of the host genome to ex-
Theta-II 0.104 0.006 0.092 0.117 tinguish the B chromosome (Camacho et al., 1997; Riera et
Theta-III 0.087 0.003 0.080 0.094 al., 2004).
Theta-Y 0.132 0.018 0.101 0.172 The non-detection of B chromosomes in JP–PB and
Rho 0.591 0.041 0.512 0.673 ARA–SE may be related either to elimination of the poly-
Hs [ARA] 0.257 0.005 0.245 0.268 morphism or to low frequency in these populations as a
Hs [MAC] 0.257 0.005 0.246 0.268 manner of defense of the host genome, which attempts to
get rid of parasite chromosomes (Cabrero et al., 2017).
Hs [JP] 0.270 0.005 0.259 0.281
Most of the analyzed populations did not show a signifi-
Hs [ITA] 0.259 0.005 0.247 0.270
cant difference with regard to the occurrence and fre-
Hs [VIT] 0.293 0.005 0.282 0.304 quency of B chromosomes. This may be associated to the
Hs [BUI] 0.262 0.006 0.250 0.273 low frequency of B chromosomes in several populations
Hs [ST] 0.279 0.005 0.268 0.291 and/or a relatively low number of sampled populations
Hs [OUR] 0.290 0.005 0.279 0.301 lacking these chromosomes. The sampling number of these
Hs [JN] 0.279 0.005 0.269 0.290 groups was possibly insufficient to detect the occurrence of
Hs [PIC] 0.259 0.005 0.248 0.269
B chromosomes, a fact that was corroborated by the confi-
dence interval calculation, which indicated maximum fre-
Hs 0.270 0.002 0.267 0.274
quency of 8.2% in JP–PB and 26% in ARA–SE. In R.
HT 0.298 0.002 0.294 0.302
brasiliensis, the different frequencies may be associated
GSTB 0.092 0.004 0.084 0.100 with the sum of several other factors, such as the number of
Figure 4 - Ancestry of Rhammatocerus brasiliensis specimens traced by the software Structure version 2.3.1, using seven ISSR primers and 95 polymor-
phic bands. Each vertical bar corresponds to one of the 200 analyzed individuals and its population of origin. Bar length is proportional to parentage val-
ues inferred in each group for each individual.B chromosomes in Rhammatocerus brasiliensis 9
generations since the origination or emergence of the B B chromosomes can be differentiated with the C-ban-
chromosome; population differences in the accumulation ding technique based on the patterns of CH distribution, as
of the B chromosome, in case this polymorphism brings an observed in different types of B chromosomes in the grass-
advantage to the host in a population; and action of genetic hopper E. plorans (Henriques-Gil et al., 1984). In addition,
drift (in particular for ARA–SE, based on its low genetic di- the terminal region of the variant B chromosome found in
versity; Table 4), which may be eliminating individuals the population from LC–PE was also C-positive, which fur-
carrying B chromosomes. ther contributes to the characterization of the variant B
The occurrence of R. brasiliensis individuals with chromosome. This variant is probably undergoing the re-
two B chromosomes in the populations of BEZ–PE, generation stage of the cycle, where it has accumulated
OUR–PE and ITA–PE, as well as three B chromosomes in modifications in order to escape neutralization by the host
ITA–PE, is also observed in some Acrididae, for instance genome (Henriques-Gil and Arana, 1990; Camacho et al.,
Aeropus sibiricus (Linnaeus, 1767) with four acrocentric B 1997). This way, the hypothesis of non-recent origin of B
chromosomes (Jetybayev et al., 2018) and Eumastusia koe- chromosomes is reinforced, since successive generations
belei koebelei (Rehn, 1909), with two acrocentric B chro- are necessary for the B chromosome to be nearly neutral-
mosomes (Anjos et al., 2016). The presence of more than ized, accumulate modifications and scatter in the popula-
one B chromosome in R. brasiliensis is probably due to the tions (Henriques-Gil and Arana, 1990; Camacho et al.,
non-disjunction of its sister chromatids during meiosis, as 1997).
suggested by Camacho (2005). Some mechanisms may be
Genetic connectivity between populations of R.
acting in this phenomenon, such as a control region of
non-disjunction located in the B chromosome itself (in the
brasiliensis
terminal or pericentromeric region), as already observed in As previously observed in other organisms (Taylor et
rye (Endo et al., 2008; Banaei-Moghaddam et al., 2012). al., 2011; Pinheiro et al., 2012; Izzatullayeva et al., 2014),
Moreover, non-disjunction of B chromatids could involve the ISSR marker was polymorphic in R. brasiliensis, with
B-specific products (proteins or ncRNAs) that could asso- 71% of the loci presenting variation in the ten analyzed
ciate with the centromeric regions and retard the separation populations. The expected heterozygosity (HE) presented
during anaphase, resulting in both B chromatids ending up variation between 0.285 in MAC–AL and 0.363 OUR–PE.
in the gamete (Benetta et al., 2019). Various B-chromo- These values are similar to those described for other in-
some transcripts related to genes encoding proteins or pseu- sects, such as the grasshoppers Pezotettix giornae (Rossi,
do-genes in rye (Banaei-Moghaddam et al., 2013), fish 1794) (Gauffre et al., 2015) and E. plorans (Manrique-
(Valente et al., 2014; Ramos et al., 2016), fly (Bauerly et Poyato et al., 2013a); the honey bee Apis mellifera meda
al., 2014) and cervids (Makunin et al., 2016) provide the (Skorikow, 1829) (Rahimi et al., 2016); as well as the low
basis to hypothesize about the involvement of protein- value in the beetle Canthon staigi (Pereira, 1953) (Ferrei-
coding genes or pseudogenes in non-disjunction control. ra-Neto et al., 2017) and the high value in Lucanus cervus
The constitutive heterochromatin (CH) may also act on the (Linnaeus, 1758) (Snegin, 2014). Although it has already
cohesion of the sister chromatids of the B chromosome, been evinced that in grasshoppers the presence of B chro-
leading to non-disjunction (Banaei-Moghaddam et al., mosomes may contribute to the increase in genetic variabil-
2012). However, the CH of B chromosomes from R. bra- ity, this relationship was not observed for R. brasiliensis, in
siliensis observed in this study, as well as by Loreto et al. which some populations present low HE, such as ST–PE
(2008a) and Milani et al. (2018), is restricted to the pericen- (0,291) and JN–CE (0.290). Moreover, the total expected
tromeric and/or terminal region, indicating that other of the heterozygosity (HT= 0.298) was greater than the subpo-
mechanisms listed above may be acting on the non-dis- pulation heterozygosity (HS= 0.270), indicating that there
junction of the B chromosomes. may be a deficit of heterozygotes.
The small amount of CH restricted to the pericen- The data generated in this study suggest that the oc-
tromeric region of the B chromosomes from R. brasiliensis currence of B chromosomes in R. brasiliensis is related to
is different from that observed in other grasshopper species its population genetic structure, given the wide dispersion
that possess B chromosomes with CH amplification rich in of the B chromosome verified in the karyotyped individu-
satellite DNA (Loreto et al., 2008a; Bernardino et al., 2017; als, positive gene flow (Nm = 2.3869), and low genetic dif-
Milani et al., 2018). However, the hypothesis cannot be dis- ferentiation FST (0.15) and GST (0.17) among the analyzed
carded that other repetitive DNA segments may be dis- populations. Owing to the migratory behavior of R. bras-
persed in euchromatic regions, such as transposable ele- iliensis (Carbonell, 1988), this is an expected pattern, con-
ments (TEs), which can be present in both observed types sidering that the probable means of dispersion of the B
of B chromosomes (common and variant). TEs may have chromosome in different geographic ranges, according to
accumulated in the B chromosome and promoted the am- Camacho et al. (2015), would be through gene flow be-
plification of sequences (Marques et al., 2018), contribut- tween hosts and individuals from populations that do not
ing to the generation of the variant B chromosome. have the B chromosome. The Mantel test suggested a lack10 Melo et al.
of correlation between genetic and geographical distance, the occurrence of B chromosomes and the distribution of R.
even between populations more than 700 km apart brasiliensis in different landscapes. For this species, the al-
(ITA–PE and JN–CE). This may be contributing to the dis- titude of the analyzed populations did not seem to influence
persion of the B chromosomes, as their transmission is the frequency of B chromosomes either. This observation
strictly vertical (Munoz et al., 1998). Pairwise FST indicated differs from that of Manrique-Poyato et al. (2015), who
an overall low genetic differentiation; however, some pop- stated that individuals with B chromosomes have low toler-
ulations presented FST with significantly high values ance to high-altitude environments as a result of delay in
(JN–CE and MAC–AL, JN–CE and ST–PE, ST–PE and meiosis due to the presence of B chromosomes that may
ITA–PE, ST–PE and BUI–PE; Table 6). negatively select the host (Hewitt and East, 1978; Harvey
The data from molecular variance (AMOVA), which and Hewitt, 1979).
was greater within the populations (84.68%), when associ- Based on literature evidence that B chromosomes are
ated to Structure data, corroborate the low indices of ge- only transmitted vertically, it is suggested that, for the spe-
netic differentiation, where the presence of a mixture of two cies R. brasiliensis, the broad distribution of B chromo-
genetic profiles is related to migratory habit, wide mobility, somes indeed arises from the extant gene flow among the
and flight capacity of R. brasiliensis (Carbonell, 1988, analyzed populations. The migratory habit coupled to the
1995). Native grasses, for instance Trachypogon sp. (Poa- high flying capacity of R. brasiliensis, besides the wide of-
ceae), constitute the preferred food of grasshoppers (Silva fer of food resources in the sampled localities, are factors
et al., 2006). Therefore, the large offer of grasses in the lo- that certainly contributed to the genetic connectivity of its
calities sampled in this study and the absence of effective populations, and consequently for the broad dispersion of
geographic barriers between the populations are fundamen- the B chromosome. A variant B chromosome, with CH
tal factors for the wide dispersion of the analyzed speci- blocks in the pericentromeric and terminal regions, was de-
mens. The feeding preference of R. brasiliensisis, which is tected and is probably currently in the regeneration stage of
strongly related to its mandibular structure of gramini- the cycle. The presence of one such variant B chromosome
vorous type, is also present in other Gomphocerinae such as reinforces the hypothesis of the non-recent origin of the B
Achurum carinatum (Walker, 1870), Dichromorpha viridis chromosome, considering that successive generations are
(Scudder, 1862) and Orphulella pelidna (Burmaister, necessary for such a chromosome to be nearly neutralized,
1838) (Smith and Capinera, 2005). For other grasshopper accumulate modifications and be dispersed among distinct
species, for instance Mioscirtus wagneri (Eversmann, populations.
1859) and Ramburiella hispanica (Rambur, 1838), a posi-
tive relationship was also observed between the distribu- Acknowledgments
tion of plants used as food and the genetic connectivity We would like to thank all those who have collabo-
between populations (Ortego et al., 2010, 2015). rated to the collections, in particular Mônica Pereira Santos
Although the populations of Pernambuco and other (in memoriam), who also contributed to the cytogenetic
states occupy different altitudes (range 0 to 999 m), as well analysis. We further thank Dr. Ulisses Montarroyos for the
as potential geographic barriers (Borborema Plateau, Cha- colaboration with the statistical analysis. Finally, we thank
pada do Araripe and São Francisco river), R. brasiliensis the funding agencies Coordenação de Aperfeiçoamento de
individuals seem to be capable to overcome these obstacles Pessoal de Nível Superior (CAPES-Brasil, Finance code
and maintain a positive gene flow among the analyzed pop- 001) for the PNPD scholarship of GASC (20130558); Fun-
ulations. This way, no correlation was observed between dação de Amparo a Ciência e Tecnologia de Pernambuco
Table 6 - Mantel test based on pairwise FST in 10 analyzed populations of R. brasiliensis.
Locality ARA - SE MAC - AL JP - PB ITA - PE VIT - PE BUI - PE ST - PE OUR - PE PIC - PI JN - CE
ARA - SE - 208 km 488 km 437 km 374 km 260 km 360 km 475 km 488 km 652 km
MAC - AL 0.113 - 292 km 217 km 165 km 196 km 342 km 523 km 480 km 695 km
JP - PB 0.074 0.112 - 070 km 112 km 300 km 388 km 600 km 497 km 726 km
ITA - PE 0.184 0.183 0.129 - 057 km 269 km 381 km 589 km 499 km 729 km
VIT - PE 0.145 0.128 0.123 0.183 - 216 km 334 km 533 km 458 km 694 km
BUI - PE 0.166 0.161 0.077 0.113 0.203 - 142 km 326 km 284 km 500 km
ST - PE 0.156 0.147 0.171 0.240 0.124 0.226 - 197 km 138 km 363 km
OUR - PE 0.154 0.165 0.119 0.154 0.113 0.146 0.159 - 124 km 163 km
JN - CE 0.179 0.229 0.139 0.130 0.182 0.162 0.224 0.162 - 232 km
PIC -PI 0.128 0.178 0.098 0.127 0.134 0.164 0.191 0.116 0.098 -B chromosomes in Rhammatocerus brasiliensis 11
(FACEPE) for the doctorate degree scholarship of ASM during spermiogenesis, in two grasshopper species. Chro-
(IBPG-0769-2.02/14) and the BCT scholarship of GASC mosoma 126:633–644.
(00632.02/14); and Conselho Nacional de Desenvolvi- Camacho M (2005) B Chromosomes. In: Gregory TR (ed) The
mento Científico e Tecnológico (CNPq–Brazil) for the PQ Evolution of the Genome. Elsevier, San Diego, pp 223-286.
scholarship of RCM (process no. 305298/2014-3). Camacho JPM, Carballo AR and Cabrero J (1980) The B-chro-
mosome system of the grasshopper Eyprepocnemis plorans
subsp. plorans (Charpentier). Chromosoma 80:163–166.
Conflict of Interest Camacho JPM, Shaw MW, López-Léon MD, Pardo MC and
The authors declare that there is no conflict of inter- Cabrero J (1997) Population dynamics of a selfish B chro-
est. mosome neutralized by the standard genome in the grass-
hopper Eyprepocnemis plorans. Am Nat 149:1030–1050.
Camacho JPM, Sharbel TF and Beukeboom LW (2000) B-chro-
Author Contributions mosome evolution. Philos Trans R Soc Lond B Bio Sci
RCM, ASM and MFR, conceived and designed the 355:163–178.
experiments; ASM and APF conducted the experiments; Camacho JPM, Bakkali M, Corral JM, Cabrero J, López-León
ASM, GASC and RCM analyzed the data and wrote the MD, Aranda I, Martín-Alganza A and Perfectti F (2002)
Host recombination is dependent on the degree of parasit-
manuscript; RCM and VL critically revised the manuscript.
ism. Proc R Soc B Biol Sci 269:2173–2177.
All authors read and approved the final version.
Camacho JPM, Shaw MW, Cabrero J, Bakkali M, Ruíz-Estévez
M, Ruíz-Ruano FJ, Martín-Blázquez R and López-León MD
References (2015) Transient microgeographic clines during B chromo-
Anjos A, Loreto V and Cabral-de-Mello DC (2016) Cytogenetics some invasion. Am Nat 186:675–681.
organization of some repetitive DNAs and B chromosomes Carbonell CS (1988) Rhammatocerus schistocercoides (Rehn,
in the grasshopper Eumastusia koebelei koebelei (Rehn, 1906), especie prejudicial para la agricultura en la región
1909) (Orthoptera, Acrididae, Leptysminae). Comp Cyto- centro oeste de Brasil (Orthoptera, Acrididae, Gomphoce-
gen 10:219–228. rinae). Bol Mus Nac Rio de Janeiro 318:1-17.
Araújo S, Pompolo S, Perfectti F and Camacho J (2001) Integra- Carbonell CS (1995) Revision of the tribe Scyllinini, Nov.
tion of a B chromosome into the A genome of a wasp. Proc (Acrididae: Gomphocerinae), with descriptions of new gen-
Biol Sci 268:1127-1131. era and species. Trans Amer Entomol Soc 121:87–152.
Assis-Pujol C (1998) Aspectos morfológicos, taxonômicos e dist- Coleman JJ, Rounsley SD, Rodriguez-Carres M, Kuo A, Was-
ribuição geográfica de cinco espécies de Rhammatocerus, mann CC, Grimwood J, Schmutz J, Taga M, White GJ, Zhou
Saussure, 1861 (Acrididae, Gomphocerinae, Scyllinini). Bol S et al. (2009) The genome of Nectria haematococca: Con-
Mus Nac Rio Janeiro 387:1–27. tribution of supernumerary chromosomes to gene expan-
Banaei-Moghaddam AM, Schubert V, Kumke K, Wei O, Klemme sion. PLoS Genet 5: e1000618.
S, Nagaki K, Macas J, González-Sánchez M, Heredia V, Confalonieri V (1992) B-chromosomes of Trimerotropis pallidi-
Gómez-Revilla D et al. (2012) Nondisjunction in favor of a pennis (Oedipodinae, Acrididae): new effects on chiasma
chromosome: The mechanism of rye B chromosome drive conditions. Caryologia 45:145–153.
during pollen mitosis. Plant Cell 24:4124–4134. Earl DA and Vonholdt BM (2012) Structure Harvester: A website
Banaei-Moghaddam AM, Meier K, Karimi-Ashtiyani R and Hou- and program for visualizing structure output and implement-
ben A (2013) Formation and expression of pseudogenes on ing the Evanno method. Conserv Genet Resour 4:359–361.
the B chromosome of rye. Plant Cell 25:2536–2544. Endo TR, Nasuda S, Jones N, Dou Q, Akahori A, Wakimoto M,
Bauerly E, Hughes SE, Vietti DR, Miller DE, McDowell W and Tanaka H, Niwa K and Tsujimoto H (2008) Dissection of
Hawley RS (2014) Discovery of supernumerary B chromo- rye B chromosomes, and nondisjunction properties of the
somes in Drosophila melanogaster. Genetics dissected segments in a common wheat background. Genes
196:1007–1016. Genet Syst 83:23–30.
Benetta ED, Akbari OS and Ferree PM (2019) Sequence expres- Evanno G, Regnaut S and Goudet J (2005) Detecting the number
sion of supernumerary B chromosomes: Function or fluff? of clusters of individuals using the software STRUCTURE:
Genes 10:123-135. A simulation study. Mol Ecol 14:2611–2620.
Bernardino ACS, Cabral-De-Mello DC, Machado CB, Palacios- Excoffier L and Lischer HEL (2010) Arlequin suite ver 3.5: A
Gimenez OM, Santos N and Loreto V (2017) B Chromo- new series of programs to perform population genetics anal-
some variants of the grasshopper Xyleus discoideus angu- yses under Linux and Windows. Mol Ecol Resour
latus are potentially derived from pericentromeric DNA. 10:564–567.
Cytogenet Genome Res 152:213–221. Ferreira-Neto CA, Cruz GA dos S, Amorim IC, Balbino VQ and
Bueno D, Palacios-Gimenez OM and Cabral-de-Mello DC (2013) Moura RC (2017) Effects of fragmentation and anthropic
Chromosomal mapping of repetitive DNAs in the grasshop- pressure on the genetic structure of Canthon (Peltecanthon)
per Abracris flavolineata reveal possible ancestry of the B staigi (Coleoptera: Scarabaeidae) populations in the Atlantic
chromosome and H3 histone spreading. PLoS One Forest domain. J Insect Conserv 21:267–276.
8:e66532. Gauffre B, Mallez S, Chapuis MP, Leblois R, Litrico I, Delaunay
Cabrero J, Martín-Peciña M, Ruiz-Ruano FJ, Gómez R and Ca- S and Badenhausser I (2015) Spatial heterogeneity in land-
macho JPM (2017) Post-meiotic B chromosome expulsion, scape structure influences dispersal and genetic structure:12 Melo et al.
empirical evidence from a grasshopper in an agricultural sequence between A and B chromosomes in the grasshopper
landscape. Mol Ecol 24:1713–1728. Abracris flavolineata. Mol Genet Genomics
Harvey AW and Hewitt GM (1979) B chromosomes slow devel- 290:1787–1792.
opment in a grasshopper. Heredity 42:397–401. Milani D and Cabral-de-Mello DC (2014) Microsatellite organi-
Henriques-Gil N and Arana P (1990) Origin and substitution of B zation in the grasshopper Abracris flavolineata (Orthoptera:
chromosomes in the grasshopper Eyprepocnemis plorans. Acrididae) revealed by FISH mapping: Remarkable spread-
Evolution 44:747–753. ing in the A and B chromosomes. PLoS One 9:e97956.
Henriques-Gil N, Santos J and Arana P (1984) Evolution of a Milani D, Ramos É, Loreto V, Martí DA, Cardoso AL, Moraes
complex polymorphism in the grasshopper Eyprepocnemis KCM, Martins C and Cabral-de-Mello DC (2017a) The sat-
plorans. Chromosoma 89:290–293. ellite DNA AflaSAT-1 in the A and B chromosomes of the
Hewitt GM and East TM (1978) Effects of B chromosomes on de- grasshopper Abracris flavolineata. BMC Genet 18:81.
velopment in grasshopper embryos. Heredity 41:347–356. Milani D, Palacios-Gimenez OM and Cabral-de-Mello DC
Holsinger K, Lewis P and Dey D (2002) A Bayesian method for (2017b) The U2 snDNA is a useful marker for B chromo-
analysis of genetic population structure with dominant mar- some detection and frequency estimation in the grasshopper
ker data. Mol Ecol 11:1157-1164. Abracris flavolineata. Cytogenet Genome Res 151:36–40.
Izzatullayeva V, Akparov Z, Babayeva S, Ojaghi J and Abbasov Milani D, Bardella V, Ferretti A, Palacios-Gimenez O, Melo A,
M (2014) Efficiency of using RAPD and ISSR markers in Moura R, Loreto V, Song H and Cabral-de-Mello D (2018)
evaluation of genetic diversity in sugar beet. Turkish J Biol Satellite DNAs unveil clues about the ancestry and composi-
38:429–438. tion of B chromosomes in three grasshopper species. Genes
Jetybayev IY, Bugrov AG, Vladimirovna V and Rubtsov NB 9:523-537.
(2018) B chromosomes in grasshoppers: Different origins Munoz E, Perfectti F, Martin-Alganza A and Camacho JPM
and pathways to the modern Bs. Genes 9:509–527. (1998) Parallel effects of a B chromosome and a mite that
Keller D, van Strien MJ, Herrmann M, Bolliger J, Edwards PJ, decrease female fitness in the grasshopper Eyprepocnemis
Ghazoul J and Holderegger R (2013) Is functional connec- plorans. Proc R Soc B Biol Sci 265:1903–1909.
tivity in common grasshopper species affected by fragmen- Oliveira NL, Cabral-de-mello DC, Rocha MF, Loreto V, Martins
tation in an agricultural landscape? Agric Ecosyst Environ C and Moura RC (2011) Chromosomal mapping of rDNAs
175:39–46. and H3 histone sequences in the grasshopper Rhamma-
Loreto V, Cabrero J, López-Léon MD, Camacho JPM and Souza tocerus brasiliensis (Acrididae, Gomphocerinae): Extensive
MJ (2008a) Possible autosomal origin of macro B chromo- chromosomal dispersion and co-localization of 5S
somes in two grasshopper species. Chromosome Res rDNA/H3 histone clusters in the A complement and B chro-
16:233–241. mosome. Mol Cytogenet 4:24.
Loreto V, Cabrero J, López-León MD, Camacho JPM and Souza
Ortego J, Aguirre MP and Cordero PJ (2010) Population genetics
MJ (2008b) Comparative analysis of rDNA location in five
of Mioscirtus wagneri, a grasshopper showing a highly frag-
Neotropical gomphocerine grasshopper species. Genetica
mented distribution. Mol Ecol 19:472–483.
132:95–101.
Ortego J, Aguirre MP, Noguerales V and Cordero PJ (2015) Con-
Machado CB, Neto LCS, Loreto V and Souza MJ (2014) B chro-
sequences of extensive habitat fragmentation in landscape-
mosome prevalence and physical mapping of 18S rDNA and
level patterns of genetic diversity and structure in the Medi-
H4 histone sites in the grasshopper Xyleus discoideus angu-
terranean esparto grasshopper. Evol Appl 8:621–632.
latus (Romaleidae). Genet Mol Res 13:7052–7060.
Makunin AI, Kichigin IG, Larkin DM, O’Brien PCM, Fergu- Palacios-Gimenez OM, Bueno D and Cabral-de-Mello DC (2014)
son-Smith MA, Yang F, Proskuryakova AA, Vorobieva NV, Chromosomal mapping of two Mariner-like elements in the
Chernyaeva EN and O’Brien SJ (2016) Contrasting origin of grasshopper Abracris flavolineata (Orthoptera: Acrididae)
B chromosomes in two cervids (Siberian roe deer and grey reveals enrichment in euchromatin. Eur J Entomol
brocket deer) unravelled by chromosome-specific DNA se- 111:329–334.
quencing. BMC Genomics 17:1–14. Palestis BG, Cabrero J, Robert T and Camacho JPM (2010) Preva-
Manrique-Poyato MI, López-León MD, Gómez R, Perfectti F and lence of B chromosomes in Orthoptera is associated with
Camacho JPM (2013a) Population Genetic Structure of the shape and number of A chromosomes. Genetica
Grasshopper Eyprepocnemis plorans in the South and East 138:1181–1189.
of the Iberian Peninsula. PLoS One 8:e59041. Pinheiro LR, Rabbani ARC, da Silva AVC, da Silva Lédo A,
Manrique-Poyato MI, López-León MD, Cabrero J, Perfectti F and Pereira KLG and Diniz LEC (2012) Genetic diversity and
Camacho JPM (2013b) Spread of a new parasitic B chromo- population structure in the Brazilian Cattleya labiata
some variant is facilitated by high gene flow. PLoS One (Orchidaceae) using RAPD and ISSR markers. Plant Syst
8:e83712. Evol 298:1815–1825.
Manrique-Poyato MI, López-León MD, Cabrero J, Gómez R, Prevost A and Wilkinson MJ (1999) A new system of comparing
Perfectti F and Camacho JPM (2015) Geographical barriers PCR primers applied to ISSR fingerprinting of potato culti-
impeded the spread of a parasitic chromosome. PLoS One vars. Theor Appl Genet 98:107–112.
10:e0131277. Pritchard JK, Stephens M and Donnelly P (2000) Inference of
Marques A, Klemme S and Houben A (2018) Evolution of plant B population structure using multilocus genotype data. Genet-
chromosome enriched sequences. Genes 9:515. ics 155:945–959.
Menezes-de-Carvalho NZ, Palacios-Gimenez OM, Milani D and Rahimi A, Mirmoayedi A, Kahrizi D, Zarei L and Jamali S (2016)
Cabral-de-Mello DC (2015) High similarity of U2 snDNA Genetic diversity of Iranian honey bee (Apis mellifera medaB chromosomes in Rhammatocerus brasiliensis 13
Skorikow, 1829) populations based on ISSR markers. Q Rev L.) based on RAPD and ISSR DNA markers. Adv Environ
Biol 83:117–117. Biol 13:9-12,
Ramos É, Cardoso AL, Brown J, Marques DF, Neill RJO and Sokal RR and Rohlf FJ (1995) Biometry. 3rd edition. Freeman,
Martins C (2016) The repetitive DNA element BncDNA, New York, pp 813–819.
enriched in the B chromosome of the cichlid fish Astatoti- Spiegelhalter DJ, Best NG, Carlin BP and van der Linde A (2002)
lapia latifasciata, transcribes a potentially noncoding RNA. Bayesian measures of model complexity and fit. J R Stat Soc
Chromosoma 126:313–323. Ser B Statistical Methodol 64:583–639.
Sumner A (1972) A simple technique for demonstrating centro-
Remis MI (1989) Effects of supernumerary heterochromatin on
meric heterochromatin. Exp Cell Res 75:304–306.
chiasma condition in two species of Acrididae (Orthoptera).
Taylor SJ, Downie DA and Paterson ID (2011) Genetic diversity
Genetica 79:53–61.
of introduced populations of the water hyacinth biological
Riera L, Petitpierre E, Juan C, Cabrero J and Camacho JPM control agent Eccritotarsus catarinensis (Hemiptera:
(2004) Evolutionary dynamics of a B chromosome invasion Miridae). Biol Control 58:330–336.
in island populations of the grasshopper Eyprepocnemis Valente GT, Conte MA, Fantinatti BEA, Cabral-de-Mello DC,
plorans. J Evol Biol 17:716–719. Carvalho RF, Vicari MR, Kocher TD and Martins C (2014)
Roldán-Ruiz I, Loose M and Van Bockstaele E (2000) AFLP Origin and evolution of B chromosomes in the cichlid Fish
markers reveal high polymorphic rates in ryegrass (Lolium Astatotilapia latifasciata based on integrated genomic anal-
spp.). Mol Breed 6:125–134. yses. Mol Biol Evol 31:2061–2072.
Ruiz-Ruano FJ, Cabrero J, López-León MD and Camacho JPM Varshney RK, Chabane K, Hendre PS, Aggarwal RK and Graner
(2017) Satellite DNA content illuminates the ancestry of a A (2007) Comparative assessment of EST-SSR, EST-SNP
supernumerary (B) chromosome. Chromosoma and AFLP markers for evaluation of genetic diversity and
126:487–500. conservation of genetic resources using wild, cultivated and
Sambrook J and Russell D (2001) Molecular cloning, a laboratory elite barleys. Plant Sci 173:638–649.
manual. 3rd edition. Cold Spring Harbor Laboratory Press, Yeh F, Yang R and Boyle T (1999) Microsoft Windows-based
New York, vol. 2. free ware for population genetic analysis (Release 1.31).
University of Alberta, Edmonton.
Silva RA, Jesus CR, Silva WR and Costa NL (2006) Ocorrência
Zurita S, Cabrero J, López-León MD and Camacho JPM (1998)
de gafanhotos em áreas de cerrados de Mazagão, Amapá.
Polymorphism regeneration for a neutralized selfish B chro-
Embrapa Amapá, Macapá, 5 pp.
mosome. Evolution 52:274–277.
Smith TR and Capinera JL (2005) Mandibular morphology of
some floridian grasshoppers (Orthoptera: Acrididae). Flo- Associate Editor: Klaus Hartfelder
rida Entomol 88:204–207.
License information: This is an open-access article distributed under the terms of the
Snegin EA (2014) Analysis of gene flow between generations of Creative Commons Attribution License (type CC-BY), which permits unrestricted use,
various years in population of stag beetle (Lucanus cervus distribution and reproduction in any medium, provided the original article is properly cited.You can also read