Subjective satisfaction and objective electricity poverty reduction in Vietnam, 2008-2018
←
→
Page content transcription
If your browser does not render page correctly, please read the page content below
The current issue and full text archive of this journal is available on Emerald Insight at:
                          https://www.emerald.com/insight/2635-0173.htm

     Subjective satisfaction and                                                                                              Electricity
                                                                                                                                poverty
     objective electricity poverty                                                                                          reduction in
                                                                                                                               Vietnam
  reduction in Vietnam, 2008–2018
                                            Minh Ha-Duong
                                  CIRED, CNRS, Paris, France, and
                                                                                                                          Received 20 March 2021
                                           Hoai-Son Nguyen                                                                    Revised 5 June 2021
                        National Economics University, Hanoi, Vietnam                                                      Accepted 17 June 2021

Abstract
Purpose – The authors estimate the reduction of electricity poverty in Vietnam. The essential argument is that
human development is about subjective feeling as much as technology and income.
Design/methodology/approach – The authors use a self-reported satisfaction indicator as complementary
to objective indicators based on national household surveys from 2008 to 2018.
Findings – In 2010, the fraction of households with access to electricity was over 96%. However, over 24%
declared their electricity use did not meet their needs. Since 2014, the satisfaction rate is around 97%, even if
25% of the households used less than 50 kWh/month. Today there is electricity for all in Vietnam, but
electricity bills weigh more and more in the budget of households.
Practical implications – The subjective energy poverty measure allows better international statistics:
unlike poverty or needs-based criteria, self-assessed satisfaction of needs compares across income levels and
climates.
Social implications – Inequalities in electricity use among Vietnamese households decreased during the
2008–2018 period, but are not greater than inequalities in income, contrary to the findings of Son and
Yoon (2020).
Originality/value – Engineering and econometric objectivist approaches dominate the literature on
sustainability monitoring. Out of 232 sustainable development goal (SDG) indicators, only two are subjective.
Yet the findings show that subjective indicators tell a different part of the story. Access is not grid building, but
the meaningful provision of electricity to satisfy the needs.
Keywords Electricity, Poverty, Vietnam, Sustainable development goals, Indicators
Paper type Research paper

1. Introduction
The seventh United Nations sustainable development goal (SDG 7) is to “ensure access to
affordable, reliable, sustainable and modern energy.” In short, “affordable and clean energy”

JEL Classification — Q41, Q48, Q56
    © Minh Ha-Duong and Hoai-Son Nguyen. Published in Fulbright Review of Economics and Policy.
Published by Emerald Publishing Limited. This article is published under the Creative Commons
Attribution (CC BY 4.0) license. Anyone may reproduce, distribute, translate and create derivative works
of this article (for both commercial and non-commercial purposes), subject to full attribution to the
original publication and authors. The full terms of this license may be seen at http://creativecommons.
org/licences/by/4.0/legalcode
    NHS provided the initial idea and the data, and HDM directed the research. The two authors
contributed to the statistical analysis and writing. This work was started while the first author was a
visiting professor at the Clean Energy and Sustainable Development Lab (CleanED/USTH). Early
versions of this work were presented at the CIRED research seminar, the tenth Vietnam Economist
Annual Meeting and the first online conference of the International Association of Energy Economists.
                                                                                                                        Fulbright Review of Economics
The authors gratefully acknowledge comments from our colleagues Audrey Berry, Franck Nadaud,                                                and Policy
Nguyễn Trinh Hoang Anh and Rodica Loisel and anonymous reviewers. The authors declare no conflict                          Emerald Publishing Limited
                                                                                                                                             2635-0173
of interest.                                                                                                            DOI 10.1108/FREP-03-2021-0022
FREP                is one of our overarching civilization goals this millennium. Statisticians usually measure
                    progress toward SDG 7 using objective indicators based on electricity distribution and
                    consumption data. We argue that objective indicators are not enough. Human development is
                    an issue of subjective feeling as much as a question of technology or economics. Based on
                    national household surveys, self-reported satisfaction indicators offer a complementary
                    perspective to understand a society’s energy poverty situation more fully.
                        Vietnam is a Southeast Asia country comprising almost 100 million people. The
                    country’s gross domestic product (GDP) per capita, purchasing power parity, was USD
                    8397 in 2019 (World Bank database, accessed 2021-05-22). The country’s development has
                    been highly successful in economic terms. In constant local currency, the GDP grew by
                    541% from 1986 to 2019. Table 1 provides details of the country’s trajectory. Vietnam’s
                    rural electrification program is oft-cited as an outstanding success in providing energy
                    access (Ðoan, 2010; Asian Development Bank, 2011). However, in the considerable
                    academic literature on energy poverty, among the reports on China, India, Brazil and South
                    Africa (Li, Pan, & Wei, 2015; Sovacool, Mukherjee, Drupady, & D’Agostino, 2011;
                    Baltruszewicz, Steinberger, Ivanova, Brand-Correa, Paavola, & Owen, 2021), we found few
                    studies about Vietnamese households.
                        L^e (2020) investigated residential electricity demand in Vietnam using a different
                    microdata source, the 2015 Vietnam Household Registration Survey. He found that demand is
                    elastic to average and marginal prices and confirmed that income elasticity is positive. We
                    examine residential demand from a different perspective—energy poverty—using different
                    data: the Vietnam Households Living Standard Surveys (VHLSS) from 2008 to 2018.
                        Son & Yoon (2020) examined the determinants of inequality in Vietnamese households’
                    electricity consumption, using VHLSS data from 1993 to 2004. Inequality can be defined, at
                    the population level, by how much the statistical distribution of consumption deviates from
                    the uniform distribution. They found that (1) electricity consumption increased more than
                    proportionally with income and (2) the inequality of electricity consumption was larger
                    than income inequality. The grid expanded continuously from 1993 to 2004, increasing
                    electricity access. Son and Yoon warned that increasing access could increase inequality as
                    wealthier households benefited more from the opportunity. Those who cannot afford to buy
                    electric appliances benefit less from rural electrification. Our analysis of recent data
                    corroborates their first finding: Electricity consumption increased faster than income
                    between 2008 and 2018. We do not confirm their second finding. In 2018, electricity

                    Year                               2008       2010        2012         2014         2016         2018

                    Population (Thous. pers.)         85,119     86,947      88,809       90,729       92,695        94,666
                    GDP at constant 2010 prices,       1,889      2,158       2,413        2,696        3,054         3,493
                    trillion VND
                    GDP per capita, PPP constant       4,628      5,089       5,574        6,098        6,767         7,586
                    2017 USD
                    Consumer price index, base          123         144         186          206          213          228
                    100 in 2007
                    Share of population in urban      29.0%      30.5%       31.8%        33.1%        33.9%         34.5%
                    areas
                    Electricity production, annual   71.0 TWh   91.7 TWh    115.1 TWh   141.2 TWh    175.7 TWh    209.2 TWh
                    Electricity production, annual   834 kWh    1,055 kWh   1,297 kWh   1,557 kWh    1,896 kWh    2,221 kWh
                    per person
Table 1.
Vietnam’s economy   Note(s): Economic and political reforms launched in 1986 have transformed Vietnam from one of the world’s
and electricity     poorest nations to a lower-middle-income country
conditions in       Source(s): General Statistics Office, accessed 2021-02-08 and World Bank for GDP based on purchasing
2008–2018           power parity (PPP)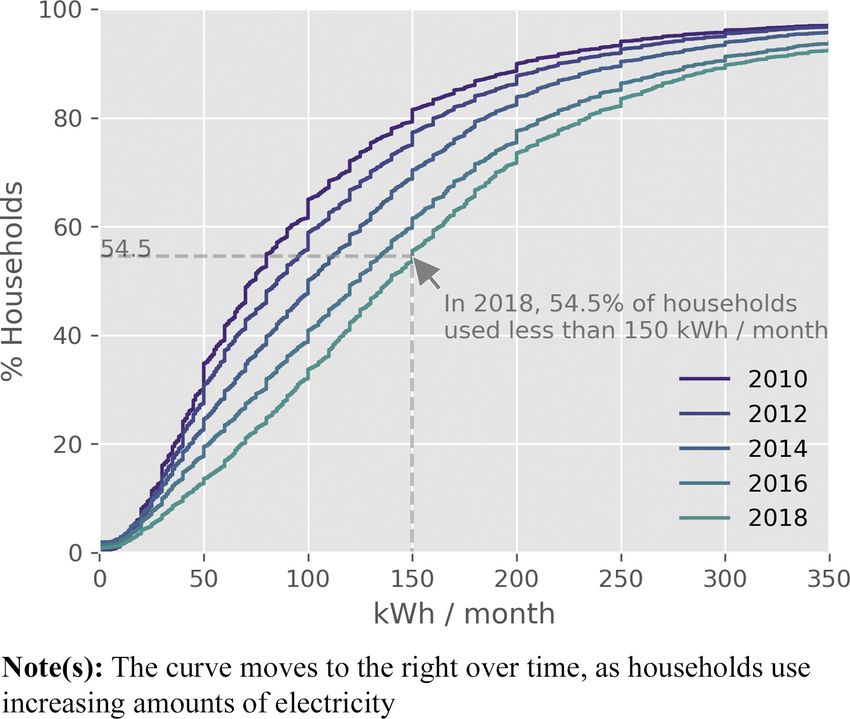
consumption inequality seemed comparable to or less than income inequality (see                   Electricity
Supplementary Figure 5).                                                                            poverty
    Analyzing the evolution of the energy consumption of Vietnamese households from 2004
to 2016, Nussbaumer, Bazilian, & Modi (2012) found that “[e]lectricity poverty has decreased,
                                                                                                reduction in
but energy-cost poverty has increased.” Our analysis vindicates these findings. We clarify         Vietnam
and confirm the discrepancy between electricity poverty and electricity-cost poverty using
recent data.
    The paper is organized as follows. We contrast the objective and subjective perspectives
used to observe electricity poverty in section 6. Then we present the data and methods in
section 10 before examining Vietnamese households’ electricity consumption from 2008 to
2018 from three points of view in sections 11 through 17: the engineering perspective (grid
access and kilowatts per hour consumed), the economic perspective (income and
expenditures) and the subjective perspective (satisfaction with electricity consumption).
Then we discuss the interactions between the three perspectives in section 20. The findings
highlight how much the subjective indicator complements objective engineering or economic
indicators. We discuss the results and policy implications and compare them with other
member states of the Association of Southeast Asian Nations (ASEAN), in section 8. We
summarize the paper and conclude in section 9.

2. What is access to clean and affordable energy for all?
The Sustainable Development Solutions Network (SDSN, 2015, pp. 137–140) defined four
performance indicators that assess progress toward SDG 7 (ensure access to affordable,
reliable, sustainable and modern energy for all): share of the population with access to
modern cooking solutions (percentage; Indicator 50), the share of the population with
access to reliable electricity, by urban and rural (percentage; Indicator 51), implicit
incentives for low-carbon energy in the electricity sector (measured as USD/MWh or USD
per ton avoided CO2; Indicator 52) and the rate of primary energy intensity improvement
(Indicator 53).
    Although all four dimensions of SDG 7 matter, we focus on the dimension measured by
Indicator 51, access to reliable electricity. We distinguish three perspectives on access to
electricity. The engineering perspective sees access as the presence of the distribution
network. The economic perspective focuses on affordability. Finally, the subjective
perspective focuses on whether users feel that their electricity needs are satisfied. We
contend that the subjective perspective solves many problems found in the economic
literature on energy poverty.
    Atkinson (1987) explained that poverty can be seen as a concern about basic needs, which
are multidimensional: food, housing and clothing. In this viewpoint, energy poverty can be
seen as deprivation of the energy needs for survival. Energy-poor households cannot afford
to fight cold in winter or heat in summer. How can we measure the magnitude of energy
poverty in a given country? In the subjective perspective, this is straightforward: Use a
survey asking whether the household’s energy use met their needs in the previous month.
The economic perspective is more complex. There are three approaches to defining and
measuring energy poverty.
    The first approach is to estimate “basic needs” directly by calculating the minimum
energy services required for a household. Bravo, Mendoza, Legisa, Suarez, & Zyngierman
(1983), cited in He & Reiner (2016), enumerated energy needs to prepare and preserve food and
a water supply, for space conditioning, personal cleanliness, and recreation and social
communication. Pachauri, Mueller, Kemmler, & Spreng (2004) computed the power
requirements for energy services of a five-member household such as “scooter 5 km/day”,
“Lighting, one electric bulb (5 h/day, 40 W)” and “Lighting, 1–2 kerosene lamps”.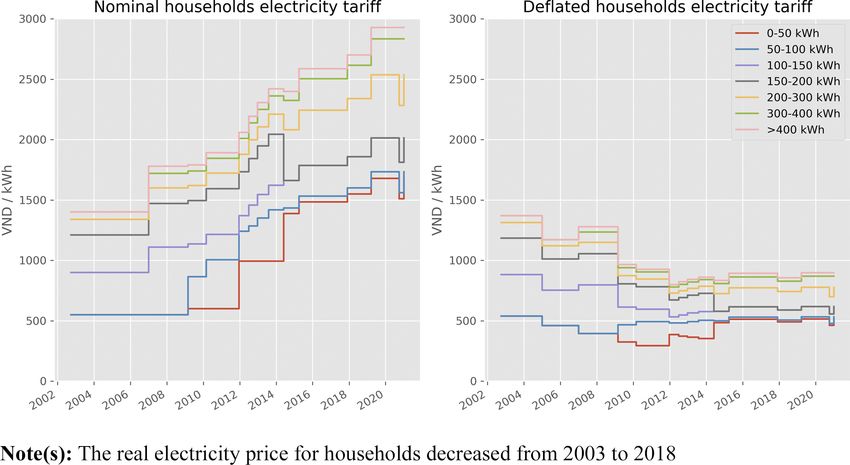
FREP       This basic needs direct estimate approach is appropriate on a case-by-case basis, at the
       scale of communities, but not for international statistics. Different societies have different
       views on what kinds of energy services constitute basic needs. Needs vary with climate,
       region, household demographics and even ethnocultural habits (Pachauri, Mueller, Kemmler,
       & Spreng, 2004). Asking experts about local conditions is open to subjectivity and lacks
       legitimacy.
           The second approach sets up absolute thresholds for the total energy consumption
       regardless of the consumption components. Energy-poor households consume less than X
       kWh per year, where X depends on the country’s economic conditions. Foster, Tre, & Wodon
       (2000) defined the threshold as the average energy consumption of households whose
       expenditure per capita within 10% of the official poverty line.
           This approach is convenient. A poverty line is readily available in every country.
       However, the underlying assumption that income-poor households are also energy-poor
       households is not always valid (Khandker, Barnes, & Samad, 2012).
           The third approach sets up relative thresholds. Energy-poor households are those spending
       more than X % of their income on energy bills. The Department of Trade and Industry (DTI,
       2007) stated that a household is energy poor if the household spends more than 10% of its
       income on paying the energy bill, including electricity and fuel for heating and cooking,
       excluding transportation. This threshold was set out officially in the United Kingdom (UK) Fuel
       Poverty Strategy 2001, according to Hills’ (2012) critical study. France also used this approach,

       according to the Observatoire National de la Precarite Energ etique (2016).
           This approach is convenient. It assesses the magnitude of the energy affordability issue
       from national-scale statistics. Unfortunately, the approach has fatal flaws. The ratio is
       arbitrary; there are no universal norms for the share of electricity in a household budget.
       Moreover, many consumers with a relatively high energy bill are affluent households living
       large, while many poor households have a low energy bill because they use non-commercial
       biomass.
           The three approaches to energy poverty reviewed above are based purely on energy
       quantities, monetary indicators, or their combination. They all come from an engineering or
       econometric approach. To fix their theoretical problems, researchers and practitioners have
       proposed more sophisticated objective approaches. Hills (2012) led the UK to replace the 10%
       of income criterion with a new definition under which households are considered fuel poor if
       (1) they have required fuel costs that are above the median level and (2) were they to spend
       that amount they would be left with residual income below the official poverty line.
       Econometric approaches based on electricity demand elasticity were explored by Khandker,
       Barnes, & Samad, 2012 for energy poverty in Bangladesh, He & Reiner (2016) for electricity
       poverty in China and Nguyễn & Ha Dương (2017, 2019) for electricity poverty in Vietnam.
       Finally, multidimensional energy poverty indices were proposed by Nussbaumer, Bazilian, &
       Modi (2012), Foster, Tre, & Wodon (2000) and Pachauri, Mueller, Kemmler, & Spreng (2004),
       and the multitier matrix for measuring access to household electricity supply was proposed
       by Bathia & Angelou (2015).
           In contrast to these objective approaches, the subjective perspective is more
       straightforward. It defines the quality of energy services by user satisfaction, not in terms
       of electricity or money quantities measured externally. We argue that concerning Indicator
       51, the definition “share of households replying positively” to the question “In the last month,
       did your consumption of electricity meet the needs of your household?” is as operational as
       the classical definition “share of population with access to reliable electricity”. The belief that
       objective engineering and economic indicators are more scientific than indicators based on
       subjective self-assessment is unfounded.
           There is prejudice in the opposition between scientific approaches. The subjective
       definition prescribes a clear way to measure the phenomenon. Humanities and social sciences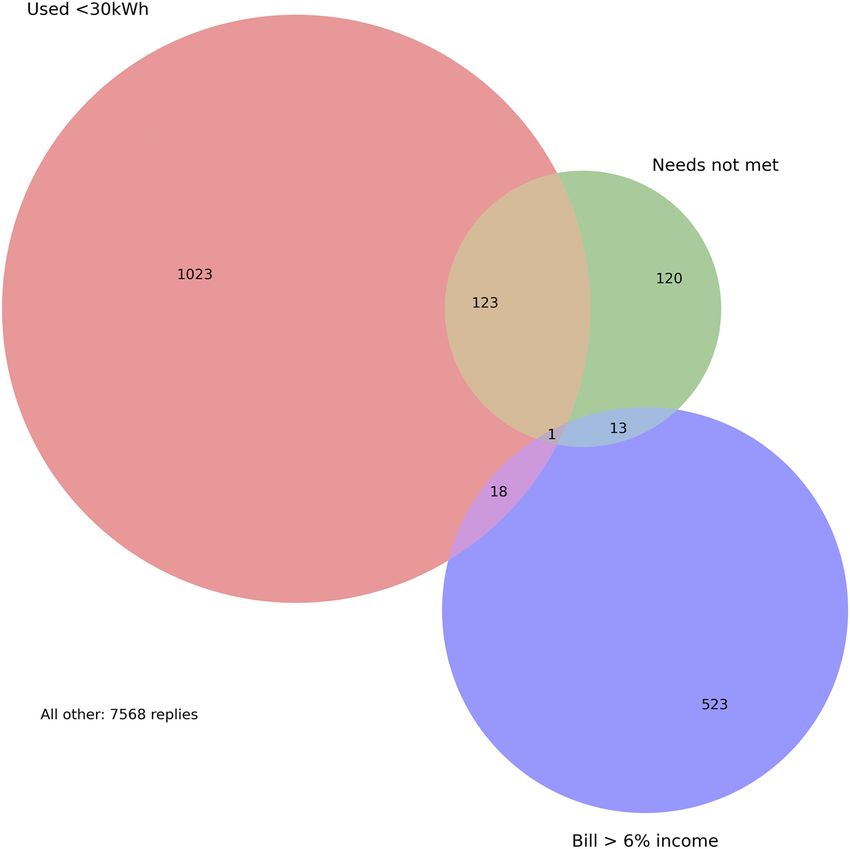
have long integrated the need to include the subjects’ voices in their research methods,             Electricity
including subjective opinion surveys. Surveys provide objectively repeatable measurements:             poverty
Two independent survey companies applying the same method will find similar results.
    The objective approach is not as unambiguous as it may seem. Engineering-based
                                                                                                   reduction in
indicators also have imprecision and declaration biases. This is true when data are collected         Vietnam
from declarative surveys and when data are collected from electricity bills (fraud exists). The
concepts of “reliable” and “access” leave room for interpretation. It is unclear whether
“access” is the physical connection to the grid or is the economic means to pay for electricity.
Furthermore, “reliable” is vague. Is there a threshold of outage minutes per year? As extreme
weather can cause a blackout, at which probability is access considered reliable? Do we even
have probabilities? Regarding the basic needs approach, to determine the adequacy of
someone’s habitat objectively, one has to examine its floorplan, building material, insulation,
heating, ventilation systems, the local climate and the age of the inhabitants. It is much
simpler just to ask.
    Leaving it up to respondents to assess the “needs of your household” resolves the central
problem of defining a “basic needs” level. Households themselves know best if their electricity
needs were met. Multidimensional energy poverty indices rely on normative aggregation
methods that are hard to justify, whereas households have the legitimacy to integrate the
different aspects of their energy consumption experience. Rebound effects in rural
electrification projects show that needs are subjective and relative. Human needs expand
with economic development.
    Contrary to objective and absolute definitions of basic needs, indicators defined by self-
assessed satisfaction of needs can be used at different income levels, within and across
countries. Ensuring access to modern energy for all (the SDG 7) does not mean bringing the
grid close to every house, as Indicator 51 measures. It means everyone is provided sufficient
energy services.

3. Data and method
In light of the previous discussion, we use three approaches to examine progress toward SDG
7 in Vietnam. From the engineering point of view, we investigate the access and quantity of
electricity consumption. From the economic point of view, we examine the share of electricity
in the household budget. From the subjective point of view, we examine customer
satisfaction, in the form of the answer to the question, “In the last month, did your
consumption of electricity meet the needs of your household?”
    The data come from periodic national population surveys: the Household Living
Standards Surveys (General Statistics Office, 2019). Conducted by the National Statistics
Office in the Ministry of Planning and Investment, the surveys aim to systematically collect
basic information about population and housing as a basis for research and for assessing and
formulating policy mechanisms, programs, targets and plans for national socio-economic
development generally and for the population and housing sectors in particular. The agency
is independent of EVN, the national electricity company.
    In 2008, the survey had two waves lasting two months each, starting in May and September.
In 2014, there were four waves lasting one month each, in March, June, September and December.
This reduces the seasonality bias of energy consumption. Households were randomly assigned
to the waves. The question on needs met was asked in 2010, 2012 and 2014 only. We did not
weigh answers, de-bias, or otherwise adjust the data except by clipping outlying values and
dropping missing responses. Clipping does not affect the counts and quantiles, but non-
responses are known to affect survey results. We were not involved in the data collection.
    The results we present are subject to systematic and random errors unavoidable in all
survey data (Kasprzyk, 2005). We did not attempt to quantify these errors formally, but we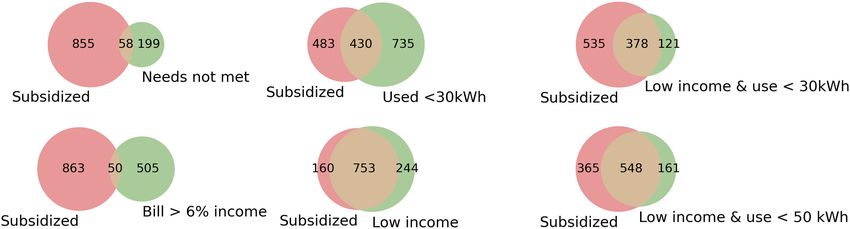
FREP              note that in the numbers presented below, the third digit is not policy-relevant. It is
                  meaningful mathematically only. We drew the maps in Figures 1 and 4 without tone intensity
                  correction for province size and province population: They reflect energy poverty levels
                  within a province. Thus, a large gray area does not imply that a large number of people are
                  impacted because provinces in remote mountains are less densely populated than provinces
                  in the river deltas.

                  4. The engineering view: is electrification complete?
                  Much has changed since Nguyễn & Lefevre (1996) analyzed household energy demand based
                  on a 1992 survey conducted in four provinces. At that time, 91% of the energy used by
                  households was for cooking and pig feed. Cooking was mostly with coal and residues;
                  electricity was used by less than 2% of rural households and 6% of urban households.
                  Households commonly used kerosene and electricity for lighting. This contrasts with the
                  recent survey by L^e & Pitts (2019), which showcased air conditioning as the key driver of
                  energy consumption for households living on Vietnam’s south-central coast.
                     Van Bınh Ðoan (2010) described electricity access in Vietnam as follows:
                     Vietnam has gone through a rapid increase in electrification since 1990, where electrification levels
                     jumped from a pre-policy reform rate of less than 50% in the late 1980s–early 1990s to 77% by 2001
                     and 96% by 2009. The Electrification Programme driven by the Vietnamese government has
                     resulted in increased access for 82 million people between 1976 and 2009. One million people,
                     primarily in the northern mountainous regions of Vietnam, are currently without access to
                     electricity.
                  To revisit these numbers in 2018, we used answers to the survey question, “What is the main
                  lighting mean in your household?” which had four options: (1) national-grid electricity; (2)
                  battery or generator or small-scale hydroelectricity; (3) gas, oil lamps of various kinds; and (4)
                  other. Figure 1 shows the percentage of households that did not choose option 1 (national-grid
                  electricity). This is a proxy for the state of electrification during the 2008–2018 period. It shows
                  that the situation in the northern mountainous regions of Vietnam has improved over the last 10
                  years, but has not been completely resolved. There are still not many roads in these areas. The
                  cost of these grid connections is high compared to the number of households serviced.
                      Concerning the overall population, the analysis shows that in 2010, 96.5% of households
                  in Vietnam used grid electricity for lighting. This number increased to 98.9 % in 2018. Our

Figure 1.
Progress of
electrification
estimate for 2018 is close to the 99.1 % published in General Statistics Office (2019, p. 500); Electricity
and consistent with EVN’s (2019, pp. 14, 19) statement: “EVN provided 100% of communes, poverty
more than 99% of rural households, and 11/12 districts of islands with electricity access.”
Considering that the population totals 94.7 million and that households without access are
reduction in
likely to have more members than the national average, we estimate that the number of Vietnam
people without electricity access in Vietnam was still about 1 million in 2018. The number of
people without access declined slowly over the period, as Van Bınh Ðoan’s description
remains relevant. The positive way to see the evolution is that the number of people with
access increased as fast as the population, almost 1 million per year.
Figure 2 shows the amount of electricity households declared they had used in the
previous month. In 2018, the median electricity consumption was 139 kWh per month and
81 kWh in the first quartile. In other words, that year, out of four Vietnamese households, one
used less than 81 kWh per month, and one used between 81 kWh and 139 kWh. During the
2010–2018 period, the distribution shifted to the right toward higher quantities. The median
electricity consumption per Vietnamese household in the surveyed month increased from
74 kWh to 139 kWh in these eight years.
During that period, the use of electricity by Vietnamese households moved toward a more
uniform distribution. As apparent in Supplementary Figure 5, inequality in electricity
consumption decreased faster than inequality in income during that period.
5. The economic view: is electricity affordable for all?
Figure 3 shows the electricity tariffs in Vietnam from 2004 to 2018. There are many curves
because the tariff is an increasing staircase function: The more one consumes electricity, the
higher the marginal tariff. In 2010, for example, for electricity consumers paid 600 VND/kWh
for the first 50 kWh, then 1004 VND/kWh from the 51st kWh to the 100th kWh and so on (see
Supplementary Figure 1).
Increasing block tariffs for electricity, water, or gas are popular in many countries because
they offer policymakers a tool for addressing equity and efficiency concerns. First, as far as
Figure 2.
Monthly electricity
consumption by
household in Vietnam,
cumulative
distributionsFREP
Figure 3.
Electricity block tariff
for households in
Vietnam, in nominal
terms (left) and
adjusted for
inflation (right)
power demand correlates with wealth, an increasing block tariff improves equity. It gives
poor households access to electricity at a relatively low price. The first block can be provided
at a tariff lower than production costs, enacting solidarity between users. Second, an
increasing block tariff may improve energy efficiency. It presents higher marginal costs of
electricity to households with higher electricity consumption. That tends to reduce wasteful
uses and moderate the growth of their electricity demand.
The right panel in Figure 3 shows that the government kept electricity tariffs under
control during the high-inflation years after the 2008 global economic crisis (Nguyễn, 2010).
This contributed to protecting poorer consumers and mitigated inflation. Tariffs eventually
caught up when the inflation cooled down, but in real terms, Vietnamese households faced
cheaper electricity bills in 2020 than in 2010.
The average electricity tariff in Vietnam is low compared to other countries. In 2014, for
example, it was 0.08 USD/kWh. Among 29 major countries in Asia and the Pacific, only
Bhutan, Mongolia and Myanmar had a lower tariff (World Bank, 2020, p. 68).
Table 2 displays the budget effort indicator, defined as the weight of the electricity bill in a
household’s budget (also Supplementary Figures 2 and 3). Electricity is affordable in
Vietnam, meaning that the budget effort remains at a modest level. In 2018, the median
household electricity budget effort was 2.4% of income. This compares favorably with other
countries. For example, according to International Energy Consultants (2016):
In the Philippines [. . .] the average size (170 kWh/month) household spent an estimated 4.5% of
monthly disposable income on electricity in January 2016 (down from >6% in 2012). The average
spend of 44 markets surveyed was 3.9%, ranging from a low of 1.5% in Taiwan to a high of 8.2% in
Portugal.
Supplementary Figure 4 shows that 95% of Vietnamese households spent less than 7% of
their income on electricity.
However, Table 2 shows a trend suggesting that the cheap electricity years may not last.
The median budget effort was 1.5% in 2010 as a result of the 2008–2010 electricity price
control. After that, the effort increased by 50% between 2010 and 2018. As households
become more affluent over time, it is normal that they consume more, and that their bills
increase in nominal and in real terms. We see not only this development but also that
electricity expenses have increased faster than income.Economists talk about a luxury or a superior good when the fraction of the budget spent Electricity
purchasing the good increases when the household’s income increases. However, this evidence poverty
does not imply that electricity is always a luxury or superior good for everybody. First, as
shown above, the relative price of electricity declined over the 2010–2020 period, which can
reduction in
explain part of the demand increase. Second, the econometric analysis presented by Nguyễn & Vietnam
Ha Dương (2019, chapter 6) showed that the electricity consumption of households in lower-
income quantiles is inelastic to income. Electricity is an essential good for poor households.
6. The subjective view: are electricity needs met?
The responses to Question 12 on the 2010, 2012 and 2014 VHLSS surveys are summarized in
Table 3 (“Has your electricity usage [.. . .] been sufficient to meet needs over the last 30 days?”).
The table shows that in 2010, one out of four households in Vietnam declared that their
electricity consumption was not sufficient to meet their needs. That ratio dropped to less than
5% in 2012 and less than 3% in 2014.
Figure 4 maps this rapid progress in satisfaction between 2010 and 2012. The subjective
indicator shows that during the 2010–2012 period, there was significant progress toward
meeting SDG 7. How can we explain it?
A systematic survey error may be present. However, according to the survey
documentation, the question’s wording was the same in 2010, 2012 and 2014.
Expanded energy access is not the only explanation. There is a correlation between access
and satisfaction; see Figures 1 and 4. Satisfaction increased much faster compared to the
relatively slow progress of the grid.
Energy-use expectations and behaviors are known to adjust. Could it be that households
were more able to meet their needs with what was provided? We believe this effect may work
in the opposite direction, given that the equipment levels increased. Regarding households’
demand for electricity, the General Statistics Office of Vietnam (2015, p. 26) stated that:
The percentage of households with fixed or mobile telephones reached 85%, the rate of households
using a computer was 25.1%, the rate of households using a washing machine reached 30.9%, and
the rate of households using refrigerators was 59.0%. All of these were at least twice as high as the
Year 2008 2010 2012 2014 2016 2018
Households not paying anything 3.5% 3.6% 3.2% 2.3% 1.4% 1.1%
Households paying more than 6% of their income for 2.5% 2.3% 3.0% 5.1% 6.2% 7.9%
electricity bill
Half of the households pay less than __% of income 1.6% 1.5% 1.8% 2.1% 2.3% 2.4% Table 2.
95 % of the households pay less than __% of income 4.7% 4.6% 5.2% 6.0% 6.4% 7.0% Electricity bill as a
Source(s): Authors, from VHLSS data fraction of income
Survey year 2010 2012 2014
n 5 9251 n 5 9237 n 5 9266
Not sufficient 24.4% 4.8% 2.8%
Sufficient 72.6% 89.6% 90.9% Table 3.
More than sufficient 3.0% 5.6% 6.3% Answers to question
Note(s): “Has your household’s consumption of electricity over the last 30 days been sufficient to meet its Q12 on the 2010, 2012
needs?” and 2014FREP
Figure 4.
Progress of satisfaction
levels
indicators in the 2009 Census. In addition, the rate of households using air conditioning stood at
13.3%, nearly three times higher than the rate in the 2009 Census.
We cannot rule out a fluke due to need variations. Energy demand is known to be sensitive to
weather, which is random. The weather in 2010 was warmer than in 2012 and 2014. The
heatwave could have led to exceptionally high cooling needs and shortages due to low flows
to hydropower stations. A small fraction of households had air conditioning at that time, but
fans also require electricity. However, we offer a simpler explanation.
We conjecture that satisfaction increased between 2010 and 2012 because the reliability of
the electricity supply improved. In 2010, there were many shortages due to delays in adding
new coal power plants. After 2010, reserve generation capacity increased, and that improved
reliability. According to the IEA (accessed 2021-02-08), the Vietnamese residential sector
consumed 31.5 TWh in 2010, 38.4 TWh in 2012 and 45.7 TWh in 2014. The 50% growth in
four years shows there was unsatisfied demand in 2010. Numbers for 2010 are not available,
but according to the EVN (2016) annual report, the system average interruption duration
index increased from 8077 minutes per customer in 2012 to 3134 minutes in 2014.
The subjective indicator provides an integrated measure of the quality of service. People’s
impressions are not as much based on averages of physical and economic flows as on extreme
events: A power outage during a heatwave or cold wave will be remembered.
7. Interactions between the three viewpoints
In section 4, we discussed the engineering viewpoint (access to electricity and quantities
consumed). In section 5, we examined the economic viewpoint (tariffs and the weight of the
electricity bill in households’ budget). In section 6, we discussed the subjective viewpoint
(satisfaction of electricity needs). Only that viewpoint allowed us to see the qualitative jump
between 2010 and 2012.
In this section, we examine the interactions between the three viewpoints quantitatively.
Figure 5 shows the number of respondents of the VHLSS, 2014 who met three different
criteria for energy poverty: using less than 30 kWh per month, spending more than 6% of
income on electricity and declaring their electricity consumption did not meet their needs. The
first two are objective; the third is subjective. The precise limits for the objective criteria are
arbitrary, but the qualitative result does not depend on it: There is little overlap between the
three energy poverty indicators.Electricity
poverty
reduction in
Vietnam
Figure 5.
Interactions between
the electricity poverty
criteria in VHLSS, 2014
Consider first the interaction between the energy poverty bar idea based on electricity
consumption and the subjective indicator of needs not met. Table 4 shows that in 2014, the
electricity consumption of households with unsatisfied needs tended to be lower than in the
rest of the population. In 2014, half of the households in Vietnam that declared their electricity
needs were not met used less than 25 kWh per month.
All households Households declaring electricity consumption
(n 5 9359) did not meet their needs (n 5 235)
Median electricity used in the 100 kWh 25 kWh
last month
Interquartile range 52–168 kWh 0–87 kWh
5–95th percentile range 16–325 kWh 0–200 kWh Table 4.
Households declaring
Median effort (ratio electricity 2.1% 0.9% their electricity
bill/budget) consumption did not
Interquartile range 1.3–3.2% 0–2.2% meet their need,
5–95th percentile range 0.6–6% 0–5.7% compared to the
Source(s): VHLSS (General Statistics Office, 2014) general populationFREP What does 25 kWh per month mean in terms of basic needs? It amounts to about
830 Wh per day. This is more than enough to charge many mobile phones as a phone
battery contains about 5 Wh. It is also enough for lighting, as a modern light bulb is about
10 W, a few hours per day. A TV and fans can also fit within this energy budget. However,
this budget does not include modern comfort appliances. This amount of energy is not
sufficient to run an air conditioning unit or refrigerator or provide electric cooking or
heating.
Households that declared that their electricity consumption did not meet their needs tend
to use little electricity (in 2014), but the converse is not true. Using small quantities of
electricity can satisfy needs. In this sample, among the households that used less than 30 kWh
of electricity, most did not declare their needs unsatisfied (see Figure 5). This shows that the
absolute amount of energy used is not a sufficient indicator to determine satisfaction. The
perceived comparison of the energy used with the needs of the household, determined by
the appliances it owns, determines sufficiency.
Second, consider the interaction between the high electricity cost ideas based on the share of
income devoted to electricity and the subjective indicator. In 2014, about 6% of Vietnamese
households had high electricity costs, defined as an electricity bill larger than 6% of their
income. Survey results show a very small overlap between that population and the households
declaring that their needs were not met (see Figure 5). Furthermore, respondents declaring their
electricity consumption did not meet their needs tended to spend less on electricity than the
general population. The share of income devoted to energy is not a sufficient indicator to
determine satisfaction. Vignon (2014) also found a low correlation between objective and
subjective energy poverty indicators. Specifically, in France, only 20% of the households that
spent more than 10% of their income on energy also declared that they felt cold.
Third, the high electricity cost (budget effort > 6%) subsample also has very little overlap
with the low electricity consumption subsample. This survey confirmed that the high
electricity cost definition of energy poverty is problematic, as discussed in section 6.
8. Discussion
In this section, we discuss Vietnam’s progress toward SDG 7 and the policy implications for
energy poverty. We contextualize the results by comparing them with those of ASEAN
countries; refer to International Energy Agency et al. (2020, p. 7) and Roseberry (2020) for
comprehensive data on electricity poverty and SDG 7.
Four indicators related to SDG 7 (access to clean, reliable and affordable energy for all)
based on VHLSS survey data are summarized in Table 5. The first row is a proxy for SDSN
Indicator 51 discussed in section 6, access to reliable electricity. The next three rows
correspond to the three viewpoints discussed in sections 11, 14 and 17.
Year 2008 2010 2012 2014 2016 2018
Share of households not using grid electricity for 4.3% 4.7% 4.4% 3.3% 2.0% 1.6%
lighting, rural/urban 0.3% 0.3% 0.3% 0.1% 0.1% 0.0%
Share of households declaring less than 30 kWh of NA 12.9% 11.9% 11.2% 8.8% 6.2%
electricity used within the previous 30 days
Table 5. Share of households paying more than 6% of their 2.5% 2.3% 3.0% 5.1% 6.2% 7.9%
Evolution of
performance indicators income for electricity
toward access to clean Share of households declaring their electricity NA 24.0% 4.7% 2.7% NA NA
and affordable energy consumption within the previous 30 days did not meet
for all in Vietnam (less their needs
is better) Source(s): Authors, VHLSS dataThe first row shows that Vietnam has mostly achieved access to clean energy for all of SDG 7. Electricity
Vietnam has a lower-middle-income economy. According to World Development Indicators poverty
(World Bank, accessed 2021-02-18, statistics for 2018), 86.3% of the population had access to
electricity in that country group. Vietnam scores above its peers. Its access indicator
reduction in
compares with that of upper-middle-income countries, where 99.4% of the population had Vietnam
access (World Bank, op. cit.). Historically within ASEAN, Vietnam achieved electrification
after Brunei Darussalam, Malaysia, Singapore and Thailand, but before the Philippines,
Indonesia and the Lao PDR (Gu, Yan, & Nuki, 2020). As of 2019, Cambodia and Myanmar had
yet to reach a 95% electrification rate.
Based on electricity consumption per capita, Gu, Yan, & Nuki (2020) classified ASEAN
member states into four groups. The first is Singapore, Thailand and Brunei Darussalam.
Vietnam is in the second group, with Malaysia and Indonesia. The third group includes Lao
PDR and the Philippines. The fourth group is Cambodia and Myanmar.
The Philippines and Indonesia have higher incomes than Vietnam but numerous
isolated islands, making electrification more difficult. Lao PDR is a continental country
well-endowed in hydroelectric resources and income per capita comparable to Vietnam’s.
Nevertheless, Laos PR’s electricity consumption per capita is much lower, perhaps because
it has a higher percentage of rural households living in mountain areas. Cambodia and
Myanmar are behind Vietnam in electricity access because they have lower income per
capita. The same logic applies when comparing Vietnam with Brunei Darussalam,
Malaysia, Singapore and Thailand.
That second row shows the share of households using less than 30 kWh per month. The
percentage of households below the electricity poverty line is an energy poverty indicator. We
chose 30 kWh because it is the amount subsidized in official Vietnamese policies. However,
the group covers diverse situations, the first three levels in Bathia & Angelou’s (2015)
multitier matrix for measuring household electricity consumption. The less than 30 kWh
group ranges from households without any electricity access to households using about
1000 Wh per day, which is enough for lighting, charging phones and running fans and
television. By 2018, this under-30 kWh/month group comprised less than 7% of households,
declining by about one percentage point per year during the period.
Row three shows the share of households spending less than 6% of their income on
electricity. The conclusion that the burden is increasing fast does not depend on the precise
6% value, as Supplementary Figure 2 shows. Do rows two and three confirm that “[e]lectricity
poverty decreased but electricity-cost poverty increased” (Nguyễn Ha Dương, 2019)?
Spending more on electricity is not necessarily a welfare loss. Electricity can substitute other
forms of energy, reducing their cost, particularly for rural and less wealthy households, which
were still a majority of the population at the start of the sample period. Biomass use decreased
at the same time electricity consumption increased. According to the International Energy
Agency (Data and statistics, accessed 2021-02-10), in 2018, the total final energy consumption
by the Vietnamese residential sector (households) was 10,059 ktoe, of which 5352 ktoe (52%)
was as electricity and 2213 ktoe (22%) was as biofuel and waste. In 2008, the total was
15,110 ktoe, of which electricity was 2241 ktoe (15%) and biomass 11,086 ktoe (73%). Most of
the costs of using biomass energy are non-market. It would be difficult to quantify the welfare
gains of using an electric rice cooker over a traditional wood stove, but given a choice, many
households choose the first option.
Electricity is affordable for most households, but energy poverty remains for many.
According to the General Statistics Office (2019, p. 435), air conditioner ownership per 100
households increased from 5.50 to 35.1 between 2008 and 2018. For urban areas, the ratio
increased from 17.3 to 70.1. The statistic increased only from 0.1 to 3.3 air conditioners per 100
households for the lowest income quintile. Not being able to protect against extreme heat fits
with the first definition of energy poverty presented in section 6.FREP The barrier to air conditioning is not only capital but also operating costs. During the 2020
summer heatwave, several mass media raised the issue of cooling affordability for poor
households (L^e, 2020; Thương & Ha, 2020). The monthly income per capita in 2018 for the
first quintile was VND 923,000, about 41 USD (General Statistics Office, 2019, p. 22). For poor
households, each kilowatt-hour counts. Using 1 kW for 100 hours in a month costs about VND
200,000 at the third tariff block. To compound the problem, many landlords charge high rates
for electricity. If the government gave appliances for free, there would still be energy poverty
in the sense of the fourth criterion discussed in section 2.
The fourth (bottom) row in the table is about satisfaction, the share of households stating
that their electricity consumption did not meet their needs the previous month. We regret that
the 2016 and 2018 household surveys did not measure this indicator. As a regulated
monopoly provides electricity, it remains useful that national statistical offices provide the
government with independent performance indicators. National electricity policies have
many objectives. Goals for the energy sector as a whole include independence and
sustainability. Objectives for households include universal access to electricity, affordable
tariffs and satisfying quality of service. We believe that these three objectives require
different indicators. Energy poverty must be measured and discussed with engineering,
economic and subjective data. The subjective energy indicator—designed from surveys
asking people whether they had enough electricity to meet their households’ needs—provides
essential customer satisfaction feedback that cannot be obtained by looking only at kilowatt-
hours and money flows.
For policymaking, the discussions on SDG 7 and energy poverty indicators lead to
operational criteria defining which households should be eligible for support. In section 7,
we showed that the three different approaches point to different households. We argue that the
subjective indicator is the most theoretically satisfying measure of progress toward SDG 7.
However, for identifying which households should receive money, subjective declarative
criteria are challenging to trust. Furthermore, the high electricity cost budget effort indicator
has problems. Three approaches remain operational for defining households eligible for
electricity subsidies: (1) low income, (2) low electricity consumption, or (3) both. The Vietnamese
support scheme uses option c. A household with an income poverty certificate could get a
subsidy of 30,000 VND/household/month if it consumed less than 50 kWh.
The VHLSS, 2014 survey explicitly asked questions about electricity subsidies and
poverty certificates. Figure 6 shows how the subsidy mechanism performed. Three-
quarters of poor respondents declared they received the electricity subsidy. The figure
shows that only 37% of households using less than 30 kWh received the subsidy. The
reason is that most of those households do not have a poverty certificate. Finally, only 23%
of households that declared their electricity needs were not met received a subsidy. The
subsidy mechanism worked more to alleviate poverty (SDG 1) than to satisfy electricity
needs (SDG 7).
Figure 6.
Overlap between
households receiving
electricity subsidy and
subsamples of
households matching
different electricity
poverty criteria in the
2014 VHLSS9. Summary and concluding remarks Electricity
Engineering and econometric objectivist approaches dominate the literature on sustainability poverty
monitoring. Out of 232 SDG indicators, only two are subjective (10.3.1 and 16.7.2). The case of
Vietnam from 2008 to 2018 shows that subjective and objective energy poverty indicators can
reduction in
tell different sides of the story. In 2010, the fraction of households with access to electricity Vietnam
was higher than 96%, but more than 24% of households declared their electricity
consumption did not meet their needs. Since 2014, the satisfaction rate has been more than
97%, even if 25% of the households used less than 50 kWh/month.
The subjective measure of energy poverty could be handy for macro-scale international
comparisons. The share of households satisfied with their electricity service may be a more
informative political indicator than the electrification rate. To target households eligible
for energy subsidies, income and electricity consumption indicators may be more
operational than personal declarations at the micro-scale. That may explain why the
Vietnamese electricity subsidy works more to alleviate economic poverty than to satisfy
energy needs.
The three perspectives we explored in this paper converge to indicate that Vietnam
progressed very close to SDG 7 (affordable and clean energy for all) over the 2008–2018
period, and that electricity poverty is not an acute social issue in 2018. (1) Vietnam achieved
nearly universal access to electricity. The expansion of the grid matched the demographic
expansion. To bring electricity to all, the electricity grid increase should exceed the
population increase (World Bank Group and International Energy Agency, 2013). About 1
million people lack access to the electricity grid, mostly in remote areas in the northern
mountains. (2) The quality of service, defined as customer satisfaction, has improved to a
high level. Between 2010 and 2014, the share of households declaring that their electricity
consumption did not meet their need dropped from 24% to 2.7%. (3) Inequalities in
electricity consumption among Vietnamese households decreased during the 2008–2018
period. Inequalities in electricity consumption are not greater than inequalities in income,
contrary to Son & Yoon’s (2020) findings for the 1993–2004 period. (4) Electricity is
affordable in Vietnam. The electricity tariffs declined in real terms during the last 10 years.
They are lower than in other ASEAN countries, and households spend a smaller share of
their budget on electricity.
As electricity consumption increases, the cost of electricity weights in the budget of
Vietnamese households is rising. Raising the price of electricity further may be necessary at
some point to pay for imported fuels and for financial investment in capital-intensive solar
and wind power plants, and to reinforce and modernize the grid. As long as the government
regulates retail tariffs, it retains the possibility to share the costs between the different
categories of electricity consumers. For example, the government could charge households
less and industrial, commercial and institutional consumers more. The increasing block tariff
is not the only tool for protecting households from electricity poverty.
References
Asian Development Bank (2011). Energy for all: Viet Nam’s success in increasing access to energy
through rural electrification, Available from: https://think-asia.org/bitstream/handle/11540/963/
rural-electrification-vie.pdf (accessed 22 June 2021).
Atkinson, A.B. (1987). “Poverty”. In Name, X. (Ed.), The New Palgrave Dictionary of Economics,
London: Palgrave Macmillan, 1–9, doi: 10.1057/978-1-349-95121-5_1597-1.
Baltruszewicz, M., Steinberger, J. K., Ivanova, D., Brand-Correa, L. I., Paavola, J., & Owen, A. (2021).
Household final energy footprints in Nepal, Vietnam and Zambia: Composition, inequality and
links to well-being. Environmental Research Letters, 16(2), 025011, doi: 10.1088/1748-9326/
abd588.FREP Bathia, M., & Angelou, N. (2015). Beyond connections: Energy access redefined. ESMAP Technical
Report 008/15. Washington, DC: World Bank. Available from: http://hdl.handle.net/10986/24368
(accessed 22 June 2021).
Bravo, V., Mendoza, G.G., Legisa, J., Suarez, C.E., & Zyngierman, I. (1983). A first approach to defining
basic energy needs. Tokyo: United Nations University.
Department of Trade and Industry (2007). Fuel poverty. The National Archives. 6 March, Available
from: http://webarchive.nationalarchives.gov.uk/20070603164901/http://www.dti.gov.uk/
energy/fuel-poverty/index.html (accessed 22 June 2021).
EVN (2019). Vietnam electricity annual report 2018. Vietnam Electricity (EVN). Available from: https://
www.evn.com.vn/userfile/User/tcdl/files/2019/8/EVNAnnualReport2018(1).pdf (accessed 22
June 2021).
Foster, V., Tre, J.P., & Wodon, Q. (2000). Energy prices, energy efficiency, and fuel poverty. unpublished
paper. Washington, DC: Latin America and Caribbean Regional Studies Program The World
Bank. Available from: http://www.mediaterre.org/docactu,bWF4aW0vZG9jcy9wZTE5,1.pdf
(accessed 22 June 2021).
General Statistics Office (2019). Result of the Viet Nam household living Standards survey 2018. Ha
Noi, Viet Nam: Statistical Publishing House. Available from: https://www.gso.gov.vn/en/data-
and-statistics/2020/05/result-of-the-vietnam-household-living-standards-survey-2018/ (accessed
22 June 2021).
General Statistics Office of Vietnam (2015). The 1/4/2014 Viet Nam intercensal population and housing
survey: Major findings. City, Vietnam: Ministry of Planning and Investment. Available from:
https://www.gso.gov.vn/en/data-and-statistics/2019/05/the-1-4-2014-viet-nam-intercensal-
population-and-housing-survey-major-findings/ (accessed 22 June 2021).
Gu, H., Yan, B., & Nuki, A.U. (2020). Practical experience and prospects for energy accessibility in
ASEAN. Jakarta: ASEAN Centre for Energy and China Renewable Energy Engineering
Institute. Available from: https://aseanenergy.org/practical-experience-and-prospects-for-
electricity-accessibility-in-asean/(accessed 22 June 2021).
He, X., & Reiner, D. (2016). Electricity demand and basic needs: Empirical evidence from China’s
households, Energy Policy, 90(March), 212–221, doi: 10.1016/j.enpol.2015.12.033.
Hills, J. (2012). Getting the Measure of fuel poverty: Final Report of the fuel poverty review. CASE report
72. Center for Analysis of Social Exclusion. Available from: http://eprints.lse.ac.uk/43153
(accessed 22 June 2021).
International Energy Consultants (2016). Regional/Global comparison of retail electricity tariffs -
executive summary, Available from: http://corporate-downloadables-tips.s3.amazonaws.com/
1478573661.68b4d11ba9cb3ccb30e91c6edd66b6c9.pdf (accessed 22 June 2021).
International Energy Agency, International Renewable Energy Agency, United Nations Statistics
Division and World Health Organization (2020). Tracking SDG 7. The energy progress report.
Washington, DC: The World Bank, the International Energy Agency, the International
Renewable Energy Agency, The United Nations Statistics Division and the World Health
Organization. Available from: https://trackingsdg7.esmap.org/(accessed 22 June 2021).
Kasprzyk, D. (2005). “Measurement error in household surveys: Sources and measurement”, chapter
IX, household sample Surveys in Developing and transition countries, 171–198). New York, NY:
United Nations Publications. Available from: https://unstats.un.org/unsd/hhsurveys/ (accessed
22 June 2021).
Khandker, S.R., Barnes, D.F., & Samad, H.A. (2012). Are the energy poor also income poor? Evidence
from India. Energy Policy, 47(August), 1–12, doi: 10.1016/j.enpol.2012.02.028.
L^e, B. (2020). Nghịch Cảnh M ua Nắng nong, Co Ðiều Hoa Vẫn Kh^ong Dam D
ung, Giadinh.Net.Vn,
7(July). Available from: https://giadinh.net.vn/news-20200706171746705.htm (accessed 22
June 2021).L^e, V.P. (2020). Electricity price and residential electricity demand in Vietnam. Environmental Electricity
Economics and Policy Studies(February), doi: 10.1007/s10018-020-00267-6.
poverty
L^e, V.T., & Pitts, A. (2019). A survey on electrical appliance use and energy consumption in
Vietnamese households: Case study of Tuy Hoa city. Energy and Buildings, 197(August), 229–
reduction in
241, doi: 10.1016/j.enbuild.2019.05.051. Vietnam
Li, K., Pan, S.Y., & Wei, Y.M. (2015). A bibliometric analysis of energy poverty research: Results from
SCI-E/SSCI databases. Interntional Journal of Global Energy Issues, 38(4-6), 357–372, doi: 10.
1504/IJGEI.2015.070263.
Nguyễn, M.P. (2010). Preventing power tariffs from stoking inflation. The Saigon Times, 25(February).
Available from: http://english.thesaigontimes.vn/8896/Preventing-Power-Tariffs-From-Stoking-
Inflation.html (accessed 25 November 2016).
Nguyễn, A.T., & Lefevre, T. (1996). Analysis of household energy demand in Vietnam. Energy Policy,
24(12), 1089–1099, doi: 10.1016/S0301-4215(97)80003-6.
Nguyễn, H.S., & Ha Dương, M. (2017). Is electricity affordable and reliable for all in Vietnam?. In The
tenth Vietnam Economist Annual Meeting (VEAM 2017). Ho Chi Minh City.
Nguyễn, H.S., & Ha Dương, M. (2019). Income and electricity poverty in Vietnam 2012–2016. In The
11th Vietnam Economists Annual Meeting (VEAM 2019). Da Lat.
Nguyễn, T.T., Nguyễn, T.T., Hoang, V.N., Wilson, C., & Managi, S. (2019). Energy transition, poverty
and inequality in Vietnam. Energy Policy, 132(September), 536–548, doi: 10.1016/j.enpol.2019.
06.001.
Nussbaumer, P., Bazilian, M., & Modi, V. (2012). Measuring energy poverty: Focusing on what
matters. Renewable and Sustainable Energy Reviews, 16(1), 231–243, doi: 10.1016/j.rser.2011.
07.150.
Observatoire National de la Precarite Energetique (2016). Caracteriser le phenomene et le mesurer,
Available from: http://www.onpe.org/definition_indicateurs/definition_des_indicateurs
(accessed 22 June 2021).
Pachauri, S., Mueller, A., Kemmler, A., & Spreng, D. (2004). On measuring energy poverty in indian
households. World Development, 32(12), 2083–2104, doi: 10.1016/j.worlddev.2004.08.005.
Roseberry, K. (2020). Regional energy trends report 2020. Tracking SDG7 in the ASEAN region, united
nations publication ST/ESCAP/2921, sales no. E.21.II.F.2. Bangkok: United Nations Economic
and Social Commission for Asia and the Pacific (ESCAP), and ASEAN Centre for Energy
(ACE). Available from: https://www.unescap.org/publications/regional-energy-trends-report-
2020-tracking-sdg-7-asean-region (accessed 22 June 2021).
Son, H., & Yoon, S. (2020). Reducing energy poverty: Characteristics of household electricity use in
Vietnam. Energy for Sustainable Development, 59, 62–70, doi: 10.1016/j.esd.2020.08.007.
Sovacool, B.K., Mukherjee, I., Drupady, I.M., & D’Agostino, A.L. (2011). Evaluating energy security
performance from 1990 to 2010 for eighteen countries. Energy, 36(10), 5846–5853, doi: 10.1016/j.
energy.2011.08.040.
Sustainable Development Solutions Network (2015). Indicators and a monitoring framework for the
sustainable development goals. Leadership Council of the Sustainable Development Solutions
Network. Available from: https://resources.unsdsn.org/indicators-and-a-monitoring-framework-
for-sustainable-development-goals-launching-a-data-revolution-for-the-sdgs (accessed 22
June 2021).
Thương, M., & Ha, T. (2020). Nắng nong dỉnh diểm vẫn kh^ong dam bật quạt ở xom ngụ cư ngheo
[Poor neighborhood did not dare to turn on fans at the peak of heatwave], Available from:
https://tuoitre.vn/news-20200610134010987.htm (accessed 22 June 2021).
Vignon, J. (2014). Premier rapport de l’ONPE: Definitions et indicateurs. Les Notes de l’ONPE -
Observatoire National de La Precarite Energetique, 4, 1–6. Available from: http://onpe.org/sites/
default/files/pdf/documents/notes_observatoire/note_ndeg4f4.pdf (accessed 9 July 2021).You can also read