The genetics of gene expression in a Caenorhabditis elegans multiparental recombinant inbred line population
←
→
Page content transcription
If your browser does not render page correctly, please read the page content below
2
                                                                                                                                    G3, 2021, 11(10), jkab258
                                                                                                                           DOI: 10.1093/g3journal/jkab258
                                                                                                            Advance Access Publication Date: 10 August 2021
                                                                                                                                  Multiparental Populations

The genetics of gene expression in a Caenorhabditis
elegans multiparental recombinant inbred line population
Basten L. Snoek,1,2,* Mark G. Sterken      ,1 Harm Nijveen                 ,3 Rita J. M. Volkers,1 Joost Riksen,1 Philip C. Rosenstiel,4,5
Hinrich Schulenburg     ,6,7,* and Jan E. Kammenga1,*

                                                                                                                                                                 Downloaded from https://academic.oup.com/g3journal/article/11/10/jkab258/6347583 by guest on 20 October 2021
1
  Laboratory of Nematology, Wageningen University, NL-6708 PB Wageningen, The Netherlands,
2
  Theoretical Biology and Bioinformatics, Utrecht University, 3584 CH Utrecht, The Netherlands,
3
  Bioinformatics Group, Wageningen University, NL-6708 PB Wageningen, The Netherlands,
4
  Institute for Clinical Molecular Biology, University of Kiel, 24098 Kiel, Germany,
5
  Competence Centre for Genomic Analysis (CCGA) Kiel, University of Kiel, 24098 Kiel, Germany,
6
  Zoological Institute, University of Kiel, 24098 Kiel, Germany, and
7
  Max Planck Institute for Evolutionary Biology, 24306 Ploen, Germany

*Corresponding authors: Email: l.b.snoek@uu.nl (B.L.S.); hschulenburg@zoologie.uni-kiel.de (H.S.); jan.kammenga@wur.nl (J.E.K.)

Abstract
Studying genetic variation of gene expression provides a powerful way to unravel the molecular components underlying complex traits.
Expression quantitative trait locus (eQTL) studies have been performed in several different model species, yet most of these linkage studies
have been based on the genetic segregation of two parental alleles. Recently, we developed a multiparental segregating population of
200 recombinant inbred lines (mpRILs) derived from four wild isolates (JU1511, JU1926, JU1931, and JU1941) in the nematode
Caenorhabditis elegans. We used RNA-seq to investigate how multiple alleles affect gene expression in these mpRILs. We found 1789
genes differentially expressed between the parental lines. Transgression, expression beyond any of the parental lines in the mpRILs, was
found for 7896 genes. For expression QTL mapping almost 9000 SNPs were available. By combining these SNPs and the RNA-seq profiles
of the mpRILs, we detected almost 6800 eQTLs. Most trans-eQTLs (63%) co-locate in six newly identified trans-bands. The trans-eQTLs
found in previous two-parental allele eQTL experiments and this study showed some overlap (17.5–46.8%), highlighting on the one
hand that a large group of genes is affected by polymorphic regulators across populations and conditions, on the other hand, it shows that
the mpRIL population allows identification of novel gene expression regulatory loci. Taken together, the analysis of our mpRIL population
provides a more refined insight into C. elegans complex trait genetics and eQTLs in general, as well as a starting point to further test and
develop advanced statistical models for detection of multiallelic eQTLs and systems genetics studying the genotype–phenotype relation-
ship.

Keywords: multiparental RILs; expression QTL; eQTL; SNPs; C. elegans; MPP; Multiparental Populations; Multiparent Advanced
Generation Inter-Cross (MAGIC)

Introduction                                                                        Ben-David et al. 2017; Zdraljevic et al. 2017; Hahnel et al. 2018;
Investigation of the genotype–phenotype relationship is at the                      O’Donnell et al. 2018; Brady et al. 2019; Zdraljevic et al. 2019). Over
heart of genetic research. The detection and description of allelic                 the last decade, molecular phenotypes such as transcript levels,
variants and genetic mechanisms have been a demanding task                          protein levels, and metabolites have also been used in QTL map-
due to the quantitative nature of most phenotypic variation.                        ping (Li et al. 2010; Vinuela et al. 2010; Singh et al. 2016; Snoek et al.
Quantitative trait locus (QTL) mapping has been one of the meth-                    2017; Sterken et al. 2017; Gao et al. 2018; Sterken et al. 2019).
ods of choice for finding the loci on which these allelic variants                  Heritable variation in these molecular phenotypes often plays a
can be found. Many functional polymorphisms in plants and ani-                      role in heritable phenotypic variation (Jimenez-Gomez et al. 2010;
mals, including many model species such as model nematode                           Schmid et al. 2015; Sterken et al. 2017). Mapping expression QTLs
Caenorhabditis elegans, have been discovered using QTL mapping                      (eQTLs) can provide insight into the transcriptional architecture
(Tijsterman et al. 2002; Rogers et al. 2006; Kammenga et al. 2007;                  of complex traits and have been conducted in model species such
Gloria-Soria and Azevedo 2008; Palopoli et al. 2008; Reiner et al.                  as Arabidopsis thaliana and C. elegans as well as several other taxa
2008; Seidel et al. 2008; McGrath et al. 2009; Reddy et al. 2009;                   (Li et al. 2006; Keurentjes et al. 2007; West et al. 2007; Li et al. 2010;
Bendesky et al. 2011; Seidel et al. 2011; Bendesky et al. 2012; Ghosh               Rockman et al. 2010; Vinuela et al. 2010; Snoek et al. 2012, 2017;
et al. 2012; Andersen et al. 2014; Noble et al. 2015; Schmid et al.                 Cubillos et al. 2014; Ranjan et al. 2016; Sterken et al. 2017, 2019;
2015; Cook et al. 2016; Greene et al. 2016; Large et al. 2016;                      Hartanto et al. 2020).

Received: June 15, 2021. Accepted: July 17, 2021
C The Author(s) 2021. Published by Oxford University Press on behalf of Genetics Society of America.
V
This is an Open Access article distributed under the terms of the Creative Commons Attribution License (http://creativecommons.org/licenses/by/4.0/), which
permits unrestricted reuse, distribution, and reproduction in any medium, provided the original work is properly cited.
2 | G3, 2021, Vol. 11, No. 10
Most eQTL studies have been done on populations of recombi- isolate (Supplementary Table S4). Collecting and freezing the
nant inbred lines (RILs) originating from a cross between two dif- samples for one batch took approximately 30 min. The genetic
ferent parental genotypes (Li et al. 2006; Keurentjes et al. 2007; map and eQTL profiles can found on WormQTL2 (Li et al. 2009)
West et al. 2007; Li et al. 2010; Rockman et al. 2010; Vinuela et al. (http://www.bioinformatics.nl/EleQTL; Snoek et al. 2020).
2010; Snoek et al. 2012, 2017; Cubillos et al. 2014; Sterken et al.
2017, 2019; Hartanto et al. 2020). The inclusion of more than two SNP calling and gene expression levels
parents can capture more genetic variation, increasing the num- The paired-end reads were mapped against the N2 reference ge-
ber of detected QTLs, potentially allowing more precise mapping nome (WS220) using Tophat (Trapnell et al. 2009), allowing for
and therefore reducing the number of potential candidate causal four read mismatches, and a read edit distance of 4. SNPs were
genes to be verified (King et al. 2012). Such a strategy was first called using samtools (Li et al. 2009), mpileup with bcftools and
used for Arabidopsis by developing a Multiparent Advanced vcfutils as described in Snoek et al. (2019). Expression levels were
Generation Inter-Cross (MAGIC) lines population consisting of determined using the tuxedo pipeline, giving length normalized
527 RILs developed from 19 different parental accessions (Kover fragments per kilobase per million (fpkm) values (Trapnell et al.
Downloaded from https://academic.oup.com/g3journal/article/11/10/jkab258/6347583 by guest on 20 October 2021
et al. 2009). Several other MAGIC populations have been devel- 2012). Transcripts were assembled from the mapped reads using
oped since then for a range of species, including C. elegans (de cufflinks (Trapnell et al. 2012). Raw RNA-seq data can be found in
Koning and McIntyre 2017; Noble et al. 2017; Snoek et al. 2019). the Sequence Read Archive (SRA; https://www.ncbi.nlm.nih.gov/
Recently multiparental RIL (mpRILs) populations have been sra) with ID PRJNA495983. Normalized read counts can be found
developed in C. elegans (Noble et al. 2017; Snoek et al. 2019). These on WormQTL2 (http://www.bioinformatics.nl/EleQTL; Snoek et al.
populations have been created using other strains than the most 2020). Normalization was done after the selection of the consis-
frequently used N2 strain and the Hawaiian CB4856 strain tently detected transcripts (see QTL mapping and FPR) by taking
(Li et al. 2006; Doroszuk et al. 2009; Rockman and Kruglyak 2009; the fpkm per gene per million fpkm per sample.
Li et al. 2010; Vinuela et al. 2010; Rodriguez et al. 2012; Vinuela
et al. 2012; Snoek et al. 2013, 2014, 2014, 2017, 2020; Stastna et al. Heritability and transgression
2015; Sterken et al. 2015, 2017, 2019, 2021; Thompson et al. 2015; Heritability of gene expression levels was calculated using the
Kamkina et al. 2016; Nakad et al. 2016; Singh et al. 2016; Jovic et al. heritability package in “R.” A narrow-sense heritability was calcu-
2017; Jovic et al. 2019; Evans et al. 2021). In this study, we used the lated using the function marker_h2 (Kruijer et al. 2015). The re-
population of 200 mpRILs, derived from an advanced cross be- quired kinship matrix was calculated using the emma.kinship
tween four wild types: JU1511 and JU1941 isolated from Orsay function from the EMMA package (Kang et al. 2008). To determine
(France) and JU1926 and JU1931 isolated from Santeuil (France) a per-gene significance, we used a permutation approach where
(kindly provided by MA Félix, Paris, France; Volkers et al. 2013; we shuffled the expression levels per transcript. After 100 permu-
Snoek et al. 2019). In a previous study, the RNA-seq data of these tations, the 95th highest value was taken as the 0.05 false
mpRILs were used to obtain almost 9000 SNPs variable between discovery rate (Speed et al. 2012; Kruijer et al. 2015; Gilmour 2019).
the four parental genotypes and used to identify QTLs for life- Transgression was determined by counting the number of
history traits (Snoek et al. 2019). The RNA was sampled from the mpRILs with an expression level beyond the mean þ 2 SD of the
mpRILs grown under standardized conditions (24 C, OP50, 48 h most extreme parental lines. SD was calculated on the within-
after bleaching) and obtained from animals from two 6-cm line variation of the parental samples. False-positive rate (FPR)
dishes, with one RNA-seq replicate per mpRIL and two per paren- was determined by permutations, randomly assigning the
tal isolate. To investigate the effect of multiple genetic back- parental labels to gene-expression values. The threshold for
grounds on gene expression, we used the RNA-seq data to transgression was set at an arbitrary 50 mpRILs (25% of all lines;
associate gene expression levels to genetic variants present in the FPR ¼ 0.08) beyond the most extreme parental line(s).
population. We compared the gene expression level differences
between the parental wild isolates, calculated transgression, as eQTL mapping and FPR
well as heritability and mapped eQTLs. We identified six trans- For eQTL mapping, we first selected the genes with consistently
bands (TBs), hotspots at which many trans-eQTLs colocate, which detected transcripts, meaning those expressed with a mean log2
we further studied by gene ontology enrichment. Lastly, we com- expression (fpkm) >5, which resulted in a set of 12,029 genes
pared the eQTLs found in this study to the eQTLs found in previ- with transcripts that were detected in all samples. eQTLs were
ous eQTL studies in C. elegans (Li et al. 2006, 2010; Rockman et al. mapped by a linear model using a single marker model explain-
2010; Vinuela et al. 2010; Snoek et al. 2017; Sterken et al. 2017). ing gene expression (as log2 ratio with the mean) by one SNP-
Together these results present the first insights into the genetic marker at the time for the whole genome. FPR was determined by
architecture of gene expression in a C. elegans multiparental RIL one round of permutations where for each transcript, the counts
population. were randomly distributed over the RILs before eQTL mapping.
The -log10(p) value when number of false positives divided by the
number of true positives was 5.35]. Transbands
Methods (or eQTL hotspots) were determined for those loci that harbor
Nematode strains and culturing, more than 100 eQTLs in a 1-Mbp window to both sides of the
RNA-sequencing, construction of the genetic map marker under consideration. Genome-wide eQTL significance
The C. elegans strains and culturing condition, RNA-sequencing, profiles [-log10(p)] can be found on WormQTL2 (http://www.bioin
and construction of the genetic map can be found in Snoek et al. formatics.nl/EleQTL; Snoek et al. 2020).
(2019). In short, the mpRILs used were grown in five separate
batches with two 6-cm dishes per strain (24 C, OP50, 48 h after Enrichment analysis and figures
bleaching; the plates were randomized within incubators) and Enrichment of GO terms was done using the hypergeometric test
per strain, the two samples were pooled for RNA isolation, with in “R” (R Core Team 2017). GO term genes associations were
one RNA-seq replicate per mpRIL and two replicates per parental download from Wormbase (http://www.wormbase.org) versionB. L. Snoek et al. | 3
409
400
300
Parental DEG
220
200
133
125
110
100
6359
Downloaded from https://academic.oup.com/g3journal/article/11/10/jkab258/6347583 by guest on 20 October 2021
494644
35353333
26252424212119
161613121212121210 9 9
8 8 7 7 7 7 5 5 5 5 5 5 4 4 3 3 3 2 2 2 2 1 1 1
0
JU1931vsJU1511
JU1941vsJU1511
JU1941vsJU1931
JU1931vsJU1926
JU1926vsJU1511
JU1941vsJU1926
900 600 300 0
Total Genes
Figure 1 Gene expression differences between the four mpRIL parental lines. Upset plot shows the pairwise comparisons and the overlap between the
pairs (Tukey’s HSD; P < 0.001; FPR ¼ 0.05). The horizontal bar plot shows the number of DEG per parental pair, while the vertical bar plot indicates the
number of shared DEG per comparison. For example, an overlap of 409 genes was found between the three comparisons that include the JU1926
parental line, which shows that JU1926 differed most from all other lines.
WS276. Only genes that passed the filtering step for eQTL map- Figure 1). Of the four strains, JU1926 was most different when
ping were used as background genes. For significant enrichment, compared to the other lines, with 409 genes being differently
a P-value < 1e5 was used and a geneset size per GO term >3. expressed between JU1926 and the other three lines. Thereafter,
Most figures were made using the R package ggplot2 (Wickham JU1941 was most different from the remaining two lines. These
2009) except Figure 1 which was made using the UpSetR library. differences in gene expression between the parental lines are
likely genotype dependent. To illustrate the reproducibility of the
eQTL comparison between experiments/studies parental lines, we calculated the correlation between the paren-
tal samples and found that replicate pairs are formed. The corre-
To compare how many genes with an eQTL overlapped between
lation between the parental pairs is JU1511: 0.91, JU1926: 0.91,
the different studies (Li et al. 2006, 2010; Rockman et al. 2010;
JU1931: 0.94, and JU1941: 0.82.
Vinuela et al. 2010; Snoek et al. 2017, 2020; Sterken et al. 2017)
available in WormQTL2 (Snoek et al. 2020), we downloaded the
eQTL profiles and markers used per experiment and listed Transgression and heritability
the genes with a cis- or a trans-eQTL. For eQTL determination, the
To explore the variation in gene expression between the different
most significant marker per gene was taken as the peak. A
parental and mpRIL genotypes, we applied principal component
-log10(p) > 3.5 was used as threshold for calling the eQTL. An
analysis on the log2 gene expression ratios (Figure 2A). From ex-
eQTL was determined cis when the peak position was within 1
ploration of the PCA axes, we concluded that there were no batch
Mbp of the start position of the gene. These lists were compared
effects. This was also based on mapping (1) growth/sample batch,
with the genes having an eQTL in this study. The percentage
(2) RNA-isolation batch, and (3) sequencing batch. Neither of
overlap was calculated against the original study.
these traits mapped to the TBs that we detected. We can see that
the expression variation in many of the mpRILs extends beyond
the parental expression variation. The extension of variation sug-
Results gests transgression and/or developmental variation. PC1 most
Gene expression differences between the likely corresponds to differences in development as gene families
parental lines known to be strongly upregulated during L4 progression (Snoek
To study the effect of genetic variation on gene expression, we et al. 2014) like vitellogenins (vit), major sperm proteins (msp), and
used RNA-seq on a population of 200 multiparental recombinant chondroitin proteoglycans (cpg), were highly correlated with PC1.
inbred lines (mpRILs) (Snoek et al. 2019), made from a cross be- Analysis revealed transgression for 7896 genes (FPR ¼ 0.08;
tween four parental lines isolated from Orsay, France (JU1511, Figure 2, B and C, Supplementary Table S2). Notably, most trans-
JU1941) and Santeuil, France (JU1926, JU1931) (Volkers et al. 2013). gression was one-sided, showing increased expression level be-
The animals used were grown on two 6-cm dishes (24 C, OP50, yond the highest expression level found in the parental lines.
48 h after bleaching) per sample pooled for RNA isolation, with This suggests that multiple segregated loci, in combination with
one RNA-seq replicate per mpRIL and two per parental isolate. developmental variation, are involved in regulating the transcrip-
First, we determined the expression differences between the pa- tion in the mpRILs. The mostly higher than the parental lines
rental lines (Supplementary Table S1). Of the 12,029 detected type one-sided transgression could also be caused by the devel-
transcripts, we found 1789 genes differently expressed between opmental differences between the parental lines and the mpRILs,
at least one parental pair (TukeyHSD P < 0.001; FPR < 0.05; with most of the mpRILs showing a further developed expression4 | G3, 2021, Vol. 11, No. 10
A Genotype B 12000 C Genotype D
Transgression
JU1511 JU1931 mpRIL JU1511 JU1931 mpRIL
Total 300
JU1926 JU1941 Over JU1926 JU1941
9000
Under
T06D8.1
Genes
Genes
Log2 Expression level
5 200
0.0 6000
PC2 (5%)
4
100
-0.1 3000
3
-0.2 0 0
-0.1 0.0 0.1 0.2 0 50 100 150 200 0 50 100 150 200 0 0.25 0.5 0.75 1
PC1 (48%) No. of mpRILs beyond parental expression Genotypes Narrow Sense Heritability
Figure 2 Gene expression variation in the mpRILs and parental genotypes. (A) Principal component analysis (PCoA) of the log2 ratios, mpRILs shown in
Downloaded from https://academic.oup.com/g3journal/article/11/10/jkab258/6347583 by guest on 20 October 2021
gray, parental lines shown in color. (B) Transgression: number of mpRILs beyond the parental expression level (x-axis) against the number of genes
(y-axis). The mpRILs below (under) the lowest parental expression level in blue, mpRILs over the highest parental expression level in green, and the
sum of these (total) in black. (C) Example of two-sided transgression for expression levels of gene T06D8.1. (D) Genes with significant narrow-sense
heritability (h2) and the distribution of heritable variation of gene expression variation at FPR ¼ 0.05.
Table 1 eQTLs per type (cis/trans) per chromosome per SDP
Cis Trans
SDP I II III IV V X Tot I II III IV V X Tot
12 14 2 17 2 23 13 71 35 0 1 1 3 67 107
JU1511 and JU1926 vs
JU1931 and JU1941
13 6 1 14 39 41 3 104 0 2 106 13 15 27 163
JU1511 and JU1931 vs
JU1926 and JU1941
14 12 0 19 0 53 11 95 1373 0 119 5 103 44 1644
JU1511 and JU1941 vs
JU1926 and JU1931
JU1511 37 32 61 14 18 81 243 457 28 211 20 9 430 1155
JU1926 0 32 4 59 5 1 101 5 44 5 26 10 5 95
JU1931 8 0 15 3 81 1 108 31 0 12 21 919 2 985
JU1941 76 0 66 5 38 22 207 150 1 155 35 94 1,271 1,706
Total 153 67 196 122 259 132 929 2,051 75 609 121 1,153 1,846 5,855
SDP, Chromosome, Peak position, and left and right borders in Mega-base pairs.
profile. As a specific group of genes shows a large and progressing JU1941 allele was different from the three other parental geno-
upregulation during L4, this could show up as one-sided trans- types. For the trans-eQTLs, the largest groups also show this alle-
gression. Nevertheless, transgression often indicates that the lic difference or those SNPs that distinguish JU1511/JU1941 from
trait variation, in this case gene expression levels, is heritable. JU1926/JU1931. A substantial group of eQTLs was found for
We calculated the narrow-sense heritability (h2) and found signif- the JU1931 allele, whereas hardly any eQTLs were found for the
icant h2 for expression variation of 9500 genes (per-gene FPR ¼ JU1926 specific SNPs. The lack of JU1926 linked eQTLs is some-
0.05; Figure 2D, Supplementary Table S2). Most gene expression what surprising as it had the most differentially expressed genes
variation showed an h2 below 0.5, indicating that part of the vari- (DEG) in the comparison of the parental lines. Yet, we found
ation is caused by other factors than additive genetic effects. much more genes with eQTLs than being DEG in the parental
These other factors contributing to gene expression variation comparison. These are much more likely to be caused by new al-
could be technical, environmental, but also more complex ge- lelic combinations present in the mpRILs. Overall, the majority of
netic interactions, such as epistasis. the eQTLs are found on a few major effect loci with a specific SDP
linkage (Figure 3). Moreover, comparing the h2 to the eQTLs
showed that genes with an eQTL have a much higher h2 than
Expression QTLs
those without an eQTL, where genes with an h2 > 0.25 almost all
To find the loci involved in gene expression variation between have an eQTL (Figure 4). Comparing cis- and trans-eQTLs showed
the mpRILs, we used a single marker QTL model. We found 6784 that genes with a cis-eQTL have a higher h2 on average, yet the h2
eQTLs (one eQTL per gene, -log10(p) > 5.35; FPR ¼ 0.01), of which distributions of cis- and trans-eQTLs are overlapping.
929 were cis- and 5855 trans-eQTLs (Table 1; Figure 3;
Supplementary Table S2). Most cis-eQTLs were found on chromo-
some V and most trans-eQTLs on chromosomes I and X. For both Trans-bands
cis- and trans-eQTLs, fewest were found on chromosomes II and A large majority of the trans-eQTLs (3704; 63% of all trans-eQTLs)
IV. The SNP Distribution Pattern (SDP) groups SNPs with the were found in six hotspots, so-called TBs (number of trans-eQTLs
same distribution in the parental lines, for example the SNPs > 100, window 1 Mbp to both sides; Table 2; Figure 3). Two TBs
found in JU1511 and JU1941, but not in JU1926 and JU1931 share were found on chromosome I, one on chromosome V, and three
the same SDP. When the SDP is considered, many of the cis- on chromosome X. The two TBs on chromosome I colocated but
eQTLs were found to have an effect where either the JU1511 or were linked to different SDP: the SDP 14 (JU1511/JU1941 vsB. L. Snoek et al. | 5
SDP 12 13 14 JU1511 JU1926 JU1931 JU1941
I II III IV V X
15
10
X
5
0
20
15
Downloaded from https://academic.oup.com/g3journal/article/11/10/jkab258/6347583 by guest on 20 October 2021
V
10
5
0
Gene position
15
10
IV
5
0
10
III
5
0
15
10
II
5
0
15
10
I
5
0
600
# eQTLs
400
200
0
0 5 10 150 5 10 150 5 10 0 5 10 15 0 5 10 15 20 0 5 10 15
eQTL peak position
Figure 3 Cis/trans plot of the identified eQTLs. eQTL position shown on the x-axis, gene position shown on the y-axis (upper plot) or number of eQTLs
(bottom plot). SDP shown in color, chromosomes shown in the gray strips on top and on the right of the panels.
JU1926/JU1931) and SDP JU1511 (vs the rest). The TB on chromo- categories. The genes mapping to TB2 on chromosome I were
some V was linked to SDP JU1931 and the three TBs found on enriched for the GO term “vulval development,” among others.
chromosome X were linked to SPD JU1511 and JU1941. The genes with a trans-eQTL on TB3 on chromosome V were
enriched for GO terms associated with oxidative stress. The
GO enrichment genes mapping to TB4 and TB5 on chromosome X only showed
To study the effect of TBs on the biological function, we used a few enriched GO terms, among which adenyl-nucleotide ex-
GO term enrichment (Table 2, Supplementary Table S3). Each change factor activity and dendrite morphogenesis. The genes
of the TBs was linked to mostly different sets of GO terms, sug- mapping to TB6 on chromosome X were enriched for the GO
gesting an effect on different parts of C. elegans biology. The term “response to anoxia” and many more. This shows that
genes mapping to TB1 on chromosome I were enriched for these TBs can be involved in several developmental processes
behavior and muscle and epidermis development GO and in the interaction with the environment.6 | G3, 2021, Vol. 11, No. 10
A Cis Trans
eQTL
300
FALSE
TRUE
200
Genes
100
Downloaded from https://academic.oup.com/g3journal/article/11/10/jkab258/6347583 by guest on 20 October 2021
0
0 0.25 0.5 0.75 1 0 0.25 0.5 0.75 1
Narrow Sense Heritability
B eQTL no eQTL
mpRILs beyond parental expression
150
level
0.06
0.05
100 0.04
0.03
0.02
0.01
50
0
0 0.25 0.5 0.75 0 0.25 0.5 0.75
Narrow Sense Heritability
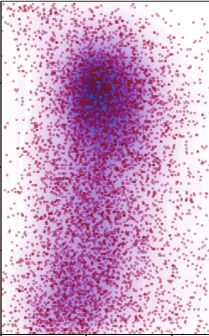
Figure 4 Relation between eQTLs, transgression, and narrow-sense heritability (h2). (A) Narrow-sense heritability (h2; x-axis), distribution in genes
(y-axis) with cis- and trans-eQTLs, significance of the eQTLs is TRUE (green) when -log10p >5.35 and FALSE (grey) otherwise. (B) Relation between
narrow-sense heritability (h2; x-axis) and transgression (y-axis) for genes with and without a significant eQTL, individual datapoints shown in red, color
gradient indicates datapoint density.
Overlap with other eQTL experiments As the genetic backgrounds of the mpRILs are different from the
To investigate if the genes with eQTLs found in the present N2 CB4856 populations used in the other experiments, the low
mpRIL study also had eQTLs in other studies, we compared them percentage of overlapping cis-eQTLs could be expected. The large
with the studies found in WormQTL2 (Table 3; Li et al. 2006, 2010; group of genes with a trans-eQTL in both experiments shows that
Rockman et al. 2010; Vinuela et al. 2010; Snoek et al. 2017, 2020; the expression levels of a substantial group of genes are more
Sterken et al. 2017). In general, we found that a substantial group prone to be affected by genetic variation independent of environ-
of genes with a trans-eQTL in any of the studies had an eQTL in ment or developmental stage, while the loci involved are most
our mpRIL experiment (26.5–36.9%). The groups of genes with likely different in each experiment/condition (Vinuela et al. 2010;
trans-eQTLs show much higher overlap than the genes with a cis- Snoek et al. 2017; Sterken et al. 2017).
eQTL in any of the experiments (10.2–20.0%). Around a third of
the genes with a trans-eQTL in Vinuela et al. (2010), Snoek et al.
(2010, 2017), and Sterken et al. (2017) also showed a trans-eQTL in Discussion
the mpRILs, with numbers almost equal between developmental In this experiment, we used a population of mpRILs and RNA-seq
stages and treatments. Slightly fewer overlapping genes with to find 6784 eQTLs, of which 929 were cis-eQTLs and 5855 were
eQTLs were found with Rockman et al. (2010) and Sterken et al. trans-eQTLs. A large proportion (63%) of the trans-eQTLs were
(2017). Comparing the experiments performed with the same N2 found in six TBs. The total number of eQTLs found in this mpRIL
CB4856 in the same lab (Li et al. 2006; Snoek et al. 2010, 2017; study (6784) is at the high end of what was previously found in
Vinuela et al. 2010; Sterken et al. 2017) shows that environmental other experiments (mean: 2560; 653–6518) (Li et al. 2006;
conditions and developmental stage only have a small effect on Rockman et al. 2010; Vinuela et al. 2010; Snoek et al. 2017; Sterken
the global overlap and difference between cis- and trans-eQTLs. et al. 2017). This number is hard to compare as the number ofB. L. Snoek et al. | 7
Table 2 Descriptive overview of the six identified TBs
SDP CHR Peak Left Right eQTLs GO Enrichment (selection from enrichment table) Phenotypic QTL [in Snoek
(Mbp) (Mbp) (Mbp) et al. ( 2019)]
TB1 14 (JU1511 I 1.03 0.03 2.03 1,339 Thermosensory behavior, negative regulation Population growth on
and of engulfment of apoptotic cell, DNA replica- Erwinia and on B. thurin-
JU1941 vs tion, embryonic body morphogenesis, estab- giensis
JU1926 lishment or maintenance of actin
and cytoskeleton polarity, muscle fiber develop-
JU1931) ment, epidermis development, response to
unfolded protein and, molting cycle, colla-
gen, and cuticulin-based cuticle
TB2 JU1511 I 0.83 0 1.83 443 Regulation of protein stability, regulation of NA
vulval development, DNA replication, ana-
Downloaded from https://academic.oup.com/g3journal/article/11/10/jkab258/6347583 by guest on 20 October 2021
phase-promoting complex and, microtubule
polymerization
TB3 JU1931 V 10.74 9.74 11.74 607 Hemidesmosome assembly, external side of NA
plasma membrane and, negative regulation
of response to oxidative stress
TB4 JU1511 X 3.40 2.40 4.40 133 Adenyl-nucleotide exchange factor activity Heat-shock sensitivity
TB5 JU1941 X 14.69 13.69 15.64 225 Dendrite morphogenesis Population growth on B.
thuringiensis
TB6 JU1941 X 16.60 15.65 17.6 957 Embryonic body morphogenesis, DNA replica- Sensitivity to oxidative
tion, integral component of peroxisomal stress
membrane, anaphase-promoting complex,
endosome, phagocytic vesicle membrane,
neuronal signal transduction, response to
anoxia, cuticle pattern formation, cell fate
commitment, hemidesmosome-associated
protein complex, and response to lipid
Selection of enriched GO terms from Supplementary Table S3 and overlap with phenotypic QTLs found in Snoek et al. (2019).
Table 3 Overlapping eQTLs between this mpRIL experiment and the RIL experiments available in WormQTL2 (Nijveen et al. 2017)
eQTL experiment Total Cis Cis Overlap (%) Total Trans Trans Overlap (%)
16 C (Li et al. 2006) 240 14.6 817 31.6
24 C (Li et al. 2006) 337 12.2 998 30.5
Li et al. (2010) 752 14.5 3,544 28.7
Rockman et al. (2010) 1,958 12.0 2,792 28.8
Control (Snoek et al. 2017; Sterken et al. 2017) 961 17.1 1,,481 36.1
Heat-shock (Snoek et al. 2017; Sterken et al. 2017) 976 20.0 2,776 36.9
Recovery (Snoek et al. 2017; Sterken et al. 2017) 992 16.1 1,519 33.4
Sterken et al. (2017) 719 10.2 1,116 26.5
Juvenile (Snoek et al. 2010; Vinuela et al. 2010) 303 11.9 2,206 33.4
Old (Snoek et al. 2010; Vinuela et al. 2010) 220 15.0 1,790 34.9
Reproductive (Snoek et al. 2010; Vinuela et al. 2010) 348 13.2 2,010 32.7
Percentages indicate the percentage of eQTLs found in the indicated experiment that are also found in the mpRILs eQTLs. Threshold used for the eQTL experiments
in this table: -log10(p) >3.5; Cis-eQTLs were called if the peak of the eQTL was within 1 Mbp of the gene start, otherwise it was called a trans-eQTL.
identified eQTLs depend on many factors, such as population environment in a broader range than the RIAILs with a back-
size, number of recombinations, statistical model, and RNA mea- ground of two parental genotypes used by Rockman et al. (2010),
surement technology used, which are nearly all different be- and the RILs in the other studies. For example, the mpRILs could
tween this and the other eQTL studies in C. elegans (Li et al. 2006; have inherited parts of four different sets of environmental pref-
Rockman et al. 2010; Vinuela et al. 2010; Snoek et al. 2017; Sterken erences as opposed to two in the RIAILs and RILs, potentially
et al. 2017). Nevertheless, it seems that a combination of RNA-seq extending the accompanying gene expression patterns and
and multiple genetic backgrounds increased the number of eQTLs. Yet, the most likely reason for the increased number of
detected eQTLs. A very clear increase was found for trans-eQTLs trans-eQTLs is the use of RNA-seq in this study compared to
(5855) compared to the numbers found in previous studies, even microarrays in the other studies. Another reason for finding more
at a much lower significance threshold. For example, the study of trans-eQTLs could be due to the generally genome-wide equal al-
Rockman et al. (2010) used a comparable number of recombinant lelic distributions in this population (Snoek et al. 2019). Namely, a
inbred advanced intercross lines (RIAILs) as the number of similar TB as the chromosome I TB at 1 Mb (TB1) related to devel-
mpRILs in this study (200), yet found fewer trans-eQTLs, how- opment has been spotted in other datasets, but has been spuri-
ever, the different conditions and technologies used prevent any ous due to being located near the peel-1 zeel-1 incompatibility
definitive conclusions. With respect to trans-eQTLs, we do know locus, therefore, lacking recombinations in the N2 CB 4856 RIL
that they depend on environmental conditions or a response to panel use before (Li et al. 2006; Seidel et al. 2008; Li et al. 2010;
changing conditions. It could be that with a background of four Snoek et al. 2017, 2020). Another advantage of using RNA-seq is
parental genotypes the mpRILs perceive the ambient that the genotype and gene-expression levels can be obtained8 | G3, 2021, Vol. 11, No. 10
from the same sample, preventing mislabeling errors and the This study provides a more detailed insight into the genetic ar-
need for “reGenotyping” in case of microarrays (Zych et al. 2017). chitecture of heritable gene expression variation in a multiparent
In summary, as has been shown for yeast (Albert et al. 2018), the recombinant inbred population. The use of RNA-seq data in com-
combination of generally smaller effect of trans-eQTLs and higher bination with more than two alleles allows for a more precise de-
dynamic range of RNA-seq would at least increase the possibility tection of QTLs and incorporates a wider band of standing
to pick-up trans-eQTLs in C. elegans and in general. genetic variation, resulting in a substantial increase in eQTLs es-
It is noted that genetic variation in development across the pecially trans-eQTLs. Comparison to bi-allelic studies supports
mpRILs could be an important driver of trans-eQTL hotspots the position of eQTLs and may be used to detect a more detailed
(Francesconi and Lehner 2014). We found two eQTL hotspots that pattern of associated loci. We expect this study, data, and results
are enriched in GO terms related to development. As the mpRILs to provide new insights into C. elegans genetics and eQTLs in gen-
differ in developmental speed, it would be interesting to include eral as well as to be a starting point to further test and develop
it as a covariate and assess its weight in the mapping as has advanced statistical models for detection of eQTLs and systems
been described in Francesconi and Lehner (2014). To allow for genetics studying the genotype–phenotype relationship.
Downloaded from https://academic.oup.com/g3journal/article/11/10/jkab258/6347583 by guest on 20 October 2021
comparison with previous eQTL studies, we decided not to in-
clude development as cofactor in our analysis since this was also
not done in the earlier studies (Rockman et al. 2010; Francesconi Data availability
and Lehner 2014). The data underlying this article available in Sequence Read
We previously found QTLs for several different phenotypes, Archive (SRA; https://www.ncbi.nlm.nih.gov/sra) and can be
such as population growth on different bacteria, sensitivity to accessed with ID PRJNA495983 and in WormQTL2 (http://
heat shock and oxidative stress (Snoek et al. 2019). Four TBs were www.bioinformatics.nl/EleQTL; Snoek et al. 2020).
found to colocate with the previously found phenotypic QTLs Supplementary material is available at G3 online.
(Table 2). Population growth on Erwinia and on Bacillus thuringien-
sis DSM was found to colocate with TB1, which was enriched for
GO terms related to muscle, epidermis, and molting. This could Acknowledgments
indicate a difference in these structures that can affect the inter-
The authors acknowledge financial support from the Deutsche
action with different types of bacteria or could indicate that there
Forschungsgemeinschaft to H.S. (grant number SCHU 1415/11
is a difference in developmental speed through which differences
and project A1 within the CRC 1182) and to PCR (Competence
in the expression, and subsequent eQTLs, of molting-related
Centre for Genomic Analysis (CCGA) No. 07495230). J.E.K. was
genes are picked up. A QTL for heat-shock sensitivity was in-
funded by NIH grant 1R01AA 026658. Furthermore, financial sup-
ferred to colocate with TB4, however, no indication for a link with
port from the NWO-ALW (project 855.01.151) to R.J.M.V. was
this phenotype was found in the annotation of the genes with an
given. M.G.S. was supported by NWO domain Applied and
eQTL at this position. The same was observed for TB5 and the
Engineering Sciences VENI grant (17282). The funders had no role
overlap with population growth on B. thuringiensis, where GO en-
in study design, data collection and analysis, decision to publish,
richment also did not provide any leads to a potential mechanis-
or preparation of the manuscript.
tic link. The overlap between the QTL for sensitivity to oxidative
B.L.S., H.S., and J.E.K. conceived the study; R.J.M.V. and J.R. per-
stress and TB6, however, did show some clues from GO enrich-
formed the experiments; P.C.R. coordinated and supervised tran-
ment as genes involved in the peroxisome as well as DNA replica-
scriptome sequencing; B.L.S., M.G.S., and H.N. analyzed the data,
tion and cuticle formation could be involved in dealing with
B.L.S. wrote the paper with contributions from all authors.
oxidative stress.
We expect to have only found a fraction of the eQTLs, as we
only used a simple additive mapping model, a conservative Funding
score of one eQTL per gene, and standard lab conditions with
This work was supported by the Deutsche Forschungsgemeinschaft
only one time point for RNA isolation. Both the number of
(DFG) nr.1415/11 to H.S., the Competence Centre for genomic analy-
eQTLs and genes with one or more eQTLs are expected to in-
sis nr. 07495230 to P.C.R., the National Institutes of Health (NIH) nr.
crease when more complex models are applied to these data
1R01AA 026658 to J.E.K., the Netherlands Organisation for Scientific
and/or different experimental conditions and time points are
Research nr. 855.01.151 to B.L.S., and the Netherlands Organisation
considered (Vinuela et al. 2010; Francesconi and Lehner 2014;
for Scientific Research nr. 17282 to M.G.S.
Snoek et al. 2017). Moreover, we use an SNP-based method for
eQTL mapping, which has a binary option for each marker and
therefore does not consider the genetic origin (parent) of the Conflicts of interest
SNP. Using the genetic origin of the SNPs could reveal the more
complex genetic interactions that could underlie the differen- The authors declare that there is no conflict of interest.
ces in transcript levels between the mpRILs. These complex ge-
netic interactions are suggested to be present in this mpRIL
population, by the heritability and transgression found. A
Literature cited
model in which each marker has the four parental options Albert FW, Bloom JS, Siegel J, Day L, Kruglyak L. 2018. Genetics of
might indicate loci with more than two alleles affecting gene trans-regulatory variation in gene expression. Elife. 7:e35471.
expression. Furthermore, some (relatively small) genetic loci Andersen EC, Bloom JS, Gerke JP, Kruglyak L. 2014. A variant in the
might have been missed all together as our investigations are neuropeptide receptor npr-1 is a major determinant of
based on the N2 reference genome and wild isolates can have Caenorhabditis elegans growth and physiology. PLoS Genet. 10:
vastly divergent regions of which sequences reads fail to align e1004156.
to the N2 reference genome with conventional methods Ben-David E, Burga A, Kruglyak L. 2017. A maternal-effect selfish ge-
(Thompson et al. 2015; Lee et al. 2021). netic element in Caenorhabditis elegans. Science. 356:1051–1055.B. L. Snoek et al. | 9
Bendesky A, Pitts J, Rockman MV, Chen WC, Tan MW, et al. 2012. Kammenga JE, Doroszuk A, Riksen JA, Hazendonk E, Spiridon L, et al.
Long-range regulatory polymorphisms affecting a GABA receptor 2007. A Caenorhabditis elegans wild type defies the
constitute a quantitative trait locus (QTL) for social behavior in temperature-size rule owing to a single nucleotide polymorphism
Caenorhabditis elegans. PLoS Genet. 8:e1003157. in tra-3. PLoS Genet. 3:e34.
Bendesky A, Tsunozaki M, Rockman MV, Kruglyak L, Bargmann Kang HM, Zaitlen NA, Wade CM, Kirby A, Heckerman D, et al. 2008.
CI.2011. Catecholamine receptor polymorphisms affect Efficient control of population structure in model organism asso-
decision-making in C. elegans. Nature. 472:313–318. ciation mapping. Genetics. 178:1709–1723.
Brady SC, Zdraljevic S, Bisaga KW, Tanny RE, Cook DE, et al. 2019. A Keurentjes JJ, Fu J, Terpstra IR, Garcia JM, van den Ackerveken G, et
novel gene underlies bleomycin-response variation in al. 2007. Regulatory network construction in Arabidopsis by using
Caenorhabditis elegans. Genetics. 212:1453–1468. genome-wide gene expression quantitative trait loci. Proc Natl
Cook DE, Zdraljevic S, Tanny RE, Seo B, Riccardi DD, et al. 2016. The Acad Sci U S A. 104:1708–1713.
genetic basis of natural variation in Caenorhabditis elegans telo- King EG, Merkes CM, McNeil CL, Hoofer SR, Sen S, et al. 2012. Genetic
mere length. Genetics. 204:371–383. dissection of a model complex trait using the Drosophila
Downloaded from https://academic.oup.com/g3journal/article/11/10/jkab258/6347583 by guest on 20 October 2021
Cubillos FA, Stegle O, Grondin C, Canut M, Tisne S, et al. 2014. Synthetic Population Resource. Genome Res. 22:1558–1566.
Extensive cis-regulatory variation robust to environmental per- Kover PX, Valdar W, Trakalo J, Scarcelli N, Ehrenreich IM, et al. 2009.
turbation in Arabidopsis. Plant Cell. 26:4298–4310. A Multiparent Advanced Generation Inter-Cross to fine-map
de Koning DJ, McIntyre LM. 2017. Back to the future: multiparent quantitative traits in Arabidopsis thaliana. PLoS Genet. 5:e1000551.
populations provide the key to unlocking the genetic basis of Kruijer W, Boer MP, Malosetti M, Flood PJ, Engel B, et al. 2015.
complex traits. Genetics. 206:527–529. Marker-based estimation of heritability in immortal populations.
Doroszuk A, Snoek LB, Fradin E, Riksen J, Kammenga J. 2009. A Genetics. 199:379–398.
genome-wide library of CB4856/N2 introgression lines of Large EE, Xu W, Zhao Y, Brady SC, Long L, et al. 2016. Selection on a
Caenorhabditis elegans. Nucleic Acids Res. 37:e110. subunit of the NURF chromatin remodeler modifies life history
Evans KS, van Wijk MH, McGrath PT, Andersen EC, Sterken MG. traits in a domesticated strain of Caenorhabditis elegans. PLoS
2021. From QTL to gene: C. elegans facilitates discoveries of the ge- Genet. 12:e1006219.
netic mechanisms underlying natural variation. Trends Genet. Lee D, Zdraljevic S, Stevens L, Wang Y, Tanny RE, et al. 2021.
Francesconi M, Lehner B. 2014. The effects of genetic variation on Balancing selection maintains hyper-divergent haplotypes in
gene expression dynamics during development. Nature. 505: Caenorhabditis elegans. Nat Ecol Evol. 5:794–807.
208–211. Li H, Handsaker B, Wysoker A, Fennell T, Ruan J, et al.; 1000 Genome
Gao AW, Sterken MG, Uit de Bos J, van Creij J, Kamble R, et al. 2018. Project Data Processing Subgroup. 2009. The sequence align-
Natural genetic variation in C. elegans identified genomic loci con- ment/map format and SAMtools. Bioinformatics. 25:2078–2079.
trolling metabolite levels. Genome Res. 28:1296–1308. Li Y, Alvarez OA, Gutteling EW, Tijsterman M, Fu J, et al. 2006.
Ghosh R, Andersen EC, Shapiro JA, Gerke JP, Kruglyak L. 2012. Mapping determinants of gene expression plasticity by genetical
Natural variation in a chloride channel subunit confers avermec- genomics in C. elegans. PLoS Genet. 2:e222.
tin resistance in C. elegans. Science. 335:574–578. Li Y, Breitling R, Snoek LB, van der Velde KJ, Swertz MA, et al. 2010.
Gilmour AR. 2019. Average InformationREML: an efficient algorithm Global genetic robustness of the alternative splicing machinery
for variance parameter estimation in linear mixed models. J in Caenorhabditis elegans. Genetics. 186:405–410.
Anim Breed Genet. 136: 262–272. McGrath PT, Rockman MV, Zimmer M, Jang H, Macosko EZ, et al.
Gloria-Soria A, Azevedo RB. 2008. npr-1 regulates foraging and dis- 2009. Quantitative mapping of a digenic behavioral trait impli-
persal strategies in Caenorhabditis elegans. Curr Biol. 18:1694–1699. cates globin variation in C. elegans sensory behaviors. Neuron. 61:
Greene JS, Brown M, Dobosiewicz M, Ishida IG, Macosko EZ, et al. 692–699.
2016. Balancing selection shapes density-dependent foraging be- Nakad R, Snoek LB, Yang W, Ellendt S, Schneider F, et al. 2016.
haviour. Nature. 539:254–258. Contrasting invertebrate immune defense behaviors caused by a
Hahnel SR, Zdraljevic S, Rodriguez BC, Zhao Y, McGrath PT, et al. single gene, the Caenorhabditis elegans neuropeptide receptor gene
2018. Extreme allelic heterogeneity at a Caenorhabditis elegans npr-1. BMC Genomics. 17:280.
beta-tubulin locus explains natural resistance to benzimidazoles. Nijveen H, Ligterink W, Keurentjes JJ, Loudet O, Long J, et al. 2017.
PLoS Pathog. 14:e1007226. AraQTL—workbench and archive for systems genetics in
Hartanto M, Joosen RVL, Snoek BL, Willems LAJ, Sterken MG, et al. Arabidopsis thaliana. Plant J. 89:1225–1235.
2020. Network analysis prioritizes DEWAX and ICE1 as the candi- Noble LM, Chang AS, McNelis D, Kramer M, Yen M, et al. 2015.
date genes for two major eQTL hotspots in seed germination. Natural variation in plep-1 causes male-male copulatory behav-
BioRxiv. ior in C. elegans. Curr Biol. 25:2730–2737.
Jimenez-Gomez JM, Wallace AD, Maloof JN. 2010. Network analysis Noble LM, Chelo I, Guzella T, Afonso B, Riccardi DD, et al. 2017.
identifies ELF3 as a QTL for the shade avoidance response in Polygenicity and epistasis underlie fitness-proximal traits in the
Arabidopsis. PLoS Genet. 6:e1001100. Caenorhabditis elegans Multiparental Experimental Evolution
Jovic K, Grilli J, Sterken MG, Snoek BL, Riksen JAG, et al. 2019. (CeMEE) panel. Genetics. 207:1663–1685.
Transcriptome resilience predicts thermotolerance in O’Donnell MP, Chao PH, Kammenga JE, Sengupta P. 2018.
Caenorhabditis elegans. BMC Biol. 17:102. Rictor/TORC2 mediates gut-to-brain signaling in the regulation
Jovic K, Sterken MG, Grilli J, Bevers RPJ, Rodriguez M, et al. 2017. of phenotypic plasticity in C. elegans. PLoS Genet. 14:e1007213.
Temporal dynamics of gene expression in heat-stressed Palopoli MF, Rockman MV, TinMaung A, Ramsay C, Curwen S, et al.
Caenorhabditis elegans. PLoS One. 12:e0189445. 2008. Molecular basis of the copulatory plug polymorphism in
Kamkina P, Snoek LB, Grossmann J, Volkers RJ, Sterken MG, et al. Caenorhabditis elegans. Nature. 454:1019–1022.
2016. Natural genetic variation differentially affects the prote- R Core Team. 2017. R: A Language and Environment for Statistical
ome and transcriptome in Caenorhabditis elegans. Mol Cell Computing. Vienna, Austria: R Foundation for Statistical
Proteomics. 15:1670–1680. Computing. https://www.R-project.org/.10 | G3, 2021, Vol. 11, No. 10
Ranjan A, Budke JM, Rowland SD, Chitwood DH, Kumar R, et al. 2016. Speed D, Hemani G, Johnson MR, Balding DJ. 2012. Improved herita-
eQTL regulating transcript levels associated with diverse biologi- bility estimation from genome-wide SNPs. Am J Hum Genet. 91:
cal processes in tomato. Plant Physiol. 172:328–340. 1011–1021.
Reddy KC, Andersen EC, Kruglyak L, Kim DH. 2009. A polymorphism Stastna JJ, Snoek LB, Kammenga JE, Harvey SC. 2015.
in npr-1 is a behavioral determinant of pathogen susceptibility in Genotype-dependent lifespan effects in peptone deprived
C. elegans. Science. 323:382–384. Caenorhabditis elegans. Sci Rep. 5:16259.
Reiner DJ, Ailion M, Thomas JH, Meyer BJ. 2008. C. elegans anaplastic Sterken MG, Bevers RPJ, Volkers RJM, Riksen JAG, Kammenga JE, et al.
lymphoma kinase ortholog SCD-2 controls dauer formation by 2019. Dissecting the eQTL micro-architecture in Caenorhabditis
modulating TGF-beta signaling. Curr Biol. 18:1101–1109. elegans. BioRxiv.
Rockman MV, Kruglyak L. 2009. Recombinational landscape and Sterken MG, Snoek LB, Kammenga JE, Andersen EC. 2015. The labo-
population genomics of Caenorhabditis elegans. PLoS Genet. 5: ratory domestication of Caenorhabditis elegans. Trends Genet. 31:
e1000419. 224–231.
Rockman MV, Skrovanek SS, Kruglyak L. 2010. Selection at linked Sterken MG, van Bemmelen van der Plaat L, Riksen JAG, Rodriguez
Downloaded from https://academic.oup.com/g3journal/article/11/10/jkab258/6347583 by guest on 20 October 2021
sites shapes heritable phenotypic variation in C. elegans. Science. M, Schmid T, et al. 2017. Ras/MAPK modifier loci revealed by eQTL
330:372–376. in Caenorhabditis elegans. G3 (Bethesda). 7:3185–3193.
Rodriguez M, Snoek LB, Riksen JA, Bevers RP, Kammenga JE. 2012. Sterken MG, van Sluijs L, Wang YA, Ritmahan W, Gultom ML, et al.
Genetic variation for stress-response hormesis in C. elegans life- 2021. Punctuated loci on chromosome IV determine natural vari-
span. Exp Gerontol. 47:581–587. ation in orsay virus susceptibility of Caenorhabditis elegans strains
Rogers C, Persson A, Cheung B, de Bono M. 2006. Behavioral motifs Bristol N2 and Hawaiian CB4856. J Virol. 95:e02430-20.
and neural pathways coordinating O2 responses and aggregation Thompson OA, Snoek LB, Nijveen H, Sterken MG, Volkers RJ, et al.
in C. elegans. Curr Biol. 16:649–659. 2015. Remarkably divergent regions punctuate the genome as-
Schmid T, Snoek LB, Frohli E, van der Bent ML, Kammenga J, et al. sembly of the Caenorhabditis elegans Hawaiian strain CB4856.
2015. Systemic regulation of RAS/MAPK signaling by the seroto- Genetics. 200:975–989.
nin metabolite 5-HIAA. PLoS Genet. 11:e1005236. Tijsterman M, Okihara KL, Thijssen K, Plasterk RH. 2002. PPW-1, a
Seidel HS, Ailion M, Li J, van Oudenaarden A, Rockman MV, et al. PAZ/PIWI protein required for efficient germline RNAi, is defec-
2011. A novel sperm-delivered toxin causes late-stage embryo le- tive in a natural isolate of C. elegans. Curr Biol. 12:1535–1540.
thality and transmission ratio distortion in C. elegans. PLoS Biol. 9: Trapnell C, Pachter L, Salzberg SL. 2009. TopHat: discovering splice
e1001115. junctions with RNA-Seq. Bioinformatics. 25:1105–1111.
Seidel HS, Rockman MV, Kruglyak L. 2008. Widespread genetic in- Trapnell C, Roberts A, Goff L, Pertea G, Kim D, et al. 2012. Differential
compatibility in C. elegans maintained by balancing selection. gene and transcript expression analysis of RNA-seq experiments
Science. 319:589–594. with TopHat and Cufflinks. Nat Protoc. 7:562–578.
Singh KD, Roschitzki B, Snoek LB, Grossmann J, Zheng X, et al. 2016. Vinuela A, Snoek LB, Riksen JA, Kammenga JE. 2010. Genome-wide
Natural genetic variation influences protein abundances in C. ele- gene expression regulation as a function of genotype and age in
gans developmental signalling pathways. PLoS One. 11:e0149418. C. elegans. Genome Res. 20:929–937.
Snoek BL, Sterken MG, Bevers RPJ, Volkers RJM, Van’t Hof A, et al. Vinuela A, Snoek LB, Riksen JA, Kammenga JE. 2012. Aging uncouples
2017. Contribution of trans regulatory eQTL to cryptic genetic heritability and expression-QTL in Caenorhabditis elegans. G3
variation in C. elegans. BMC Genomics. 18:500. (Bethesda). 2:597–605.
Snoek BL, Sterken MG, Hartanto M, van Zuilichem AJ, Kammenga JE, Volkers RJ, Snoek LB, Hubar CJ, Coopman R, Chen W, et al. 2013.
et al. 2020. WormQTL2: an interactive platform for systems genet- Gene-environment and protein-degradation signatures charac-
ics in Caenorhabditis elegans. Database. 2020:baz1149. terize genomic and phenotypic diversity in wild Caenorhabditis ele-
Snoek BL, Volkers RJM, Nijveen H, Petersen C, Dirksen P, et al. 2019. A gans populations. BMC Biol. 11:93.
multi-parent recombinant inbred line population of C. elegans West MA, Kim K, Kliebenstein DJ, van Leeuwen H, Michelmore RW,
allows identification of novel QTLs for complex life history traits. et al. 2007. Global eQTL mapping reveals the complex genetic ar-
BMC Biol. 17:24. chitecture of transcript-level variation in Arabidopsis. Genetics.
Snoek LB, Joeri van der Velde K, Li Y, Jansen RC, Swertz MA, et al. 175:1441–1450.
2014a. Worm variation made accessible: take your shopping cart Wickham H. 2009. GGplot2: elegant graphics for data analysis.
to store, link, and investigate! Worm. 3:e28357. Zdraljevic S, Fox BW, Strand C, Panda O, Tenjo FJ, et al. 2019.
Snoek LB, Orbidans HE, Stastna JJ, Aartse A, Rodriguez M, et al. 2014b. Natural variation in C. elegans arsenic toxicity is explained by dif-
Widespread genomic incompatibilities in Caenorhabditis elegans. ferences in branched chain amino acid metabolism. Elife. 8:
G3 (Bethesda). 4:1813–1823. e40260.
Snoek LB, Sterken MG, Volkers RJ, Klatter M, Bosman KJ, et al. 2014c. Zdraljevic S, Strand C, Seidel HS, Cook DE, Doench JG, et al. 2017.
A rapid and massive gene expression shift marking adolescent Natural variation in a single amino acid substitution underlies
transition in C. elegans. Sci Rep. 4:3912. physiological responses to topoisomerase II poisons. PLoS Genet.
Snoek LB, Terpstra IR, Dekter R, Van den Ackerveken G, Peeters AJ. 2012. 13:e1006891.
Genetical genomics reveals large scale genotype-by-environment Zych K, Snoek BL, Elvin M, Rodriguez M, Van der Velde KJ, et al. 2017.
interactions in Arabidopsis thaliana. Front Genet. 3:317. reGenotyper: detecting mislabeled samples in genetic data. PLoS
Snoek LB, Van der Velde KJ, Arends D, Li Y, Beyer A, et al. 2013. One. 12:e0171324.
WormQTL–public archive and analysis web portal for natural varia-
tion data in Caenorhabditis spp. Nucleic Acids Res. 41:D738–D743. Communicating editor: M. RockmanYou can also read