Insights into long non coding RNA regulation of anthocyanin carrot root pigmentation - Nature
←
→
Page content transcription
If your browser does not render page correctly, please read the page content below
www.nature.com/scientificreports
OPEN Insights into long non‑coding RNA
regulation of anthocyanin carrot
root pigmentation
Constanza Chialva1,3, Thomas Blein2,3, Martin Crespi2* & Diego Lijavetzky1*
Carrot (Daucus carota L.) is one of the most cultivated vegetable in the world and of great importance
in the human diet. Its storage organs can accumulate large quantities of anthocyanins, metabolites
that confer the purple pigmentation to carrot tissues and whose biosynthesis is well characterized.
Long non-coding RNAs (lncRNAs) play critical roles in regulating gene expression of various biological
processes in plants. In this study, we used a high throughput stranded RNA-seq to identify and analyze
the expression profiles of lncRNAs in phloem and xylem root samples using two genotypes with a
strong difference in anthocyanin production. We discovered and annotated 8484 new genes, including
2095 new protein-coding and 6373 non-coding transcripts. Moreover, we identified 639 differentially
expressed lncRNAs between the phenotypically contrasted genotypes, including certain only
detected in a particular tissue. We then established correlations between lncRNAs and anthocyanin
biosynthesis genes in order to identify a molecular framework for the differential expression of
the pathway between genotypes. A specific natural antisense transcript linked to the DcMYB7 key
anthocyanin biosynthetic transcription factor suggested how the regulation of this pathway may have
evolved between genotypes.
Anthocyanins are flavonoids, a class of phenolic compounds synthesized via the phenylpropanoid pathway,
a late branch of the shikimic acid pathway1. They are secondary metabolites that confer purple, red, and blue
pigmentation to several organs and tissues of many plant species2. These water-soluble pigments serve in various
roles in the plant, including attracting pollinators to flowers and seed dispersers to fruits, protection against UV
radiation, amelioration of different abiotic and biotic stresses, such as drought, wounding, cold temperatures,
and pathogen a ttacks3,4, as well as participation in physiological processes such as leaf s enescence5,6. As dietary
components, anthocyanins possess various health-promoting effects, mainly due to their antioxidant and anti-
inflammatory properties, including protection against cancer, strokes and other chronic human disorders7.
Carrot (Daucus carota subsp. carota L.; 2n = 2x = 18) is a globally important root crop with yellow and purple
as the first documented colors for domesticated carrot in Central Asia approximately 1100 years a go8. Orange
carrots were not reliably reported until the sixteenth century in E urope9,10, where its popularity was fortuitous for
modern consumers because the orange pigmentation results from high quantities of α- and β-carotene, making
carrots the richest source of provitamin A in the US d iet11. Additionally, with its great nutrition and economic
value, carrot has been well known as a nice model plant for genetic and molecular studies11. Carrot is one of
the crops that can accumulate large quantities of anthocyanins in its storage roots (up to 17–18 mg/100 g fresh
weight)12. Purple carrots accumulate almost exclusively derivatives of cyanidin glycosides with five cyanidin
pigments reported in most s tudies13,14. The root content of these five anthocyanin pigments vary across carrot
genetic backgrounds12,15. In addition, anthocyanin pigmentation also varies between root tissues, ranging from
fully pigmented roots (i.e., purple color in the root phloem and xylem) to pigmentation only in the outer-most
layer of the phloem16,17.
Regardless of the plant species, at least two classes of genes are involved in anthocyanin biosynthesis: struc-
tural genes encoding the enzymes that directly catalyze the production of anthocyanins, and regulatory genes
that control the transcription of structural g enes18,19. In most cases, the anthocyanin biosynthetic structural
genes are regulated by transcription factors (TFs) belonging to the R2R3–MYB, basic helix–loop–helix (bHLH)
and WD-repeat protein families, in the form of the ‘MBW’ complex19,20. Recent reports pointed out that gene
1
Facultad de Ciencias Agrarias, Instituto de Biología Agrícola de Mendoza (IBAM), UNCuyo, CONICET, Almirante
Brown 500, M5528AHB Chacras de Coria, Mendoza, Argentina. 2Institute of Plant Sciences Paris‑Saclay (IPS2),
CNRS, INRA, University Paris-Saclay and University of Paris, Batiment 630, Gif Sur Yvette, France. 3These authors
contributed equally: Constanza Chialva and Thomas Blein. *email: martin.crespi@ips2.universite‑paris‑saclay.fr;
dlijavetzky@conicet.gov.ar
Scientific Reports | (2021) 11:4093 | https://doi.org/10.1038/s41598-021-83514-4 1
Vol.:(0123456789)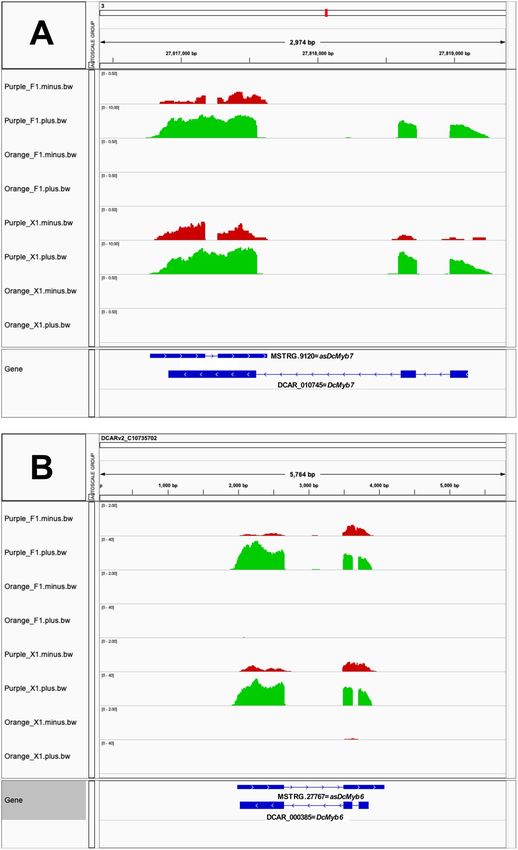
www.nature.com/scientificreports/
regulation by TFs may play a key role controlling anthocyanin pigmentation in purple c arrots17,21,22. Moreover,
the broad variation observed among purple carrot root genotypes, regarding both anthocyanin concentration and
pigment distribution in the phloem and xylem tissues, suggests independent genetic regulation in these two root
tissues23. In this sense, Xu et al.16 found that the expression pattern of a R2R3–MYB TF, DcMYB6, is correlated
with anthocyanin production in carrot roots and that the overexpression of this gene in Arabidopsis thaliana
enhanced anthocyanin accumulation in vegetative and reproductive tissues in this heterologous system. Similarly,
Kodama et al.24 found that a total of 10 MYB, bHLH and WD40 genes were consistently up- or downregulated in
a purple color-specific manner, including DcMYB6. Iorizzo et al.25 identified a cluster of MYB TFs, with DcMYB7
as a candidate gene for root and petiole pigmentation, and DcMYB11 as a candidate gene for petiole pigmenta-
tion. Bannoud et al.23 showed that DcMYB7 and DcMYB6 participate in the regulation of phloem pigmentation
in purple-rooted samples. Finally, Xu et al.26, by means of loss- and gain-of-function mutation experiments,
demonstrated that DcMYB7 is the main determinant that controls purple pigmentation in carrot roots.
Non-coding RNAs with a length higher than 200 nucleotides are defined as long noncoding RNAs (lncR-
NAs). They were originally considered to be transcriptional byproducts, or transcriptional ‘noise’, and were often
dismissed in transcriptome analyses due to their low expression and low sequence conservation compared with
protein-coding mRNAs. However, specific lncRNAs were shown to be involved in chromatin modification,
epigenetic regulation, genomic imprinting, transcriptional control as well as pre- and post-translational mRNA
processing in diverse biological processes in p lants27–30. Certain lncRNAs can be precursors of small interfering
RNA (siRNA) or microRNA (miRNAs), triggering the repression of protein-coding genes at the transcription
level (transcriptional gene silencing or TGS) or at post-transcriptional level (PTGS)27,31. Additionally, other
lncRNAs can act as endogenous target mimics of miRNAs, to fine-tune the miRNA-dependent regulation of
target genes32,33. It has been suggested that lncRNAs can regulate gene expression in both the cis- and trans-
acting mode35. The cis-acting lncRNAs can be classified by their relative position to annotated g enes27,34,35 and
notably include long noncoding natural antisense (lncNATs) transcribed in opposite strand of a coding gene,
overlapping with at least one of its exons36,37. Other so-called intronic lncRNAs are transcribed within introns
of a protein-coding g ene38 whereas long intergenic ncRNAs (lincRNAs) are transcripts located farther than 1 kb
from protein-coding g enes27,34,35. Among these cis-lncRNAs, NATs are of special interest as they have been shown
to provide a mechanism for locally regulating the transcription or translation of the target gene on the other
strand, providing novel mechanisms involved in the regulation of key biological processes39, plant development40
and environmentally dependent gene expression36,37.
As mentioned above, several differential expression analyses have been performed between purple and non-
purple carrot roots allowing the identification of the main structural genes and TFs involved in anthocyanin bio-
synthesis in whole roots and/or phloem tissues16,21,23–26. However, the identification and functional prediction of
lncRNA in carrot or putatively involved in carrot anthocyanin biosynthesis regulation has not yet been reported.
In the present study, we combined a high throughput stranded RNA-Seq based approach with a dedicated bioin-
formatic pipeline, to annotate lncRNAs and analyze the expression profiles of lncNATs putatively associated to
the carrot root anthocyanin biosynthesis regulation. In addition, we individually analyzed the gene expression
patterns in phloem and xylem root of purple and orange D. carota genotypes. Our findings point to a role of
antisense transcription in the anthocyanin biosynthesis regulation in the carrot root at a tissue-specific level.
Results
RNA‑seq data mining, identification and annotation of anthocyanin‑related lncRNAs. In
order to thoroughly identify and annotate lncRNAs related to anthocyanin biosynthesis regulation in carrot
roots, we performed a whole transcriptome RNA-seq analysis of specific tissues from the carrot genotypes
‘Nightbird’ (purple phloem and xylem) and ‘Musica’ (orange phloem and xylem) (Supplementary Figure S1). We
generated an average of 51.4 million of reads per sample from the 12 carrot root samples (i.e., two phenotypes
× two tissues × three biological replicates), ranging from 43.5 million to 60.3 million. The average GC content
(%) was 44.8% and the average ratio of bases that have p hred41 quality score of over 30 (Q30) was 94.1%. The
average mapping rate to the carrot genome was 90.9% (Supplementary Table S1). We identified and annotated
8484 new transcripts, including 2095 new protein-coding and 6373 non-coding transcripts (1521 lncNATs, 4852
lincRNAs and 16 structural transcripts) (Supplementary Table S2 and Supplementary File S1). Those were added
to the 34,263 known carrot t ranscripts42 to complete the final set of 42,747 transcripts used for this work. The set
contains 34,204 coding transcripts and 7288 noncoding transcripts (1521 lncNATs, 5767 lincRNAs) and 1255
structural transcripts (Fig. 1A and Supplementary Table S3). As expected, the newly predicted protein-coding
genes carry ORFs presenting strong homologies with already annotated ones. In contrary, the great majority of
the newly predicted non-coding transcripts present no conservation of their predicted ORFs43,44 (Fig. 1B). Most
non-coding transcripts presented less than 1000 bp long, being 400–800 bp the most frequent length class. Cod-
ing transcripts between 500 and 1000 bp long were the most frequent, while most structural transcripts presented
less than 200 bp (Fig. 1C). Noncoding transcripts predominantly presented one exon and unexpectedly45, only
one exon was also the most frequent class for coding transcripts (Fig. 1D). Additionally, we found no particular
bias for the distribution of the noncoding transcripts along the nine carrot chromosomes (Fig. 1E). Finally, the
expression level of the coding sequences (measured as normalized counts) was similar within the known, novel
and total transcripts. This was also observed for the noncoding transcripts. As expected, the expression level of
the coding genes was higher than that of the noncoding ones independently if they were already known or newly
predicted (Fig. 1F). Normalized counts for each of the 12 sequenced libraries were included in Supplementary
Table S4.
Scientific Reports | (2021) 11:4093 | https://doi.org/10.1038/s41598-021-83514-4 2
Vol:.(1234567890)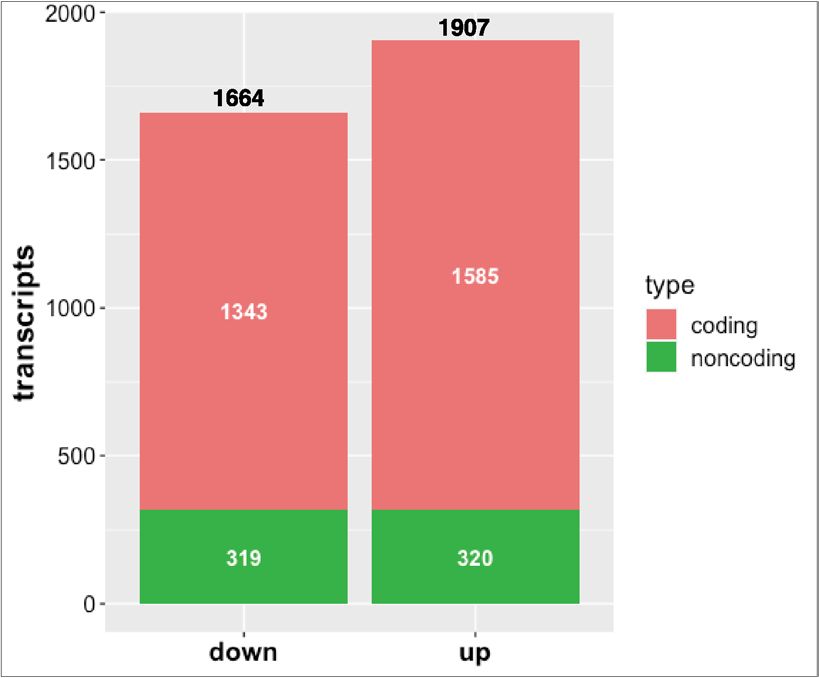
www.nature.com/scientificreports/

                                  Figure 1.  Characteristics of carrot transcripts. (A) Distribution of coding, noncoding and structural sequences
                                  between the known and newly annotated transcripts. (B) Conservation of the known and newly predicted
                                  protein-coding and non-coding transcripts. (C) Transcript length distributions for the total coding, noncoding
                                  and structural RNAs. (D) Number of exons per transcript for the total coding and noncoding RNAs. (E)
                                  Proportional distribution of the total coding, noncoding and structural RNAs along each chromosome. (F)
                                  Violin plot of the expression levels of carrot total coding and noncoding RNAs. The y-axis represents the average
                                  log2 of normalized count values. t-test p value < 0.01 is considered to be significantly different.

                                  Variation in coding and noncoding expression was mainly explained by the anthocyanin‑pig‑
                                  mentation phenotype difference between orange and purple carrots. We sampled phloem and
                                  xylem tissues from orange and purple carrot genotypes (Supplementary Figure S1). Considering the global gene
                                  variation of the 12 evaluated libraries (i.e., three for each phenotype/tissue combination), the color phenotype
                                  was clearly the main source of variation (PC1, 49%), while the tissue specificity factor was also important albeit
                                  less significant (PC2, 18%), (Fig. 2A).
                                      We then assessed the variation in mRNA and ncRNA gene expression between purple and orange carrot roots
                                  in our RNA-seq analysis. A total of 3567 genes were differentially expressed (DEG) between purple and orange
                                  carrots (Bonferroni’s adjusted p value < 0.01), divided in 2928 mRNA and 639 lncRNAs (Fig. 2B) and representing
                                  10% and 15% of the mRNA and lncRNA expressed genes, respectively. Within the 3567 DEGs, we found 1664
                                  downregulated and 1907 upregulated transcripts. In turn, the downregulated transcripts were distributed into
                                  1343 coding and 319 noncoding transcripts, while the upregulated were divided into 1585 and 320 coding and
                                  noncoding transcripts, respectively (Fig. 2B). All information concerning the differentially expressed analysis
                                  and gene annotation is detailed in Supplementary Table S5.

Scientific Reports |   (2021) 11:4093 |                https://doi.org/10.1038/s41598-021-83514-4                                                 3

                                                                                                                                             Vol.:(0123456789)
www.nature.com/scientificreports/
Figure 2. Expression of carrot coding and noncoding RNAs. (A) PCA analysis of the global gene expression
of the 12 evaluated libraries (three replicates for each color-phenotype and tissue type combination). (B)
Differentially expressed genes (up- and down-regulated) between purple and orange carrots (Bonferroni’s
adjusted p value < 0.01) distributed by coding and noncoding transcripts.
As expected, we identified several differentially expressed genes (DEG) between the two genotypes known
to be involved in carrot root anthocyanin b iosynthesis21,23–26. Most of the known genes of the pathway and
their main regulators were differentially expressed between the two genotypes (Supplementary Table S5). Sev-
eral genes were induced in purple tissues and they mainly comprised genes representing: (1) the early step
in the flavonoid/anthocyanin pathway, like chalcone synthase (DcCHS1/DCAR_030786); chalcone isomerase
(DcCHI1/DCAR_027694) and (DcCHIL/DCAR_019805); flavanone 3-hydroxylase (DcF3H1/DCAR_009483),
and flavonoid 3′-hydroxylase (DcF3′H1/DCAR_014032); (2) cytochrome P450 (CYP450) proteins, putatively
related to the flavonoid and isoflavonoid biosynthesis pathways23,46; (3) ATP-binding cassette (ABC) transporters,
potentially related to anthocyanin t ransport47,48; and (4) genes from the late steps of the pathway, like dihydro-
flavonol 4-reductase (DcDFR1/DCAR_021485), leucoanthocyanidin dioxygenase (DcLDOX1/DCAR_006772),
and UDP-glycosyltransferase (DcUFGT/DCAR_009823) and the recently described DcUCGXT1/DCAR_021269
and DcSAT1/MSTRG.8365, which were confirmed to be responsible for anthocyanin glycosylation and acylation,
respectively26,49. Finally, the most significant regulatory genes of the pathway, belonging to the MYB, bHLH and
WD40 TF gene families21,23–26 were also differentially expressed between purple and orange genotypes (Sup-
plementary Table S5). We further analyzed the tissue differential expression distribution of those 26 ‘MBW’
TFs and found that DcMYB6 and DcMYB7, the two most studied TFs associated with anthocyanin biosynthesis
regulation23–26, were differentially expressed between purple and orange carrots, both in phloem and xylem
tissues (Supplementary Figure S2). Interestingly, three genes recently described to be regulated by DcMYB726
(i.e. DcbHLH3, DcUCGXT1 and DcSAT1) also displayed no tissue specificity. DcbHLH3 was described as a co-
regulator in anthocyanin biosynthesis, while DcUCGXT1 and DcSAT1 participate in anthocyanin glycosylation
and acylation, r espectively26,49. Additionally, seven TFs showed xylem preferential expression-specificity, while
only one was preferentially expressed specifically in phloem. Finally, differential expression of 11 TFs was just
detected when the 12 libraries were jointly analyzed, presumably because they have significant but low expres-
sion differences (Supplementary Figure S2).
Putative regulation of anthocyanin‑related genes by carrot antisense lncRNAs. In order to
investigate the putative involvement of carrot lncRNAs in the regulation of the anthocyanin biosynthesis in
different carrot root tissues, we predicted the potential targets of lncRNAs in cis-regulatory relationship, par-
ticularly those classified as natural antisense transcripts (lncNATs). The selection of such lncRNAs was based
on three assumptions: (1) both, the lncRNA and the putative target were differentially expressed between pur-
ple and orange tissues (Supplementary Table S5); (2) the lncRNAs were antisense of the target genes; and (3)
the Pearson and Spearman correlation coefficients between the expression levels of these genes were ≥ 0.70
or ≤ −0.70, and p < 0.01.
According to these criteria, we found 19 differentially expressed lncNATs, since the lncRNAs were located in
the antisense orientation (in the opposite strand) to a target mRNA, being most of them fully overlapping pairs
(Supplementary Table S5 and S6). About 79% of those lncNATs were expressed in concordance with the sense
strand transcript, while five out of the 19 presented discordant expression (i.e. when the lncNAT expression
increase, the sense strand transcript was repressed) (Supplementary Table S5 and S6). Interestingly, we detected
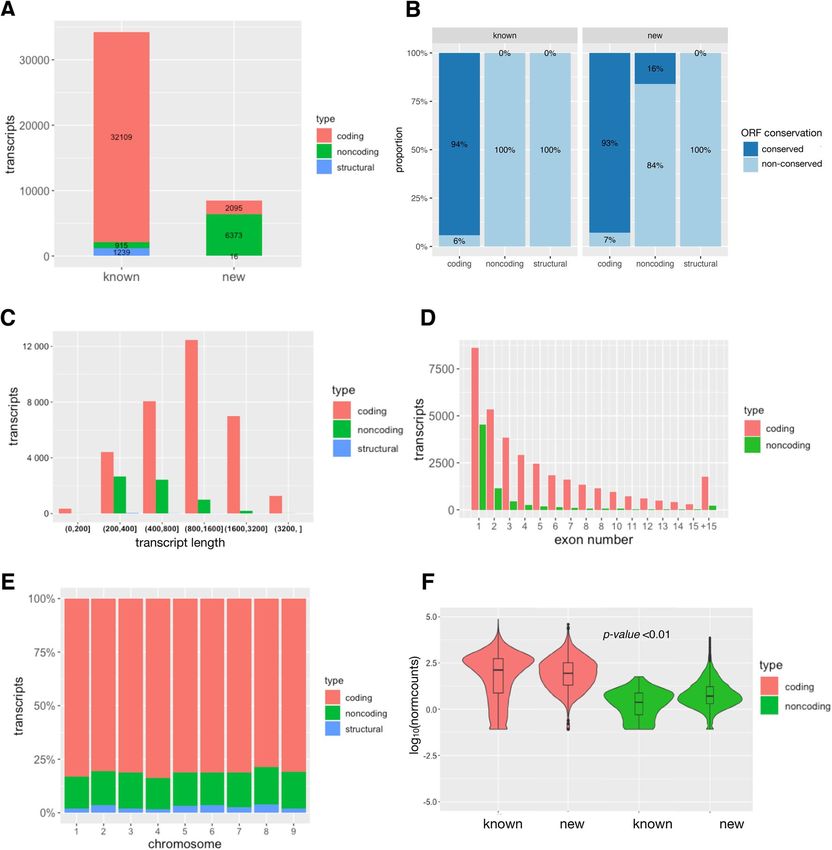
two lncNATs (MSTRG.27767/asDcMyb6 and MSTRG.9120/asDcMyb7) in antisense relationship to the critical
regulators DcMYB6 and DcMYB7, respectively, with concordant expression correlation (Fig. 3). DcMYB6 showed
a log2 fold-change of 7.6 with an adjusted p value of 4.5 × 10⁻³⁰, while DcMYB7 presented a l og2 fold-change of
11.7 with an adjusted p value of 3.8 × 10–37. Accordingly, the two detected antisense lncRNAs also presented
significant differential expression, where asDcMYB6 displayed a l og2 fold-change of 6.5 with an adjusted p value
Scientific Reports | (2021) 11:4093 | https://doi.org/10.1038/s41598-021-83514-4 4
Vol:.(1234567890)www.nature.com/scientificreports/
Figure 3. Strand specific expression of R2R3–MYB TFs and their lncNATs. Coverage data for the sense
(green) and antisense (red) strands corresponding to DcMYB7/asDcMYB7 (A) and DcMYB6/as DcMYB6 (B),
respectively. Tracks correspond to four carrot libraries: two phloem samples Purple_F1 and Orange F1; and two
xylem samples Purple_X1 and Orange_X1. Data Range of each track was set to allow an even visualization of
the mRNA and lncRNA transcripts by enlarging the last ones (20x).
of 2.1 × 10⁻¹³ and asDcMYB7 presented a log2 fold-change of 6.1 with an adjusted p value of 1.3 × 10–04 (Sup-
plementary Table S5). Finally, the Pearson and Spearman correlation coefficients between the expression levels
of each sense/antisense pair were ≥ 0.79 and p value < 0.01 (Supplementary Table S6). On the other hand, as also
detailed in Supplementary Table S5, two out of the four lncNATs showing discordant expression were found
in the antisense relationship with disease resistance related genes (a predicted Catalase, and probable disease
resistance protein At5g63020).
Scientific Reports | (2021) 11:4093 | https://doi.org/10.1038/s41598-021-83514-4 5
Vol.:(0123456789)www.nature.com/scientificreports/
Figure 4. Comparison of expression results from RNA-Seq ( log10 of normalized counts) and RT-qPCR
(Relative expression) methods for DcMyb6, DcMyb7 and their corresponding lncNATs. Data are means ± SD
of three biological replicates. For RT-qPCR, carrot actin-7 was used as reference gene and ‘Purple phloem’ as
reference sample. ND not detected.
The differential expression of DcMYB6 and DcMYB7 and their lncNATs was validated by
RT‑qPCR. In order to validate the differential expression results obtained by RNA-seq, we performed a RT-
qPCR analysis of DcMYB6 and DcMYB7 and their corresponding lncNATs (asDcMYB6and asDcMYB7). As
shown in Fig. 4, the expression of the four genes was detected by RNA-seq and RT-qPCR in all purple samples,
being mostly undetected in orange tissues. Moreover, both techniques allowed the detection of gene expression
in orange tissues only for DcMYB6, displaying significantly lower values than in purple tissues. The compara-
tive RT-qPCR expression of the four genes in purple phloem and xylem tissues is presented in Supplementary
Figure S3.
Discussion
The presence of color in flowers, fruits and other organs and tissues, plays several biological functions mostly
driven by the adaptive behavior of plants in response to the environment2,20,50,51. But in turn, plant organ pig-
mentation has served as a natural genetic marker since the early works of Mendel52,53. Anthocyanins are fla-
vonoid pigments that accumulate in plant cell v acuoles54 and are mainly responsible for most tissue and organ
coloration19,20,50. Genetic analyses using model plant species like Arabidopsis, petunia and maize allowed the
identification of most structural genes in the anthocyanin biosynthesis pathway as well as the main regula-
tory genes controlling pigment synthesis. In carrot, anthocyanin pigmentation is responsible for the purple
phenotype9,55. Two main genes, P1 and P3, have been identified in chromosome 3 and suggested to be responsi-
ble for the two independent mutations underlying the domestication of purple carrots17. Despite several carrot
structural genes from the anthocyanin biosynthesis pathway have shown expression correlation with the purple
phenotype21,22, none of them co-localize with P1 and P3. A similar situation occurs in other plants like grapevine,
where accumulation of anthocyanins correlated with the expression of several structural genes of the pathway
but none of them co-localized with the ‘color locus’ in chromosome 256,57. Finally, this discrepancy was solved by
a study describing an insertion mutation in the promotor of a R2R3–MYB TF (i.e. VviMybA1)58 explaining the
lack of color of white grapevine cultivars. In the same direction, several recent works16,23–25,49 focused on the role
of carrot TFs putatively involved in the regulation of anthocyanin biosynthesis in purple genotypes, particularly
those belonging to the ‘MBW’ complex (i.e., R2R3–MYB, basic helix–loop–helix -bHLH- and WD-repeat TFs).
Two recent reports showed that three R2R3–MYB TFs are involved in the P1 and P3 loci: DcMYB113 has been
suggested to correspond to P149, while DcMYB6 and DcMYB7 were proposed as the two main candidate TFs
underlying the carrot root anthocyanin pigmentation in the P3 locus25. However, knockdown and overexpression
functional analyses demonstrated that DcMYB7 (but not DcMYB6) is the P3 gene controlling purple pigmentation
in carrot r oots26. Likewise described for the grapevine VviMybA1 gene58, non-purple carrot genotypes seems to
arise by an insertion mutation in the promoter region of DcMYB726, yet the authors imply the existence of an
additional genetic factor suppressing the expression of DcMYB7 in non-purple pigmented peridermal carrot
root tissues.
In this work, we performed a thorough transcriptomic analysis by comparing two carrot hybrids with con-
trasted anthocyanin pigmentation phenotypes (i.e. purple vs. orange), both in phloem and xylem tissues. The
study corroborates the involvement of the principal reported structural genes of the anthocyanin biosynthesis
pathway21,22, but mostly, the key TF genes reported as the main regulators explain the carrot purple phenotype
(i.e. DcMYB6 and DcMYB7)16,25,26. Interestingly, the performed dissection between phloem and xylem purple
samples, allowed us to show that there is no tissue-specific expression of such key genes, contrary to previously
Scientific Reports | (2021) 11:4093 | https://doi.org/10.1038/s41598-021-83514-4 6
Vol:.(1234567890)www.nature.com/scientificreports/
suggested for DcMYB6 and DcMYB716,23,25. One possible explanation for such discrepancy is that none of the
reported works16,23,25 performed phloem and xylem transcriptomic analyses independently.
We showed here a first whole genome identification and annotation of lncRNAs in carrot by combining a
high throughput stranded RNA-Seq based approach with a focused bioinformatic pipeline. Through this process,
we identified 6373 novel lncRNAs, as compared to the 915 sequences annotated in the original carrot genome
assembly42. Moreover, 10% of them (641 genes) can be defined as anthocyanin biosynthesis-related lncRNAs
since we found them differentially expressed between purple and orange carrots. In order to assess the presumed
function of such lncRNAs, we focused on those showing an antisense relationship with differentially expressed
protein coding genes, known (or putatively) involved in carrot anthocyanin biosynthesis and depicted in the
precedent paragraph. Additionally, the selected lncNATs had to present a statistically significant Pearson and
Spearman correlation with their putative targets to further refine our functional predictions. This led us to iden-
tify 19 differentially expressed lncNATs between purple and orange carrots. Interestingly, we found two of these
lncNATs (asDcMYB6 and asDcMYB7) transcribed in opposite direction to DcMYB6 and DcMYB7, respectively.
Moreover, asDcMYB6 and asDcMYB7 exhibited concordant expression patterns with their corresponding sense
transcripts opening the possibility that non-coding RNA antisense transcription is a new player in the regulation
of carrot anthocyanin biosynthesis, through DcMYB7 (and/or DcMYB6). This regulation maybe linked to the
previously proposed unknown genetic factors26.
Antisense transcripts, particularly lncNATs, present in many genomes of diverse kingdoms, showed either
positively or negatively correlated expression with their corresponding sense transcripts. This antisense lncRNAs
regulate the expression of their sense transcripts in a negative or positive way, by means of different transcrip-
tional or post-transcriptional mechanisms. In particular cases, upregulation of sense gene expression may be
explained by the participation of a lncNAT in the inhibition of other factors at translational level, such as efficient
translation initiation or elongation59–61.
In plants, both repression and activation roles have been assigned to some lncNATs in response to environ-
mental conditions. While COOLAIR and COLDAIR negatively regulates FLC in vernalization r esponses38,62,
and SVALKA controls CBF1 expression to consequently regulate freezing tolerance37, the expression of another
member of the FLC family (MAF4) is activated by the lncNAT MAS to fine-tune flowering t ime36. On the other
hand, a rice lncNAT (TWISTED LEAF) have shown to maintains leaf blade flattening by regulating its associ-
ated sense R2R3-MYB gene40.
Anthocyanins are known to participate in abiotic stress responses and adaptation to environmental
variations3,4,63, so the evolutionary role of the newly identified antisense transcripts asDcMYB7 and asDcMYB6
may be linked to the activation of anthocyanin biosynthesis through DcMYB7 and DcMYB6. Hence, our work
hints to new antisense regulations potentially involved in the variable expression of anthocyanin genes among
carrot ecotypes.
Methods
Sample preparation and plant material. Total RNA was obtained independently from three biological
replicates of phloem and xylem root samples of two Daucus carota L genotypes: ‘Nightbird’, a purple root hybrid
(purple phloem and xylem) and ‘Musica’, a non-anthocyanin pigmentated root hybrid. Plants were germinated
from seeds and roots were collected after 12 weeks. Frozen samples were grinded using liquid nitrogen and RNA
was extracted using TRI Reagent® (Sigma-Aldrich) and purified using SV Total RNA Isolation System (Pro-
mega). RNA samples were quantified, and purity measured using a spectrophotometer (AmpliQuant AQ-07).
RNA integrity and potential genomic DNA contaminations were checked through agarose gel electrophoresis.
Library construction and RNA sequencing. Twelve samples (two genotypes × two tissues × three bio-
logical replicates) were sent to the Macrogen sequencing service (Seoul, Korea). Once in destination they were
checked for total RNA integrity using a Bioanalyzer RNA Nano 6000 chip. All the samples qualified to proceed
with the library construction having an RNA Integrity Number (RIN) ≥ 7. NGS transcriptomic libraries were
constructed using a TruSeq Stranded mRNA LT Sample Prep Kit (Illumina). To verify the size of PCR enriched
fragments, the template size distribution was checked on an Agilent Technologies 2100 Bioanalyzer using a DNA
1000 chip. The sequencing of libraries was performed as paired-end 101 bp reads on an Illumina HiSeq 2500
platform. The quality of the raw reads in the FastQ files was checked through FastQC64 and were then trimmed
for sequencing adaptor and low quality sequences using Trimmomatic65 using ‘ILLUMINACLIP:TruSeq3-PE.
fa:2:30:10 LEADING:21 TRAILING:21 MINLEN:30’ as parameters. For removing reads corresponding to
remaining ribosomal RNA, trimmed reads were mapped to the rRNA reference using SortMeRNA66 using ‘-ref
silva-bac-16s-id90.fasta --ref silva-bac-23s-id98.fasta --ref silva-euk-18 s-id95.fasta --ref silva-euk-28s-id98.
fasta --paired_in --fastx --log -e 1e−07 -a 4 -v’ as parameters.
New transcripts assembly and lncRNA identification. Clean filtered reads were aligned on the D.
carota genome42 using the STAR a ligner67 using ‘--alignIntronMin 20 --alignIntronMax 20,000 --outSAMtype
BAM SortedByCoordinate --outReadsUnmapped Fastx’ as parameters. Subsequently, the aligned reads were
assembled by means of S tringTie68 and new transcripts were extracted and annotated using the GffCompare69
program (GffCompare classes “u”, “x”, to adjust). Only new transcripts whose length was greater than 200 nt were
kept. The classification of the newly predicted transcript was performed as follow: (1) coding, if their predicted
open reading frame (ORF) was greater than 120 aa or if they were predicted as coding by CPC270 calculator; (2)
structural, in case of homology with structural RNA (tRNA, rRNA, snRNA or snoRNA) after the analysis against
Rfam71; and (3) non-coding, if they were predicted as non-coding by CPC2 calculator or in case of homology
with known structured non-coding RNA in Rfam (miRNA precursors, lncRNA). For each transcript, the longest
Scientific Reports | (2021) 11:4093 | https://doi.org/10.1038/s41598-021-83514-4 7
Vol.:(0123456789)www.nature.com/scientificreports/
ORF on the forward strand with at least 70 amino acid was predicted using TransDecoder ("-S -m 50", v5.5.0)72.
Each ORFs was then search against UniRef90 using DIAMOND v2.0.673. Hits with an e-value lower than 1e−10
were considered as positive.
Differential expression analysis. We performed a strand-specific read counting of coding and non-
coding gene using on the carrot official annotation and the newly predicted genes of this study for each of the
12 aligned BAM files by means of the f eatureCount74 software included in the Rsubread p ackage75. The resulted
76
normalized counts (median of ratios) were used for differential expression analysis with D Eseq277. Differen-
tially expressed genes were declared as having a Bonferroni’s adjusted p value < 0.01. Reads corresponding to the
strand specific expression of mRNAs and their lncNATs were visualized with the Integrative Genomics Viewer
(IGV) software78. Additional Venn diagrams were performed with Venny v2.179.
Real‑time quantitative PCR (RT‑qPCR) expression analysis. One microgram of total RNA from
each of the 12 carrot samples described above was used for RT-qPCR. Protocols for cDNA synthesis and RT-
qPCR were performed according to Lijavetzky et al. (2008) using a StepOne Plus Real-Time PCR System
(Applied Biosystems, Life Technologies). Non-template controls were included for each primer pair, and each
RT-qPCR reaction was completed in triplicate. Expression data were normalized against the carrot actin-7
gene (LOC108202619). Relative quantification was performed by means of the ΔΔCt method using the ‘pcr’
R package80. Gene-specific primers were designed using the Primer Blast web tool81 and the sequences are
described in Supplementary Table S7.
Data availability
Sequence files generated during this study have been deposited into the NCBI BioProject database accession
PRJNA668894.
Received: 14 October 2020; Accepted: 4 February 2021
References
1. Herrmann, K. M. & Weaver, L. M. The Shikimate pathway. Annu. Rev. Plant Physiol. Plant Mol. Biol. 50, 473–503 (1999).
2. Harborne, J. B. & Williams, C. A. Advances in flavonoid research since 1992. Phytochemistry 55, 481–504 (2000).
3. Koes, R. E., Quattrocchio, F. & Mol, J. N. M. M. The flavonoid biosynthetic pathway in plants: function and evolution. BioEssays
16, 123–132 (1994).
4. Shirley, B. W. Flavonoid biosynthesis: ‘new’ functions for an ‘old’ pathway. Trends Plant Sci. 1, 377–382 (1996).
5. Hatier, J.-H. B. & Gould, K. S. Anthocyanin function in vegetative organs. in Anthocyanins 1–19 (Springer, New York, 2008). https
://doi.org/10.1007/978-0-387-77335-3_1
6. Gould, K. S. & Lister, C. Flavonoid function in plants. Flavonoids Chem. Biochem. Appl. 397–441 (2006).
7. Lila, M. A. Anthocyanins and human health: an in vitro investigative approach. J. Biomed. Biotechnol. 2004, 306–313 (2004).
8. Iorizzo, M. et al. Genetic structure and domestication of carrot (Daucus carota subsp. sativus) (Apiaceae). Am. J. Bot. 100, 930–938
(2013).
9. Simon, P. W. Domestication, historical development, and modern breeding of carrot. in Plant Breeding Reviews 157–190 (Wiley,
New York, 2010). https://doi.org/10.1002/9780470650172.ch5
10. Arscott, S. A. & Tanumihardjo, S. A. Carrots of many colors provide basic nutrition and bioavailable phytochemicals acting as a
functional food. Compr. Rev. Food Sci. Food Saf. 9, 223–239 (2010).
11. Simon, P. W., Pollak, L. M., Clevidence, B. A., Holden, J. M. & Haytowitz, D. B. Plant breeding for human nutritional quality. in
Plant Breeding Reviews, vol. 31, 325–392 (Wiley, New York, 2009).
12. Montilla, E. C., Arzaba, M. R., Hillebrand, S. & Winterhalter, P. Anthocyanin composition of black carrot (Daucus carota ssp.
sativus var. atrorubens Alef.) Cultivars antonina, beta sweet, deep purple, and purple haze. J. Agric. Food Chem. 59, 3385–3390
(2011).
13. Kammerer, D., Carle, R. & Schieber, A. Quantification of anthocyanins in black carrot extracts (Daucus carota ssp. sativus var.
atrorubens Alef) and evaluation of their color properties. Eur. Food Res. Technol. 219, 479–486 (2004).
14. Kammerer, D., Carle, R. & Schieber, A. Detection of peonidin and pelargonidin glycosides in black carrots (Daucus carota ssp.
sativus var. atrorubens Alef.) by high-performance liquid chromatography/electrospray ionization mass spectrometry. Rapid Com-
mun. Mass Spectrom. 17, 2407–2412 (2003).
15. Mazza, G. & Miniati, E. (Enrico). Anthocyanins in Fruits, Vegetables, and Grains (CRC Press, New York, 1993).
16. Xu, Z. S., Feng, K., Que, F., Wang, F. & Xiong, A. S. A MYB transcription factor, DcMYB6, is involved in regulating anthocyanin
biosynthesis in purple carrot taproots. Sci. Rep. 7, 1–9 (2017).
17. Cavagnaro, P. F. et al. A gene-derived SNP-based high resolution linkage map of carrot including the location of QTL conditioning
root and leaf anthocyanin pigmentation. BMC Genom. 15, 1118 (2014).
18. Jaakola, L. et al. Expression of genes involved in anthocyanin biosynthesis in relation to anthocyanin, proanthocyanidin, and
flavonol levels during bilberry fruit development. Plant Physiol. 130, 729–739 (2002).
19. Koes, R., Verweij, W. & Quattrocchio, F. Flavonoids: a colorful model for the regulation and evolution of biochemical pathways.
Trends Plant Sci. 10, 236–242 (2005).
20. Winkel-Shirley, B. Flavonoid biosynthesis. A colorful model for genetics, biochemistry, cell biology, and biotechnology. Plant
Physiol. 126, 485–493 (2001).
21. Yildiz, M. et al. Expression and mapping of anthocyanin biosynthesis genes in carrot. Theor. Appl. Genet. 126, 1–14 (2013).
22. Xu, Z. S. et al. Transcript profiling of structural genes involved in cyanidin-based anthocyanin biosynthesis between purple and
non-purple carrot (Daucus carota L.) cultivars reveals distinct patterns. BMC Plant Biol. 14, 262. https://doi.org/10.1186/s1287
0-014-0262-y (2014).
23. Bannoud, F. et al. Dissecting the genetic control of root and leaf tissue-specific anthocyanin pigmentation in carrot (Daucus carota
L.). Theor. Appl. Genet. 132, 2485–2507 (2019).
24. Kodama, M. et al. Identification of transcription factor genes involved in anthocyanin biosynthesis in carrot (Daucus carota L.)
using RNA-Seq. BMC Genom. 19, 811 (2018).
25. Iorizzo, M. et al. A cluster of MYB transcription factors regulates anthocyanin biosynthesis in carrot (Daucus carota L.) root and
petiole. Front. Plant Sci. 9, 1927 (2018).
Scientific Reports | (2021) 11:4093 | https://doi.org/10.1038/s41598-021-83514-4 8
Vol:.(1234567890)www.nature.com/scientificreports/
26. Xu, Z.-S., Yang, Q.-Q., Feng, K. & Xiong, A.-S. Changing carrot color: insertions in DcMYB7 alter the regulation of anthocyanin
biosynthesis and modification. Plant Physiol. https://doi.org/10.1104/pp.19.00523 (2019).
27. Ariel, F., Romero-Barrios, N., Jégu, T., Benhamed, M. & Crespi, M. Battles and hijacks: noncoding transcription in plants. Trends
Plant Sci. 20, 362–371 (2015).
28. Forestan, C. et al. Stress-induced and epigenetic-mediated maize transcriptome regulation study by means of transcriptome rean-
notation and differential expression analysis. Sci. Rep. 6, 1–20 (2016).
29. Forestan, C. et al. Epigenetic signatures of stress adaptation and flowering regulation in response to extended drought and recovery
in Zea mays. Plant Cell Environ. 43, 55–75 (2020).
30. Mercer, T. R. & Mattick, J. S. Structure and function of long noncoding RNAs in epigenetic regulation. Nat. Struct. Mol. Biol. 20,
300–307 (2013).
31. Wu, H. J., Wang, Z. M., Wang, M. & Wang, X. J. Widespread long noncoding RNAs as endogenous target mimics for microRNAs
in plants. Plant Physiol. 161, 1875–1884 (2013).
32. Zhang, G. et al. Transcriptomic and functional analyses unveil the role of long non-coding RNAs in anthocyanin biosynthesis
during sea buckthorn fruit ripening. DNA Res. 25, 465–476 (2018).
33. Yang, T. et al. Systematic identification of long noncoding RNAs expressed during light-induced anthocyanin accumulation in
apple fruit. Plant J. 100, 572–590 (2019).
34. Rinn, J. L. & Chang, H. Y. Genome regulation by long noncoding RNAs. Annu. Rev. Biochem. 81, 145–166 (2012).
35. Bonasio, R. & Shiekhattar, R. Regulation of transcription by long noncoding RNAs. Annu. Rev. Genet. 48, 433–455 (2014).
36. Zhao, X. et al. Global identification of Arabidopsis lncRNAs reveals the regulation of MAF4 by a natural antisense RNA. Nat.
Commun. 9, 5056 (2018).
37. Kindgren, P., Ard, R., Ivanov, M. & Marquardt, S. Transcriptional read-through of the long non-coding RNA SVALKA governs
plant cold acclimation. Nat. Commun. 9, 4561. https://doi.org/10.1038/s41467-018-07010-6 (2018).
38. Heo, J. B. & Sung, S. Vernalization-mediated epigenetic silencing by a long intronic noncoding RNA. Science (80–). 331, 76–79
(2011).
39. Thieffry, A. et al. Characterization of Arabidopsis thaliana promoter bidirectionality and antisense RNAs by depletion of nuclear
RNA decay pathways. Plant Cell. https://doi.org/10.1105/tpc.19.00815 (2020).
40. Liu, X. et al. A novel antisense long noncoding RNA, TWISTED LEAF, maintains leaf blade flattening by regulating its associated
sense R2R3-MYB gene in rice. New Phytol. 218, 774–788 (2018).
41. Ewing, B., Hillier, L. D., Wendl, M. C. & Green, P. Base-calling of automated sequencer traces using phred I. Accuracy assessment.
Genome Res. 8, 175–185 (1998).
42. Iorizzo, M. et al. A high-quality carrot genome assembly provides new insights into carotenoid accumulation and asterid genome
evolution. Nat. Genet. 48, 657–666 (2016).
43. Deng, P., Liu, S., Nie, X., Weining, S. & Wu, L. Conservation analysis of long non-coding RNAs in plants. Sci. China Life Sci. 61,
190–198 (2018).
44. Diederichs, S. The four dimensions of noncoding RNA conservation. Trends Genet. 30, 121–123 (2014).
45. Ramírez-Sánchez, O., Pérez-Rodríguez, P., Delaye, L. & Tiessen, A. Plant proteins are smaller because they are encoded by fewer
exons than animal proteins. Genom. Proteom. Bioinf. 14, 357–370 (2016).
46. Ayabe, S. I. & Akashi, T. Cytochrome P450s in flavonoid metabolism. Phytochem. Rev. 5, 271–282 (2006).
47. Kovinich, N. et al. Arabidopsis MATE45 antagonizes local abscisic acid signaling to mediate development and abiotic stress
responses. Plant Direct 2, e00087 (2018).
48. Francisco, R. M. et al. ABCC1, an ATP binding cassette protein from grape berry, transports anthocyanidin 3-O-glucosides. Plant
Cell Online https://doi.org/10.1105/tpc.112.102152 (2013).
49. Xu, Z., Yang, Q., Feng, K., Yu, X. & Xiong, A. DcMYB113, a root-specific R2R3-MYB, conditions anthocyanin biosynthesis and
modification in carrot. Plant Biotechnol. J. https://doi.org/10.1111/pbi.13325 (2020).
50. Mol, J., Grotewold, E. & Koes, R. How genes paint flowers and seeds. Trends Plant Sci. 3, 212–217 (1998).
51. Winkel-Shirley, B. Biosynthesis of flavonoids and effects of stress. Curr. Opin. Plant Biol. 5, 218–223 (2002).
52. Henig, R. M. The Monk in the Garden: The Lost and Found Genius of Gregor Mendel, the Father of Genetics (Houghton Mifflin
Harcourt, Boston, 2017).
53. Hartl, D. L. & Orel, V. What did Gregor Mendel think he discovered?. Genetics 131, 245 (1992).
54. Petrussa, E. et al. Plant flavonoids—biosynthesis, transport and involvement in stress responses. Int. J. Mol. Sci. 14, 14950–14973
(2013).
55. Simon, P. W. Inheritance and expression of purple and yellow storage root color in carrot. J. Hered. 87, 63–66 (1996).
56. Kobayashi, S., Ishimaru, M., Ding, C. K., Yakushiji, H. & Goto, N. Comparison of UDP-glucose:flavonoid 3-O-glucosyltransferase
(UFGT) gene sequences between white grapes (Vitis vinifera) and their sports with red skin. Plant Sci. 160, 543–550 (2001).
57. Kobayashi, S., Ishimaru, M., Hiraoka, K. & Honda, C. Myb-related genes of the Kyoho grape (Vitis labruscana) regulate anthocyanin
biosynthesis. Planta 215, 924–933 (2002).
58. Kobayashi, S., Goto-Yamamoto, N. & Hirochika, H. Retrotransposon-induced mutations in grape skin color. Science (80–.). 304,
982 (2004).
59. Pelechano, V. & Steinmetz, L. M. Gene regulation by antisense transcription. Nat. Rev. Genet. 14, 880–893 (2013).
60. Wight, M. & Werner, A. The functions of natural antisense transcripts. Essays Biochem. 54, 91–101 (2013).
61. Faghihi, M. A. & Wahlestedt, C. Regulatory roles of natural antisense transcripts. Nat. Rev. Mol. Cell Biol. 10, 637–643 (2009).
62. Swiezewski, S., Liu, F., Magusin, A. & Dean, C. Cold-induced silencing by long antisense transcripts of an Arabidopsis Polycomb
target. Nature 462, 799–802 (2009).
63. Rienth, M. et al. Day and night heat stress trigger different transcriptomic responses in green and ripening grapevine (Vitis vinifera)
fruit. BMC Plant Biol. 14, 108 (2014).
64. Andrews, S. FastQC: a quality control tool for high throughput sequence data. https://www.bioinformatics.babraham.ac.uk/proje
cts/fastqc/ (2010). Accessed 28 December 2020.
65. Bolger, A. M., Lohse, M. & Usadel, B. Trimmomatic: a flexible trimmer for Illumina sequence data. Bioinformatics 30, 2114–2120
(2014).
66. Kopylova, E., Noé, L. & Touzet, H. SortMeRNA: fast and accurate filtering of ribosomal RNAs in metatranscriptomic data. Bioin-
formatics 28, 3211–3217 (2012).
67. Dobin, A. et al. STAR: ultrafast universal RNA-seq aligner. Bioinformatics 29, 15–21 (2013).
68. Pertea, M. et al. StringTie enables improved reconstruction of a transcriptome from RNA-seq reads. Nat. Biotechnol. 33, 290–295
(2015).
69. Pertea, G., Pertea, M. GFF utilities: GffRead and GffCompare. F1000Res. 9, 304. https://doi.org/10.12688/f1000research.23297.1
(2020).
70. Kang, Y.-J. et al. CPC2: a fast and accurate coding potential calculator based on sequence intrinsic features. Nucleic Acids Res. 45,
W12–W16 (2017).
71. Nawrocki, E. P. & Eddy, S. R. Infernal 1.1: 100-fold faster RNA homology searches. Bioinformatics 29, 2933–2935 (2013).
72. Haas, B. J. et al. De novo transcript sequence reconstruction from RNA-seq using the Trinity platform for reference generation
and analysis. Nat. Protoc. 8, 1494–1512 (2013).
Scientific Reports | (2021) 11:4093 | https://doi.org/10.1038/s41598-021-83514-4 9
Vol.:(0123456789)www.nature.com/scientificreports/
73. Buchfink, B., Xie, C. & Huson, D. H. Fast and sensitive protein alignment using DIAMOND. Nat. Methods 12, 59–60 (2015).
74. Liao, Y., Smyth, G. K. & Shi, W. featureCounts: an efficient general purpose program for assigning sequence reads to genomic
features. Bioinformatics 30, 923–930 (2014).
75. Liao, Y., Smyth, G. K. & Shi, W. The R package Rsubread is easier, faster, cheaper and better for alignment and quantification of
RNA sequencing reads. Nucleic Acids Res. 47, e47–e47 (2019).
76. Anders, S. & Huber, W. Differential expression analysis for sequence count data. Genome Biol. 11, R106 (2010).
77. Love, M. I., Huber, W. & Anders, S. Moderated estimation of fold change and dispersion for RNA-seq data with DESeq2. Genome
Biol. 15, 550 (2014).
78. Thorvaldsdóttir, H., Robinson, J. T. & Mesirov, J. P. Integrative Genomics Viewer (IGV): high-performance genomics data visu-
alization and exploration. Brief. Bioinform. 14, 178–192 (2012).
79. Oliveros, J. C. Venny. An interactive tool for comparing lists with Venn′s diagrams. https: //bioinf ogp.cnb.csic.es/tools/ venny/ index
.html (2007-2015).
80. Ahmed, M. & Kim, D. R. pcr: an R package for quality assessment, analysis and testing of qPCR data. PeerJ 2018, e4473 (2018).
81. Ye, J. et al. Primer-BLAST: a tool to design target-specific primers for polymerase chain reaction. BMC Bioinf. 13, 134 (2012).
Acknowledgements
This work was supported by Agencia Nacional de Promoción Científica y Tecnológica (ANPCyT): PICT2015-
0822 & PICT-2016-3134; LabEx Sciences des Plantes de Saclay (SPS). Travel suport to Diego Lijavetzky was
funded by Programa de Movilidad para Docentes de la UNCuyo, INRA and Universite Paris Sud. We thank to
Dr. Pablo Cavagnaro for providing and growing the plant materials.
Author contributions
C.C. performed the samples collection, laboratory work for library preparation, participated in the draft of the
manuscript and figures preparation; T.B. designed the bioinformatic pipeline related to raw data processing, new
transcripts identification and differential expression analysis. M.C. provided the main insight on the design of
the transcriptomic experiment. D.L. wrote the final manuscript, designed and coordinated the experiments. All
authors carefully read and helped to improve the final content of the manuscript.
Competing interests
The authors declare no competing interests.
Additional information
Supplementary Information The online version contains supplementary material available at https://doi.
org/10.1038/s41598-021-83514-4.
Correspondence and requests for materials should be addressed to M.C. or D.L.
Reprints and permissions information is available at www.nature.com/reprints.
Publisher’s note Springer Nature remains neutral with regard to jurisdictional claims in published maps and
institutional affiliations.
Open Access This article is licensed under a Creative Commons Attribution 4.0 International
License, which permits use, sharing, adaptation, distribution and reproduction in any medium or
format, as long as you give appropriate credit to the original author(s) and the source, provide a link to the
Creative Commons licence, and indicate if changes were made. The images or other third party material in this
article are included in the article’s Creative Commons licence, unless indicated otherwise in a credit line to the
material. If material is not included in the article’s Creative Commons licence and your intended use is not
permitted by statutory regulation or exceeds the permitted use, you will need to obtain permission directly from
the copyright holder. To view a copy of this licence, visit http://creativecommons.org/licenses/by/4.0/.
© The Author(s) 2021
Scientific Reports | (2021) 11:4093 | https://doi.org/10.1038/s41598-021-83514-4 10
Vol:.(1234567890)You can also read