Alterations in protein expression and site specific N glycosylation of prostate cancer tissues
←
→
Page content transcription
If your browser does not render page correctly, please read the page content below
www.nature.com/scientificreports
OPEN Alterations in protein expression
and site‑specific N‑glycosylation
of prostate cancer tissues
Simon Sugár1,2, Gábor Tóth1,3, Fanni Bugyi1,4, Károly Vékey1, Katalin Karászi5,
László Drahos1 & Lilla Turiák1,2*
Identifying molecular alterations occurring during cancer progression is essential for a deeper
understanding of the underlying biological processes. Here we have analyzed cancerous and
healthy prostate biopsies using nanoLC-MS(MS) to detect proteins with altered expression and
N-glycosylation. We have identified 75 proteins with significantly changing expression during
disease progression. The biological processes involved were assigned based on protein–protein
interaction networks. These include cellular component organization, metabolic and localization
processes. Multiple glycoproteins were identified with aberrant glycosylation in prostate cancer,
where differences in glycosite-specific sialylation, fucosylation, and galactosylation were the most
substantial. Many of the glycoproteins with altered N-glycosylation were extracellular matrix
constituents, and are heavily involved in the establishment of the tumor microenvironment.
Prostate cancer (PCa) is the most prevalent type of cancer and the second leading cause of cancer-related deaths
among males. The probability of developing PCa increases with age, the lifetime risk is 1 in 9 1. PCa screening
is based on the Prostate-Specific Antigen (PSA) test, which measures the level of PSA in blood. In the case of
elevated PSA levels, further diagnosis and prognosis are determined by the histological examination of pros-
tate tissue b iopsies2. PSA screening, however, has relatively low specificity for PCa, which can often result in
overdiagnosis and o vertreatment3. Histology also has various limitations such as the subjective manner of the
classification of the tissue s ample4 and the inherent sampling error due to tumor h eterogeneity5. There have been
significant efforts to improve existing methods for PCa diagnosis. This includes the discovery of novel biomarkers
to replace the PSA blood t est6,7, the use of image-guided targeted b iopsies8,9, digital pathology using Artificial
Intelligence along with Machine Learning , and precision oncology using Liquid Biopsies12. Tissue samples
10,11
are often used in biomarker research as the starting point since they have the advantage to identify molecular
alterations occurring at the site of origin of the disease.
Tumor grading is the means of classification of tissue samples based on cellular appearances. Lower grades
resemble normal tissue more, while higher grades deviate to a greater extent due to lack of differentiation. For
PCa, the Gleason grading system is most frequently used, which does not focus on cytological, but rather archi-
tectural patterns and considers both the least and second least differentiated patterns observed13–15. Pathological
Grades (G) range from 1–3 while Gleason Grades (GG) range from 1 to 5. Both can be grouped into low (G1
and GG1), intermediate (G2 and GG2-3) and high-risk groups (G3 and GG4-5).
Molecular characteristics of PCa are characterized by high complexity and h eterogeneity16. In recent years,
17–19
many promising protein biomarkers have been r eported , but none of them has been implemented into clini-
cal practice to complement or replace PSA screening, although several are currently in clinical development20,21.
Besides changes in protein abundances of specific proteins, changes in the glycosylation of PCa glycoproteins
have also been reported to be of potential diagnostic and prognostic value22–24.
Mass spectrometry (MS) based proteomics methodologies are reliable and widely used tools for the analysis
of prostate tissues and cell l ines25–28. The MS-based characterization of site-specific protein glycosylation however
1
MS Proteomics Research Group, Research Centre for Natural Sciences, Eötvös Loránd Research Network,
Magyar tudósok körútja 2, 1117 Budapest, Hungary. 2Semmelweis University, Ph.D. School of Pharmaceutical
Sciences, Üllői út 26, 1085 Budapest, Hungary. 3Faculty of Chemical Technology and Biotechnology, Budapest
University of Technology and Economics, Műegyetem rakpart 3, 1111 Budapest, Hungary. 4Eötvös Loránd
University, Hevesy György Ph.D. School of Chemistry, Pázmány Péter sétány 1/A, 1117 Budapest, Hungary. 51St
Department of Pathology and Experimental Cancer Research, Semmelweis University, Üllői út 26, 1085 Budapest,
Hungary. *email: turiak.lilla@ttk.hu
Scientific Reports | (2021) 11:15886 | https://doi.org/10.1038/s41598-021-95417-5 1
Vol.:(0123456789)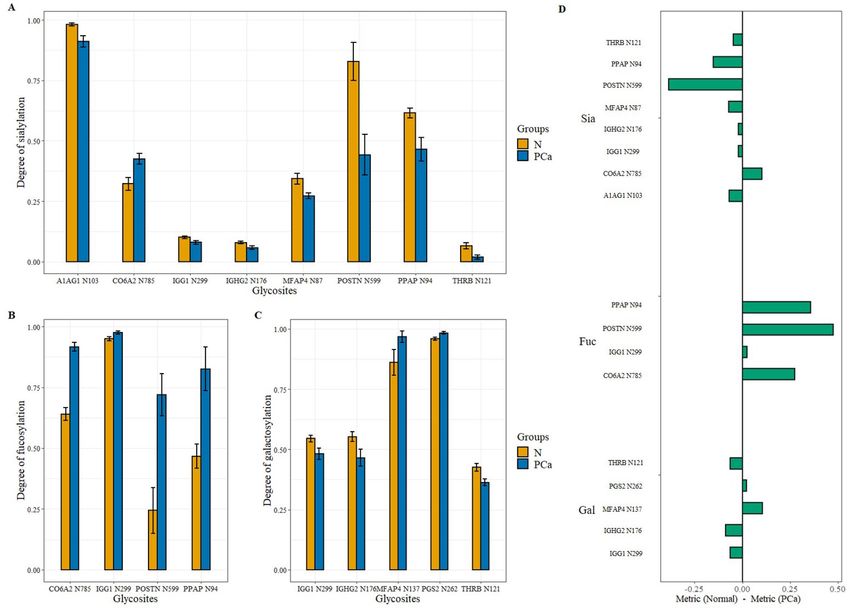
www.nature.com/scientificreports/
Figure 1. Workflow of the analysis of the TMA samples.
remains a challenging task both from an analytical and data analysis s tandpoint29. This is partly the reason that
iomarkers22.
protein glycosylation is still a largely untapped source of cancer b
We have recently performed a comparative pilot proteomics study on PCa tissue microarrays (TMAs) to dis-
criminate between healthy and cancerous tissues30. In the present study, our objective was to identify molecular
changes in PCa, analyzing a large number (95) of TMA core biopsy samples. This allows us to detect relatively
small differences in protein abundances with a high statistical power. We have compared protein expression
levels and changes in N-glycosylation features among various pathological grades of PCa and healthy tissues.
Results
Protein expression levels and site-specific N-glycosylation of 95 tissue microarray (TMA) biopsy samples were
analyzed, among which there were 9 G1, 16 G2, 24 G3, and 46 normal tissues. Digital images of a stained sample
from each group are shown as examples in Supplementary Figs. S1–S4. In the case of cancerous samples both the
original and an annotated image indicating cancerous and non-cancerous tissue areas are shown. The sample
preparation consisted of on-surface tryptic d igestion31 followed by C
18 SPE cleanup and acetone precipitation
for glycopeptide enrichment. After precipitation, the glycopeptide-enriched pellet fraction and the supernatant
fraction containing non-glycosylated peptides were analyzed s eparately32. The workflow is summarized in Fig. 1,
detailed information on each step is discussed in the “Methods” section.
The “Results” section is divided into three major parts: (i) the molecular differences between healthy and
cancerous prostate tissue; (ii) the molecular changes with PCa grade progression, and differences between dis-
tinct grades and healthy tissue; (iii) and the biological processes altered in PCa. While the first two sections are
based on data from both the proteomics (containing protein intensities) and glycoproteomics datasets (contain-
ing glycopeptide intensities and metrics calculated from them), the third one is based on proteomics data only.
Before describing the results of the three aforementioned sections, a general characterization of the two datasets
(proteomics and glycoproteomics) is provided.
MaxQuant quantified 653 proteins altogether in the 95 supernatant samples analyzed. From these, proteins
that were found in less than 60% of any of the sample groups were excluded. Missing values were then imputed
as described in the “Methods” section.
Scientific Reports | (2021) 11:15886 | https://doi.org/10.1038/s41598-021-95417-5 2
Vol:.(1234567890)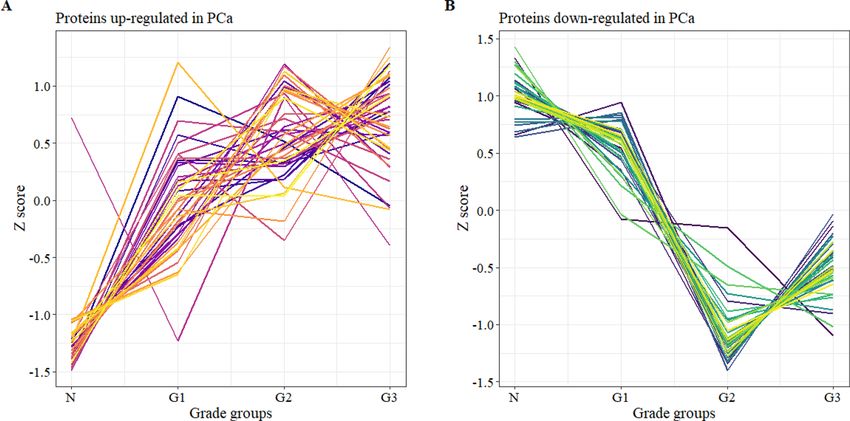
www.nature.com/scientificreports/
Figure 2. Volcano plot displaying proteins differentially expressed (fold-change at least 2) between healthy and
PCa tissues. Red dots represent proteins overexpressed, while blue dots represent proteins underexpressed in
PCa.
N-linked glycopeptides were quantified by G lycoPattern33 software using glycan and glycosite libraries con-
structed following Byonic searches32. Results were then filtered as detailed in the “Methods” section. Altogether
145 glycopeptides were quantified in 95 samples with high confidence, corresponding to 22 glycoproteins with
29 glycosites and 53 different glycans.
Protein glycosylation can be characterized by listing all the identified glycopeptides, but usually, multiple
metrics are used i nstead22,34. Here we use sialylation, fucosylation, galactosylation, branching, and glycan type
ratio. These simplify data interpretation and carry important biological information as well, as they are connected
to various steps of N-glycan biosynthesis. The different metrics used in this paper are explained and summarized
in Supplementary Table S1.
Over 75% of the identified glycopeptides carried complex-type glycans. More than half of these structures
were biantennary, while tri- and tetra-antennary types and unmatured structures were also present. The average
antenna sialylation was 20.1% across all samples, while 28.7% of antenna containing structures held at least one
sialic acid. The average fucosylation was 37.8% across all samples. All 29 glycosites identified carried several
different glycans, and also showed considerable diversity regarding glycan type, branching, galactosylation,
fucosylation, and sialylation. To reveal changes specific to the distinct glycosites, metrics were calculated for
them individually as well.
Differences between healthy and cancerous tissues. To investigate differences between healthy
(normal) and cancerous (PCa) tissues, Student’s t-test was performed on proteomics and glycoproteomics data
separately using 0.05 false discovery rate (FDR). Between the normal and PCa groups, 123 proteins were found
to be differentially expressed, this included 72 proteins overexpressed and 51 proteins underexpressed in PCa
(Supplementary Table S2). Among these, 14 showed a fold-change over 2, while 27 displayed a fold-change
under 0.5 (Fig. 2).
In the glycoproteomics dataset, 7 glycopeptides were found with significantly different abundances between
the normal and PCa groups (Supplementary Fig. S5), each carrying biantennary, fucosylated complex-type
glycans with different levels of galactosylation and sialylation. In five cases, glycopeptide expression was lower
in PCa tissues: four glycoforms of Immunoglobulin gamma-1 heavy chain (IGG1) N299, and one glycoform of
Prothrombin (THRB) N121. The other two showed higher expression levels in PCa: one glycoform of Microfibril-
associated glycoprotein 4 (MFAP4) N137 and one glycoform of Biglycan (PGS1) N270.
Significant differences were also detected between normal and PCa tissues when comparing the levels of sia-
lylation, fucosylation, and galactosylation at distinct glycosites. The differences in glycosite-specific sialylation,
fucosylation, and galactosylation are summarized in Fig. 3.
All but one of the eight differentially sialylated glycosites were underexpressed in PCa (Fig. 3A). The differ-
ences in sialylation were below 10% for most glycosites, except for Periostin (POSTN) N599 and Prostatic acid
phosphatase (PPAP) N94 with a 38.6% and 15.1% decrease respectively, and CO6A2 N785 with a 10.3% increase
in sialylation. Although only a 4.6% difference, THRB N121 showed the greatest relative change with a degree
of sialylation almost 3.5 times lower in PCa than in normal tissues. Opposed to this, all four differentially fuco-
sylated glycosites were overexpressed in PCa with the biggest differences on N785 of collagen alpha-2(VI) chain
(CO6A2), POSTN N599, and PPAP N94 with a 27.7%, 47.6%, and 35.9% increase in fucosylation, respectively
(Fig. 3B). The significant differences in galactosylation levels found on five glycosites (Fig. 3C) were much smaller
than changes in fucosylation or sialylation, the two major ones being the increase of galactosylation at MFAP4
Scientific Reports | (2021) 11:15886 | https://doi.org/10.1038/s41598-021-95417-5 3
Vol.:(0123456789)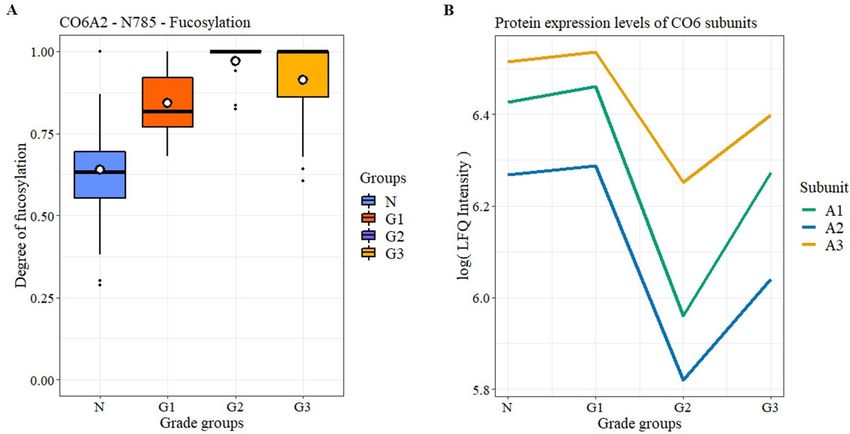
www.nature.com/scientificreports/
Figure 3. Glycosite-specific alterations in sialylation (A), fucosylation (B), and galactosylation (C) between
healthy and PCa tissues (with standard error displayed). (D) summarizes the direction and volume of the
differences in the case of all three metrics (Normal—PCa).
N137 by 10.6% and the decrease of galactosylation of Immunoglobulin heavy constant gamma 2 (IGHG2) N176
by 8.7% in case of cancerous samples. Interestingly, while changes in fucosylation always increased in the case
of PCa samples (Fig. 3D), in the case of sialylation and galactosylation they did not.
Differences among various grades of PCa and Normal tissue. To uncover molecular alterations
among pathological grades and normal tissue, Analysis of Variance (ANOVA) was performed (FDR controlled
at 0.05) on both proteomics and glycoproteomics data separately. For exact parameters see the “Methods” sec-
tion.
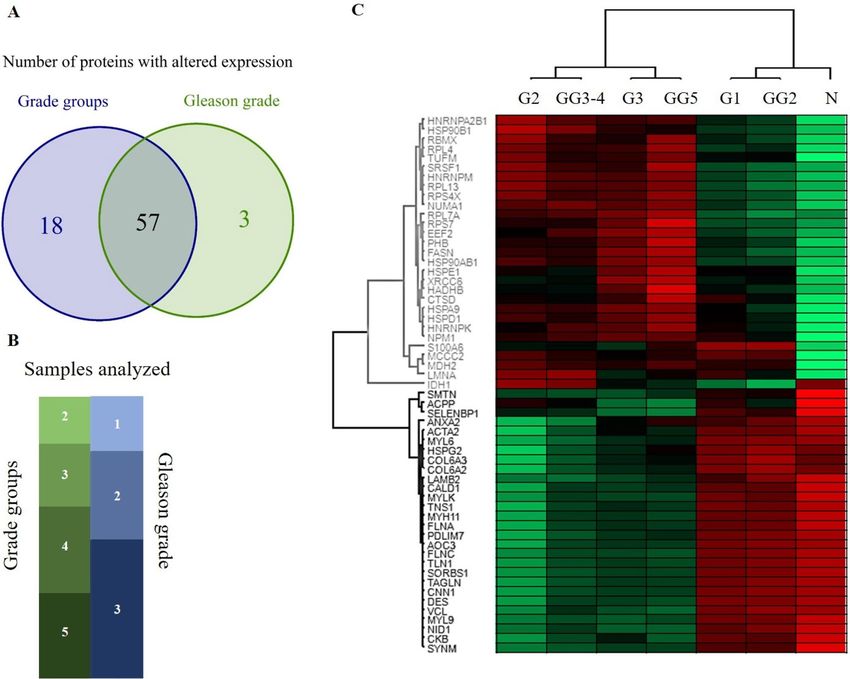
In the proteomics dataset, 75 proteins were identified with significant changes (Supplementary Table S3)
among the various PCa grades and healthy tissue. Hierarchical clustering in Perseus with Spearman’s correlation
revealed two distinct groups among these proteins: in 40 cases the proteins were upregulated (Fig. 4A), while in
35 cases they were downregulated (Fig. 4B) in cancer.
Afterward, a post-hoc test was performed on the 75 ANOVA significant proteins (Tukey’s Honest Significant
Difference test). This revealed that most of the proteins were differentially expressed between the normal and the
two high-grade groups (G2 & G3), while there were only 3 such proteins between G2 and G3, 8 proteins between
G1 and G3 and 14 between normal and G1 groups. The list of these proteins is included in Supplementary
Table S3 broken down into six groups corresponding to all group-wise comparison combinations. Furthermore,
many of them (more than 85%) showed differential expression in not only one but multiple group comparisons
(Supplementary Fig. S6).
In the glycoproteomics dataset, ANOVA and the following post-hoc test (Tukey’s HSD) revealed 4 glyco-
peptides with significantly different abundances among different grades and healthy tissue. Three of them cor-
respond to the same glycosite N299 of IGG1 and carry biantennary complex-type glycans. In all three cases,
the significant differences were between the Normal—Grade 2 and Normal—Grade 3 groups, and the observed
trends were similar (average correlation coefficient of 0.980). The overall amount of IGG1 glycopeptides did not
change significantly with PCa progression. The fourth glycopeptide corresponds to glycosite N137 of MFAP4
and also carries a biantennary complex-type glycan. In this case, the significant difference is between the Nor-
mal—Grade 1 groups (Fig. 5).
Scientific Reports | (2021) 11:15886 | https://doi.org/10.1038/s41598-021-95417-5 4
Vol:.(1234567890)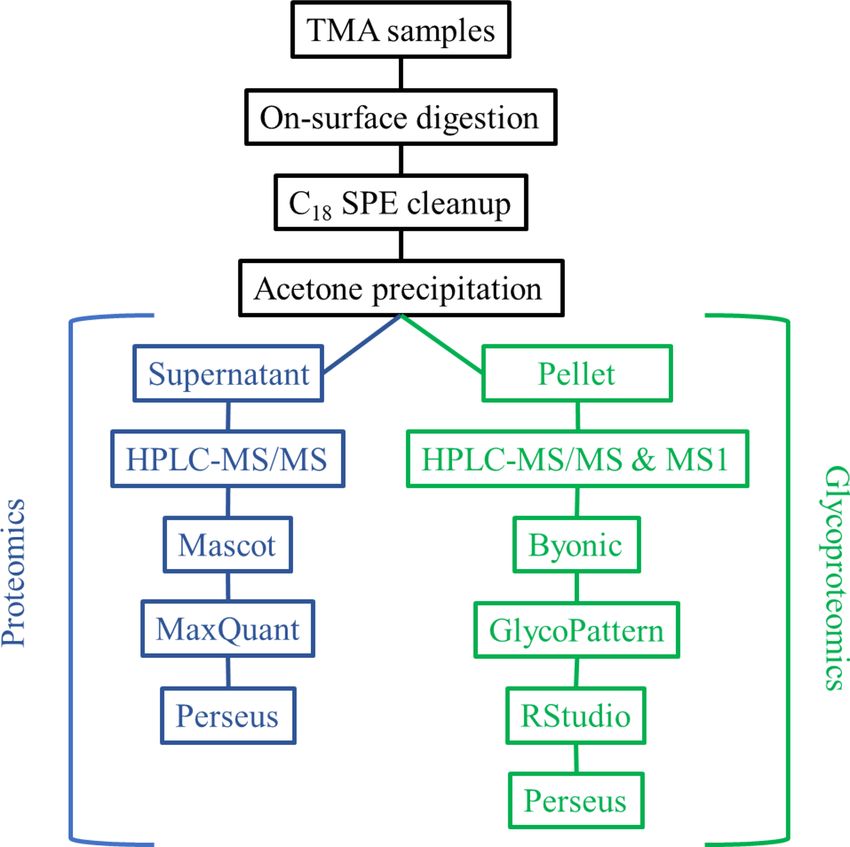
www.nature.com/scientificreports/

                                  Figure 4.  Significantly changing proteins among different grades of PCa and healthy tissue divided into two
                                  sub-groups based on hierarchical clustering: upregulated (A) and downregulated (B).

                                  Figure 5.  Glycopeptides with significant changes between different Grades of PCa and healthy tissues.
                                  Glycopeptides are annotated as follows: glycoprotein—glycosite—attached glycan (H hexose, N N-acetyl
                                  hexosamine, F fucose, S sialic acid units).

                                      Furthermore, regarding glycosites, ANOVA identified that the degree of fucosylation on CO6A2 N785 was
                                  different between the three Grade groups and Normal tissue. Interestingly, fucosylation shows a monotonic
                                  increase until G2 then decreases in G3 (Fig. 6A). This tendency is opposite to the changes in protein expression
                                  levels of the 3 identified CO6 subunits A1, A2, and A3 (Fig. 6B) apart from both being nearly constant between
                                  the Normal and G1 groups.
                                      In addition to pathological grades, alterations between Gleason grades and healthy tissue were investigated
                                  as well. The number of samples analyzed in the different GG groups was as follows: 7 in GG2, 12 in GG3, 15 in
                                  GG4, and 15 in GG5. The data analysis was carried out similarly to that of pathological grades.
                                      The results of the analysis based on GG groups showed great similarity to those based on pathological grades.
                                  In the glycoproteomics dataset, the same glycosylated features were identified with significant changes, regard-
                                  ing both glycopeptides and glycosites. In the proteomics dataset, 60 proteins were identified as differentially
                                  expressed, opposed to 75 in the analysis based on pathological grades, with 57 common ones between the two.
                                  The overlap between these two sets of proteins and the group classifications of the 49 PCa samples are sum-
                                  marized in Fig. 7A,B, respectively. The correlation was also calculated for the 57 common proteins for the two
                                  datasets. Gleason grades were grouped based on the amount of overlap with pathological grades (Fig. 7B) in the
                                  following manner: GG2; GG3 and GG4; and GG5. The correlation coefficients between the GG2 – G1; GG3 and

Scientific Reports |   (2021) 11:15886 |              https://doi.org/10.1038/s41598-021-95417-5                                                 5

                                                                                                                                            Vol.:(0123456789)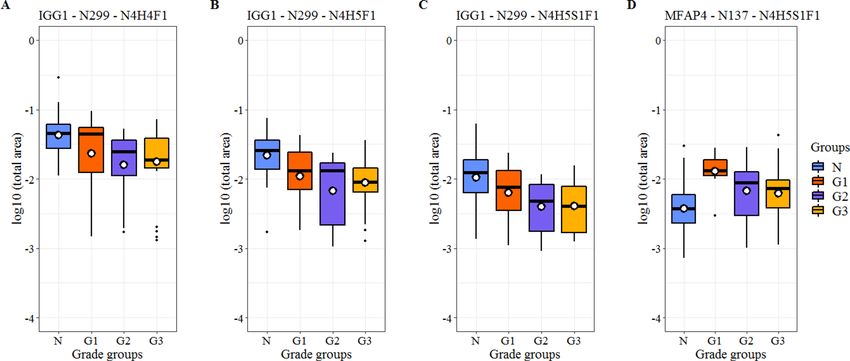
www.nature.com/scientificreports/
Figure 6. Changes in the fucosylation of CO6A2 (A) and in the protein expression of different CO6 subunits
(B) between different Grades of PCa and healthy tissues.
GG4 – G2; GG5 – G3 grades were 0.997, 0.970, and 0.990, respectively. The high correlation of these groups is
visualized in Fig. 7C in the form of a heatmap, containing the 57 common proteins and the compared groups
(clustering is based on Pearson correlation, protein intensities are depicted as Z-scores).
Identification of altered biological processes based on proteomics. Following the identification
of proteins with statistically significant changes, functional enrichment analysis was performed in STRING for
GO and KEGG terms, separately for the proteins up- and downregulated in PCa (for the STRING networks see
Supplementary Figs. S7 and S8). The most important terms from the resulting Protein–Protein Interaction (PPI)
Networks were identified based on the Number of Genes, Strength, and FDR values, and are summarized in
Table 1. The complete lists are presented in Supplementary Tables S4–S7.
Most of the underexpressed proteins were associated with cellular component organization (34 out of 51),
while the overexpressed proteins were predominantly affiliated with metabolic processes (60 out of 72).
Discussion
As the focus of this paper is on finding potential biomarkers through exploring alterations in the glycosylation
between healthy and PCa tissues combined with proteomics data, only glycoproteins displaying significant
changes are discussed individually. For these, the differences in protein expression and glycosylation are both
reported, and they are compared to relevant previous studies on PCa or cancer in general. Furthermore, the most
significant biological processes are also discussed.
The PPI network analysis provides information about biological processes, which are altered in PCa. The
underexpressed proteins were mostly associated with cellular component organization (34 out of 51 proteins) and
various processes connected to adhesion e.g.: the KEGG term “Focal adhesion” and the GO term “cell adhesion”,
and muscle contraction e.g.: the KEGG term “Vascular smooth muscle contraction” and the GO term “muscle
contraction”. Focal adhesion has been confirmed to be heavily involved in cancer progression35, while smooth
muscle cells have been reported to be involved in PCa and B PH36. The overexpressed proteins, on the other hand,
were primarily associated with metabolic processes (60 out of 72 proteins) with the GO terms “localization” and
“regulation of gene expression” involving the most proteins. While altered localization of macromolecules in a
cell (e.g. proteins37) can reportedly drive tumor development and metastasis, aberrant gene expression is known
to be the principal cause of c ancer38.
All glycoproteins with significant glycosylation changes were quantified in the proteomics part of the study
by MaxQuant, but not all of them showed differential expression between Normal and PCa tissues. This suggests
that altered glycosylation does not necessarily indicate glycoprotein-wise differential expression. Furthermore,
neither of the metrics used for the characterization of glycosylation (listed in Supplementary Table S1) showed
significant overall changes between PCa and healthy tissues. Regarding cellular localization, all the glycoproteins
with significant glycosylation changes were primarily of extracellular origin, most of them were associated with
the Extracellular Matrix (ECM) and consequently, the Tumor Microenvironment (TME), which is known to
heavily influence cancer initiation, progression, and i nvasion39.
There are several changes in glycosylation that are known to widely occur in cancer. These include increased
and altered sialylation, increased branched-glycan structures, and f ucosylation40,41. Also, there have been many
PCa glycome-specific changes reported before42, e.g.: the expression of oligomannosidic glycans in the tumor
region in late-stage P Ca43. These changes however reflect only overall tendencies, they are not necessarily true
for all of the glycosylation sites, as our results clearly demonstrate.
Scientific Reports | (2021) 11:15886 | https://doi.org/10.1038/s41598-021-95417-5 6
Vol:.(1234567890)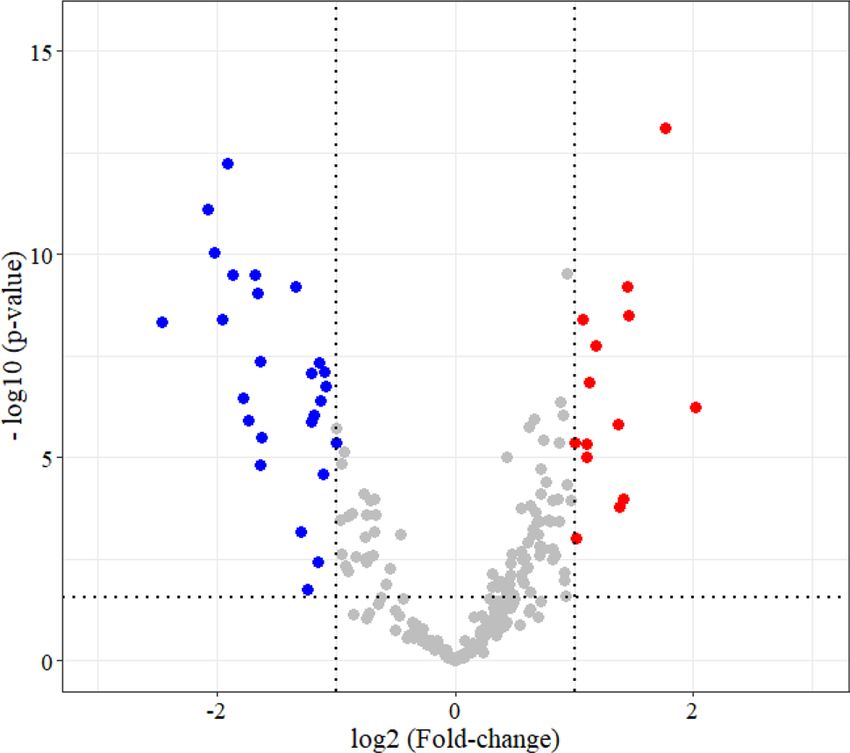
www.nature.com/scientificreports/
Figure 7. Comparison of the proteomics results based on Grade groups and Gleason grades. (A) Venn diagram
of proteins identified as significant. (B) Classification of the 49 PCa samples analyzed. The size of the boxes is
proportional to the sample sizes (green—Gleason grades, blue—Grade groups). (C) Heatmap of the 57 common
proteins in both proteomics datasets. Grade groups (G1, G2, G3) and groups created from Gleason grades
(GG2; GG3 and GG4; GG5).
In previous studies, serum sialylation has been linked to pathological grade and elevated sialic acid levels to
bone metastasis44. In tissues, however, overall sialylation levels have been reported to be constant across differ-
ent grades of c ancer22. Our results suggest the same, the average sialylation levels were very similar throughout
the different sample groups, but there were significant differences detected on several glycosylation sites. Most
of them showed a decrease in sialylation except for CO6A2 N785, which showed an overall increase and signifi-
cant differences between the different pathological grade groups. Also, proteomics results revealed that CO6A1,
CO6A2, and CO6A3 expression levels significantly changed with PCa progression in a similar manner. This
is highlighted by the fact, that CO6A1 has been reported to have an important role in tumor growth, and the
molecular etiology of Castration-Resistant Prostate Cancer45.
Apart from serum, PCa cell lines have also been used before to identify diagnostic markers, and site-specific
changes in fucosylation have been reported in PC3 and LNCap cell lines46. This aligns with our findings, as we
have also found that fucosylation increased in PCa on multiple glycosites. Also, PPAP has been demonstrated to
have a significant effect on PCa cell growth47, and it has been hypothesized to have higher site-specific fucosyla-
tion levels in PCa p atients46. This is supported by our data: the average fucosylation level of PPAP N94 increased
from 47 to 83% in PCa.
POSTN has been reported to be upregulated in aggressive PCa48, but significant changes in glycosylation
have not been reported yet. Our proteomics results reaffirmed, that POSTN is overexpressed in PCa, and we also
detected significant changes in both fucosylation and sialylation on POSTN N599, an increase from 24 to 72%
and a decrease from 83 to 44% respectively, highlighting its’ possible importance.
Prostate tissue is known to be a rich reservoir of P rothrombin49, the precursor of Thrombin, which has been
reported to promote prostate tumor growth, increase tumor cell seeding, and stimulate angiogenesis50,51. We
Scientific Reports | (2021) 11:15886 | https://doi.org/10.1038/s41598-021-95417-5 7
Vol.:(0123456789)www.nature.com/scientificreports/
Database Description Number of genes Strength FDR
Protein–protein interaction networks for the 51 proteins underexpressed in PCa
KEGG Focal adhesion 12 1.39 6.62E−12
KEGG ECM-receptor interaction 6 1.47 2.49E−06
KEGG Vascular smooth muscle contraction 6 1.3 1.44E−05
GO BP Muscle contraction 13 1.33 6.53E−11
GO BP Actin filament-based process 14 1.05 7.47E−09
GO BP Cell junction assembly 9 1.43 2.94E−08
GO BP Cellular component organization 34 0.42 1.30E−07
GO BP Actin cytoskeleton organization 12 1.06 1.30E−07
GO BP Extracellular matrix organization 10 1.13 6.01E−07
GO BP Cytoskeleton organization 14 0.77 7.79E−06
GO BP Supramolecular fiber organization 9 0.97 4.79E−05
GO BP Platelet degranulation 6 1.27 8.66E−05
GO BP Cell adhesion 12 0.75 8.66E−05
GO BP Regulated exocytosis 11 0.8 8.66E−05
Protein–protein interaction networks for the 72 proteins overexpressed in PCa
KEGG Ribosome 8 1.22 4.25E−06
KEGG Spliceosome 8 1.22 4.25E−06
GO BP mRNA metabolic process 23 0.97 4.28E−13
GO BP RNA splicing, via transesterification reactions 15 1.15 2.64E−10
GO BP Protein localization to endoplasmic reticulum 9 1.3 1.76E−07
GO BP Metabolic process 60 0.23 1.92E−07
GO BP SRP-dependent cotranslational protein targeting to membrane 8 1.37 3.02E−07
GO BP Translational initiation 9 1.24 3.57E−07
GO BP Protein localization 25 0.54 8.45E−07
GO BP Negative regulation of gene expression 23 0.57 8.87E−07
GO BP Regulation of gene expression 38 0.36 2.04E−06
GO BP Cellular response to cytokine stimulus 17 0.69 2.08E−06
GO BP Localization 41 0.33 2.51E−06
GO BP Translation 11 0.92 3.63E−06
Table 1. The most important terms in the PPI Networks from the STRING analysis.
have found that the sialylation of THRB N121 was downregulated significantly in PCa, moreover, with the larg-
est relative difference.
Alterations of serum IgG glycosylation has been reported in many diseases, including PCa52, and IgG1 has
been suggested as a potential target for PCa treatment53. We found that both IGG1 N299 and IGHG2 N176 show
decreased overall galactosylation by 6.3% and 8.7% respectively. This is in line with previous studies, where
one of the major differences reported was the decrease of terminal galactosylation in PCa compared to either
healthy or benign prostatic disease p atients54. Our data also shows reduced sialylation on both IGG1 N299 and
IGHG2 N176 by 2.1% (corresponding to a relative change of 21.3% and 26.8% respectively), which is also in
agreement with literature as reduced sialylation has been described as a major alteration in PCa compared to
healthy individuals55.
Another glycoprotein with significant site-specific glycosylation changes was MFAP4, which has been reported
to be involved in several cancers and may function as a tumor suppressor in PCa56. MFAP4 has been documented
to have altered glycosylation in pancreatic a denocarcinoma57, however, not in PCa. Our results revealed that both
sites of MFAP4 showed modified glycosylation in PCa: decreased sialylation on N87 and increased expression
of the glycan N4H5S1F1 on N137. The latter glycoform might be a useful indicator in detecting PCa at an early
stage, as this increased expression was detected between normal and G1 samples.
Most of the glycoproteins discussed above can be found in the Human Protein Atlas58 (apart from IGG1 and
IGHG2) and are categorized in the Pathology Atlas based on Prognostic summary and Cancer specificity. Apart
from PPAP, which is a protein specific to PCa, all of them are unfavorable prognostic markers in certain types of
cancer (in most cases renal cancer) which suggests that these glycoproteins are heavily involved in cancer progres-
sion. This information is summarized in Supplementary Table S8 supplemented by their Secretome annotation.
It is also important to note, that these glycoproteins have been detected in biofluids previously. All glyco-
proteins discussed above with the exception of POSTN have been detected in u rine59, while POSTN has been
detected in serum samples60 of PCa patients. This suggests their potential usefulness as a clinical marker. Whether
the alterations in the glycosylation of these proteins is PCa specific or not, needs further investigation, especially
in the context of their biomarker status.
Scientific Reports | (2021) 11:15886 | https://doi.org/10.1038/s41598-021-95417-5 8
Vol:.(1234567890)www.nature.com/scientificreports/
In conclusion, our results indicate that alterations between PCa and Normal tissue glycosylation occur pri-
marily on the glycosite level, while overall glycosylation may be unaffected. Furthermore, altered glycosylation
does not necessarily indicate differential expression on the protein level. The glycoproteins with significant dif-
ferences in glycosylation were all secreted either to blood or the ECM, and most of them are characterized as
an unfavorable prognostic cancer marker by the Pathology Atlas. As altered protein glycosylation in cancer has
been proven to be nonrandom, this suggests that further investigation of the glycosylation, and cancer specific-
ity of these potential prognostic markers and identification of their exact roles is reasonable and could lead to
further advancement in understanding the function of glycosylation in cancer development and PCa prognosis.
Methods
Materials. All chemicals used were HPLC–MS grade. Acetonitrile, Water, Acetone, Formic acid, and Ammo-
nium-bicarbonate were purchased from Merck (Darmstadt, Germany). Trifluoroacetic acid, Dithiothreitol, and
Iodoacetamide were obtained from Thermo Scientific (Waltham, MA, USA). Methanol was purchased from
VWR International (Debrecen, Hungary), RapiGest surfactant was obtained from Waters (Milford, MA, USA).
Detailed information on TMAs. Four different TMA slides were purchased from US Biomax (Derwood,
MD, USA): BNS19011, PR481, PR483c, PR633. All of them contained formalin-fixed paraffin-embedded (FFPE)
cores with a diameter of 1.5 mm and a thickness of 5 μm. The specification sheets are available at https://biomax.
us with information about each core including age, pathological Grade, Stage, and Gleason Score. Each TMA
core contains on average approximately 1 µg protein.
On‑surface digestion. First, the TMA slides were baked at 60 °C for 2 h following the supplier’s instruc-
tions to prevent tissue detachment. Next, de-paraffinization was carried out by incubating the slides in different
solvents/solutions sequentially as follows: xylene for 2 × 3 min, ethanol for 2 × 5 min, 90% ethanol—10% water
for 3 min, 70% ethanol 30%—Water for 3 min, 10 mM N H4HCO3 (water) for 5 min and finally water for 1 min.
After dewaxing, the slides were placed in antigen retrieval buffer (20 mM Tris–HCl, pH = 9.0) for 30 min at
90 °C.
Following the preparation steps, the proteins in TMA cores were reduced using RapiGest and DTT in 1 µL
of 20% glycerol for 20 min at 55 °C, then alkylated using IAA in 1 µL of 25 mM ammonium bicarbonate (ABC)
puffer and 20% glycerol for 20 min at room temperature in the dark. The digestion was done in a cyclic manner,
each one lasting for 40 min at 37 °C in a humidified box, 5 cycles in total. In the first two cycles, LysC-Trypsin
mixture was added in a 1:25 ratio, in 1 µL 50 mM ABC and 20% glycerol. Subsequently, in the last three cycles,
Trypsin was added in a 1:10 ratio, in 1 µL 50 mM ABC and 20% glycerol. After the digestion steps, the extrac-
tion of the protein digest was done by repeatedly pipetting 1 µL 10% acetic acid extraction solvent five times on
the cores. Peptide extracts were then dried down, and clean-up was performed using C18 spin columns (Thermo
Scientific) using the manufacturer’s protocol. The resulting samples were dried down and stored at -20 °C for
further usage.
Acetone precipitation. Samples were reconstituted in 15 µL 1% FA and 150 µL ice-cold acetone was added
and the solution was stored at -20 °C overnight. Then the samples were centrifuged at 13,000 g for 10 min, then
the supernatants were removed, dried down, and stored at -20 °C. The pellet fractions were also dried down,
then resuspended in 10 µL of injection solvent and subsequently stored in the autosampler unit until analysis.
nanoUHPLC‑MS(MS) analysis. Samples were analyzed using a Maxis II QTOF instrument (Bruker Dal-
tonik GmbH, Bremen, Germany) equipped with CaptiveSpray nanoBooster ion source coupled to a Dionex Ulti-
Mate 3000 RSLCnano system (Sunnyvale, CA, USA). Peptides were separated on an Acquity M-Class BEH130
C18 analytical column (1.7 μm, 75 μm × 250 mm Waters, Milford, MA) using gradient elution (isocratic hold at
4% for 11 min, then elevating B solvent content to 25% in 75 min, and to 40% in 15 min) following trapping
on an Acclaim PepMap100 C 18 (5 μm, 100 μm × 20 mm, Thermo Fisher Scientific, Waltham, MA) trap column.
Solvent A consisted of water + 0.1% formic acid, Solvent B was acetonitrile + 0.1% formic acid, and the sample
loading buffer was 0.1% TFA and 0.01% heptafluorobutiric acid in water.
For proteomics, DDA measurements were used. The cycle time was set at 2.5 s, with a dynamic MS/MS exclu-
sion of the same precursor ion for 2 min, or if its intensity is at least 3 times larger than previously. Preferred
charge states were set between + 2 and + 5. MS spectra were acquired at 3 Hz in the 150–2200 m/z range, while
MS/MS spectra at 4 or 16 Hz depending on the intensity of the precursor. For glycoproteomics MS/MS measure-
ments, the experimental settings were similar, except for collision energies. Mixed energy spectra were collected
at 100% collision energy for 80% of the cycle time and 50% collision energy for 20% of the cycle time. For single-
stage MS measurements, spectra were recorded over the mass range of 300–3000 m/z at 1 Hz. Following each run,
raw data were recalibrated using the Compass DataAnalysis software 4.3 (Bruker Daltonics, Bremen, Germany).
Data analysis. Software used: MASCOT (https://www.matrixscience.com/), MaxQuant 1.6.17 (https://
maxquant.org), Perseus 1.6.5.0 (https://maxquant.org/perseus/), R 3.6.1 (https://www.r-project.org/), RStudio
1.2.5001 (https://rstudio.com/), Byonic 3.8 (https://proteinmetrics.org), GlycoPattern 4.7_b30. Exact parameters
used for all the software are summarized in Supplementary Table S9.
Proteomics. Protein quantitation was performed by MaxQuant61 on a focused Homo Sapiens database
made from combining MASCOT62 search results from all MS/MS analyses. The MaxQuant output was then
Scientific Reports | (2021) 11:15886 | https://doi.org/10.1038/s41598-021-95417-5 9
Vol.:(0123456789)www.nature.com/scientificreports/
loaded into Perseus, where proteins found in less than 60% of each sample group were removed. Subsequently,
missing values were imputed from a normal distribution with the default settings for the whole matrix (down
shift of 1.8 and width of 0.3). Statistical analysis was then performed, using Two-sample tests (Student’s t-test),
Multiple-sample tests (ANOVA), and post-hoc tests (Tukey’s HSD). The exact settings for the statistical tests are
summarized in Supplementary Table S10. Data visualizations were done in RStudio using the ggplot2 library63.
Glycoproteomics. In the glycoproteomics analysis, glycosites were identified from the LC–MS/MS analysis
of pooled pellet samples using Byonic64 with a |LogProb| value of at least 2. The same LC–MS/MS experiments
were used to identify the composition of various glycans at these glycosylation sites. GlycoPattern33 was then
used to quantify the glycopeptides based on single-stage nanoLC-MS corresponding to the linear combinations
of the glycosites and glycans previously identified. The software identified the glycopeptides according to their
exact mass, retention time (RT), and isotope cluster distribution, then performed label-free quantitation.
65 in RStudio66. The data were first submit-
Pre-processing and statistical analysis were then carried out using R
ted to outlier filtering, where identifications with a RT outside of the Q1 (first quartile)—1.5 IQR (inter-quartile
range) to Q
3 (third quartile) + 1.5 IQR range were thrown out. Then, through sequential filtering steps, any data
points with an AUC less than 1000, glycopeptides identified in less than 5 samples, and samples with less than
10 glycopeptides identified were removed. Subsequently, the data were normalized using Quotient Total Area
Normalization followed by log t ransformation67. The degree of fucosylation (ratio of fucosylated versus non-
fucosylated glycopeptides) and sialylation (the ratio of antennae that contain sialic acid versus antennae that
does not) were then calculated for every glycosite. Statistical analysis was carried out in Perseus similarly to the
proteomics dataset (exact settings are summarized in Supplementary Table S10), data visualizations were done
in RStudio using the ggplot2 l ibrary63.
STRING. Functional Enrichment of proteins was performed in STRING68 for Gene Ontology (GO) Terms
and Kyoto Encyclopedia of Genes and Genomes (KEGG) Pathways. The minimum required interaction score
was set to the highest confidence (0.900), for active interaction sources “Textmining” was excluded.
Data availability
Experimental data has been submitted to the MassIVE data repository with the ID: MSV000087329.
Received: 5 May 2021; Accepted: 23 July 2021
References
1. Siegel, R. L., Miller, K. D. & Jemal, A. Cancer statistics, 2016. CA Cncer J. Clin. 66, 7–30 (2016).
2. Mottet, N. et al. EAU-ESTRO-SIOG guidelines on prostate cancer. Part 1: Screening, diagnosis, and local treatment with curative
intent. Eur. Urol. 71, 618–629 (2017).
3. Sandhu, G. S. & Andriole, G. L. Overdiagnosis of prostate cancer. J. Natl. Cancer Inst. Monogr. 2012, 146–151 (2012).
4. Bulten, W. et al. Artificial intelligence assistance significantly improves Gleason grading of prostate biopsies by pathologists. Mod.
Pathol. 34, 660–671 (2020).
5. Corcoran, N. M. et al. Underestimation of Gleason score at prostate biopsy reflects sampling error in lower volume tumours. BJU
Int. 109, 660–664 (2012).
6. Viste, E. et al. Effects of replacing PSA with Stockholm3 for diagnosis of clinically significant prostate cancer in a healthcare
system–the Stavanger experience. Scand. J. Prim. Health Care 38, 315–322 (2020).
7. Wu, J. T. & Liu, G. H. Advantages of replacing the total PSA assay with the assay for PSA-α1-antichymotrypsin complex for the
screening and management of prostate cancer. J. Clin. Lab. Anal. 12, 32–40 (1998).
8. Brown, A. M. et al. Recent advances in image-guided targeted prostate biopsy. Abdom. Imaging 40, 1788–1799 (2015).
9. Ahdoot, M. et al. MRI-targeted, systematic, and combined biopsy for prostate cancer diagnosis. N. Engl. J. Med. 382, 917–928
(2020).
10. Ström, P. et al. Artificial intelligence for diagnosis and grading of prostate cancer in biopsies: A population-based, diagnostic study.
The Lancet Oncol. 21, 222–232 (2020).
11. Bulten, W. et al. Automated deep-learning system for Gleason grading of prostate cancer using biopsies: A diagnostic study. The
Lancet Oncol. 21, 233–241 (2020).
12. Heitzer, E., Haque, I. S., Roberts, C. E. & Speicher, M. R. Current and future perspectives of liquid biopsies in genomics-driven
oncology. Nat. Rev. Genet. 20, 71–88 (2019).
13. Erickson, A. et al. New prostate cancer grade grouping system predicts survival after radical prostatectomy. Hum. Pathol. 75,
159–166 (2018).
14. Epstein, J. I. Prostate cancer grading: A decade after the 2005 modified system. Mod. Pathol. 31, 47–63 (2018).
15. Srigley, J. R. et al. Controversial issues in Gleason and International Society of Urological Pathology (ISUP) prostate cancer grad-
ing: proposed recommendations for international implementation. Pathology 51, 463–473 (2019).
16. Abeshouse, A. et al. The molecular taxonomy of primary prostate cancer. Cell 163, 1011–1025 (2015).
17. Neuhaus, J. Special issue “Diagnostic biomarkers in prostate cancer”. Diagnostics 11, 505 (2021).
18. Shukla, S. et al. Oxidative stress and antioxidant status in high-risk prostate cancer subjects. Diagnostics 10, 126 (2020).
19. Saxby, H., Mikropoulos, C. & Boussios, S. An update on the prognostic and predictive serum biomarkers in metastatic prostate
cancer. Diagnostics 10, 549 (2020).
20. Jakobsen, N. A., Hamdy, F. C. & Bryant, R. J. Novel biomarkers for the detection of prostate cancer. J. Clin. Urol. 9, 3–10 (2016).
21. Filella, X., Fernández-Galan, E., Bonifacio, R. F. & Foj, L. Emerging biomarkers in the diagnosis of prostate cancer. Pharmacogenom.
Pers. Med. 11, 83 (2018).
22. Scott, E. & Munkley, J. Glycans as biomarkers in prostate cancer. Int. J. Mol. Sci. 20, 1389 (2019).
23. Matsumoto, T. et al. Serum N-glycan profiling is a potential biomarker for castration-resistant prostate cancer. Sci. Rep. 9, 1–8
(2019).
24. Tkac, J. et al. Prostate-specific antigen glycoprofiling as diagnostic and prognostic biomarker of prostate cancer. Interface Focus 9,
20180077 (2019).
25. Schwamborn, K. et al. Identifying prostate carcinoma by MALDI-Imaging. Int. J. Mol. Med. 20, 155–159 (2007).
Scientific Reports | (2021) 11:15886 | https://doi.org/10.1038/s41598-021-95417-5 10
Vol:.(1234567890)www.nature.com/scientificreports/
26. Srinivas, P. R., Srivastava, S., Hanash, S. & Wright, G. L. Jr. Proteomics in early detection of cancer. Clin. Chem. 47, 1901–1911
(2001).
27. Schiess, R., Wollscheid, B. & Aebersold, R. Targeted proteomic strategy for clinical biomarker discovery. Mol. Oncol. 3, 33–44
(2009).
28. Sardana, G., Jung, K., Stephan, C. & Diamandis, E. P. Proteomic analysis of conditioned media from the PC3, LNCaP, and 22Rv1
prostate cancer cell lines: discovery and validation of candidate prostate cancer biomarkers. J. Proteome Res. 7, 3329–3338 (2008).
29. Cao, W. et al. Recent advances in software tools for more generic and precise intact glycopeptide analysis. Mol. Cell. Proteom. 20,
100060 (2021).
30. Turiák, L. et al. High sensitivity proteomics of prostate cancer tissue microarrays to discriminate between healthy and cancerous
tissue. J. Proteom. 197, 82–91 (2019).
31. Turiák, L. et al. Workflow for combined proteomics and glycomics profiling from histological tissues. Anal. Chem. 86, 9670–9678
(2014).
32. Turiák, L. et al. Site-specific N-glycosylation of HeLa cell glycoproteins. Sci. Rep. 9, 1–11 (2019).
33. Ozohanics, O., Turiák, L., Puerta, A., Vékey, K. & Drahos, L. High-performance liquid chromatography coupled to mass spec-
trometry methodology for analyzing site-specific N-glycosylation patterns. J. Chromatogr. A 1259, 200–212 (2012).
34. Christiansen, M. N. et al. Cell surface protein glycosylation in cancer. Proteomics 14, 525–546 (2014).
35. Figel, S. & Gelman, I. Focal adhesion kinase controls prostate cancer progression via intrinsic kinase and scaffolding functions.
Anti-Cancer Agents Med. Chem. 11, 607–616 (2011).
36. Wang, Y. et al. Smooth muscle contraction and growth of stromal cells in the human prostate are both inhibited by the Src family
kinase inhibitors, AZM475271 and PP2. Br. J. Pharmacol. 173, 3342–3358 (2016).
37. Wang, X. & Li, S. Protein mislocalization: Mechanisms, functions and clinical applications in cancer. Biochim. Biophys. Acta Rev.
Cancer 1846, 13–25 (2014).
38. Liang, P. & Pardee, A. B. Analysing differential gene expression in cancer. Nat. Rev. Cancer 3, 869–876 (2003).
39. Wang, M. et al. Role of tumor microenvironment in tumorigenesis. J. Cancer 8, 761 (2017).
40. Varki, A. et al. Essentials of Glycobiology [internet]. Chapter 9. (2015).
41. Pinho, S. S. & Reis, C. A. Glycosylation in cancer: mechanisms and clinical implications. Nat. Rev. Cancer 15, 540–555 (2015).
42. Kawahara, R. et al. The complexity and dynamics of the tissue glycoproteome associated with prostate cancer progression. Mol.
Cell. Proteom. 20, 100026 (2021).
43. Drake, R. R. et al. MALDI mass spectrometry imaging of N-linked glycans in cancer tissues. Adv. Cancer Res. 134, 85–116 (2017).
44. Zhang, C. et al. Elevated serum sialic acid levels predict prostate cancer as well as bone metastases. J. Cancer 10, 449 (2019).
45. Zhu, Y.-P. et al. Reactive stroma component COL6A1 is upregulated in castration-resistant prostate cancer and promotes tumor
growth. Oncotarget 6, 14488 (2015).
46. Shah, P. et al. Integrated proteomic and glycoproteomic analyses of prostate cancer cells reveal glycoprotein alteration in protein
abundance and glycosylation. Mol. Cell. Proteom. 14, 2753–2763 (2015).
47. Muniyan, S. et al. Human prostatic acid phosphatase: Structure, function and regulation. Int. J. Mol. Sci. 14, 10438–10464 (2013).
48. Tian, Y., Bova, G. S. & Zhang, H. Quantitative glycoproteomic analysis of optimal cutting temperature-embedded frozen tissues
identifying glycoproteins associated with aggressive prostate cancer. Anal. Chem. 83, 7013–7019 (2011).
49. Kohli, M. et al. Thrombin expression in prostate: A novel finding. Cancer Inv. 29, 62–67 (2011).
50. Adams, G. et al. Thrombin and factor XII drive prostate tumor growth in vivo. Blood 126, 424 (2015).
51. Nierodzik, M. L. & Karpatkin, S. Thrombin induces tumor growth, metastasis, and angiogenesis: Evidence for a thrombin-regulated
dormant tumor phenotype. Cancer Cell 10, 355–362 (2006).
52. Gudelj, I., Lauc, G. & Pezer, M. Immunoglobulin G glycosylation in aging and diseases. Cell. Immunol. 333, 65–79 (2018).
53. Xu, Y. et al. IgG silencing induces apoptosis and suppresses proliferation, migration and invasion in LNCaP prostate cancer cells.
Cell. Mol. Biol. Lett. 21, 1–10 (2016).
54. Kazuno, S. et al. Glycosylation status of serum immunoglobulin G in patients with prostate diseases. Cancer Med. 5, 1137–1146
(2016).
55. Papakonstantinou, M. et al. N-Glycosylation of IgG Immunoglobulin and its clinical significance. J. Biomed. 4, 35–43. https://doi.
org/10.7150/jbm.33922 (2019).
56. Yang, J. et al. Integrated analysis of microfibrillar-associated proteins reveals MFAP4 as a novel biomarker in human cancers.
Epigenomics 11, 5–21 (2019).
57. Guerrero, P. E. et al. Microfibril associated protein 4 (MFAP4) is a carrier of the tumor associated carbohydrate sialyl-Lewis x
(sLex) in pancreatic adenocarcinoma. J. Proteom. 231, 104004 (2021).
58. Uhlen, M. et al. A pathology atlas of the human cancer transcriptome. Science 357, eaan2507 (2017).
59. Dong, M. et al. Urinary glycoproteins associated with aggressive prostate cancer. Theranostics 10, 11892 (2020).
60. Gabriele, C. et al. High-throughput detection of low abundance sialylated glycoproteins in human serum by TiO 2 enrichment
and targeted LC-MS/MS analysis: Application to a prostate cancer sample set. Anal. Bioanal. Chem. 411, 755–763 (2019).
61. Cox, J. & Mann, M. MaxQuant enables high peptide identification rates, individualized ppb-range mass accuracies and proteome-
wide protein quantification. Nat. Biotechnol. 26, 1367–1372 (2008).
62. Brosch, M., Yu, L., Hubbard, T. & Choudhary, J. Accurate and sensitive peptide identification with Mascot Percolator. J. Proteome
Res. 8, 3176–3181 (2009).
63. Hadley, W. Ggplot2: Elegrant Graphics for Data Analysis (Springer, 2016).
64. Bern, M., Kil, Y. J. & Becker, C. Byonic: Advanced peptide and protein identification software. Curr. Protoc. Bioinform. 40, 132011–
132014 (2012).
65. R. Team. R: A Language and Environment for Statistical Computing. (2013).
66. RStudio Team. RStudio: Integrated Development Environment for R. (PBC, 2020).
67. Benedetti, E. et al. Systematic evaluation of normalization methods for glycomics data based on performance of network inference.
Metabolites 10, 271 (2020).
68. Szklarczyk, D. et al. STRING v11: Protein–protein association networks with increased coverage, supporting functional discovery
in genome-wide experimental datasets. Nucleic Acids. Res. 47, D607–D613 (2019).
Acknowledgements
L.T. is grateful for funding by the National Research, Development and Innovation Office (OTKA PD 121187
and OTKA FK 131603) and acknowledges the support of the János Bolyai Research Scholarship of the Hungarian
Academy of Sciences. Project no. 2018-1.2.1-NKP-2018-00005 has been implemented with the support provided
from the National Research, Development and Innovation Fund of Hungary, financed under the 2018-1.2.1-
NKP funding scheme.
Scientific Reports | (2021) 11:15886 | https://doi.org/10.1038/s41598-021-95417-5 11
Vol.:(0123456789)www.nature.com/scientificreports/
Author contributions
L.T., F.B., G.T., S.S. carried out the experiments; L.T., G.T., S.S., participated in data analysis; L.T., G.T., K.V.,
L.D., S.S., wrote the manuscript; L.T., G.T., K.V., S.S., designed the experiments; K.K. annotated the tissue biopsy
digital images. All authors read and approved the final manuscript.
Competing interests
The authors declare no competing interests.
Additional information
Supplementary Information The online version contains supplementary material available at https://doi.org/
10.1038/s41598-021-95417-5.
Correspondence and requests for materials should be addressed to L.T.
Reprints and permissions information is available at www.nature.com/reprints.
Publisher’s note Springer Nature remains neutral with regard to jurisdictional claims in published maps and
institutional affiliations.
Open Access This article is licensed under a Creative Commons Attribution 4.0 International
License, which permits use, sharing, adaptation, distribution and reproduction in any medium or
format, as long as you give appropriate credit to the original author(s) and the source, provide a link to the
Creative Commons licence, and indicate if changes were made. The images or other third party material in this
article are included in the article’s Creative Commons licence, unless indicated otherwise in a credit line to the
material. If material is not included in the article’s Creative Commons licence and your intended use is not
permitted by statutory regulation or exceeds the permitted use, you will need to obtain permission directly from
the copyright holder. To view a copy of this licence, visit http://creativecommons.org/licenses/by/4.0/.
© The Author(s) 2021
Scientific Reports | (2021) 11:15886 | https://doi.org/10.1038/s41598-021-95417-5 12
Vol:.(1234567890)You can also read