Identification of the hub gene BUB1B in hepatocellular carcinoma via bioinformatic analysis and in vitro experiments - PeerJ
←
→
Page content transcription
If your browser does not render page correctly, please read the page content below
Identification of the hub gene BUB1B in
                                   hepatocellular carcinoma via bioinformatic
                                   analysis and in vitro experiments
                                   Jie Fu1 ,2 , Xiao Zhang1 ,2 , Likun Yan1 ,2 , Yaoli Shao1 ,2 , Xinxu Liu1 ,2 , Yuan Chu1 ,2 ,
                                   Ge Xu1 ,2 and Xundi Xu1 ,2
                               1
                                 Department of General Surgery, The Second Xiangya Hospital, Central South University, Changsha, Hunan,
                                 China
                               2
                                 Hunan Provincial Key Laboratory of Hepatobiliary Disease Research, The Second Xiangya Hospital, Central
                                 South University, Changsha, Hunan, China

                                       ABSTRACT
                                       Background. Hepatocellular carcinoma (HCC) is one of the most commonly diagnosed
                                       cancers and the fourth leading cause of cancer-related deaths in the world. Although
                                       the treatment of HCC has made great progress in recent years, the therapeutic effects
                                       on HCC are still unsatisfactory due to difficulty in early diagnosis, chemoresistance and
                                       high recurrence rate post-surgery.
                                       Methods. In this study, we identified differentially expressed genes (DEGs) based on
                                       four Gene Expression Omnibus (GEO) datasets (GSE45267, GSE98383, GSE101685 and
                                       GSE112790) between HCC and normal hepatic tissues. A protein–protein interaction
                                       (PPI) network was established to identify the central nodes associated with HCC. Gene
                                       Ontology (GO) and Kyoto Encyclopedia of Genes and Genomes (KEGG) analysis of
                                       the central nodes were conducted to find the hub genes. The expression levels of the
                                       hub genes were validated based on the ONCOMINE and Gene Expression Profiling
                                       Interactive Analysis (GEPIA) databases. Additionally, the genetic alterations of the hub
                                       genes were evaluated by cBioPortal. The role of the hub genes on the overall survival
                                       (OS) and relapse survival (RFS) of HCC patients was evaluated by Kaplan-Meier plotter.
                                       At last, the mechanistic role of the hub genes was illustrated by in vitro experiments.
                                       Results. We found the following seven hub genes: BUB1B, CCNB1, CCNB2, CDC20,
Submitted 22 October 2020              CDK1, MAD2L1 and RRM2 using integrated bioinformatics analysis. All of the hub
Accepted 24 January 2021               genes were significantly upregulated in HCC tissues. And the seven hub genes were
Published 23 February 2021
                                       associated with the OS and RFS of HCC patients. Finally, in vitro experiments indicated
Corresponding author                   that BUB1B played roles in HCC cell proliferation, migration, invasion, apoptosis and
Xundi Xu, xuxundi@csu.edu.cn
                                       cell cycle by partially affecting mitochondrial functions.
Academic editor                        Conclusions. In summary, we identified seven hub genes that were associated with
Minjun Chen
                                       the expression and prognosis of HCC. The mechanistic oncogenic role of BUB1B in
Additional Information and             HCC was first illustrated. BUB1B might play an important role in HCC and could be
Declarations can be found on
page 17                                potential therapeutic targets for HCC.
DOI 10.7717/peerj.10943

    Copyright                      Subjects Bioinformatics, Gastroenterology and Hepatology, Oncology
2021 Fu et al.                     Keywords Hepatocellular carcinoma, Bioinformatic analysis, Hub genes, BUB1B, In vitro

Distributed under
Creative Commons CC-BY 4.0

OPEN ACCESS

                                   How to cite this article Fu J, Zhang X, Yan L, Shao Y, Liu X, Chu Y, Xu G, Xu X. 2021. Identification of the hub gene BUB1B in hepato-
                                   cellular carcinoma via bioinformatic analysis and in vitro experiments. PeerJ 9:e10943 http://doi.org/10.7717/peerj.10943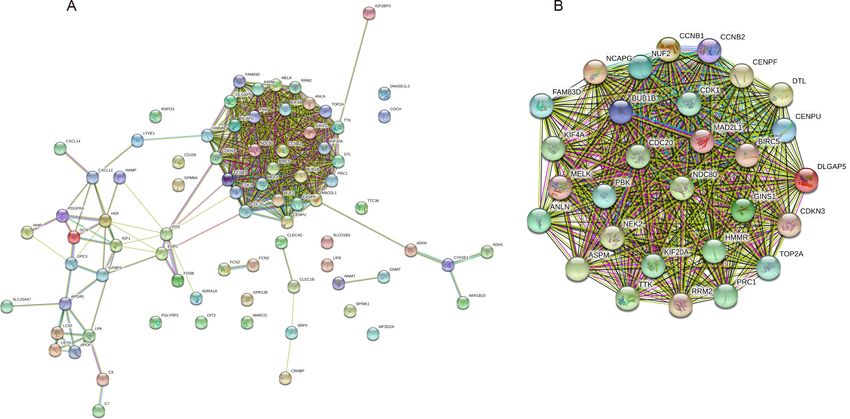
INTRODUCTION
                                    Hepatocellular carcinoma (HCC), is one of the most commonly diagnosed cancers and
                                    the fourth leading cause of cancer-related deaths worldwide (Siegel, Miller & Jemal, 2017).
                                    Although the diagnosis and treatment of HCC have made great progress in recent years, the
                                    therapeutic effects of HCC are still unsatisfactory (Lee et al., 2020; Qin et al., 2020; Raoul &
                                    Edeline, 2020; Xia et al., 2019). Therefore, further study of the mechanisms underlying HCC
                                    development and metastasis is urgently needed, which will contribute to the development
                                    of treatment options and prolong survival for HCC patients.
                                        Recently, microarrays coupled with bioinformatic analysis have been used to identify
                                    novel biomarkers related to carcinogenesis, tumor diagnosis, treatment and prognosis
                                    (Buisson et al., 2019; Emperle et al., 2019; Herrington et al., 2018). The major online
                                    databases include the Gene Expression Omnibus (GEO), European Genome-phenome
                                    Archive (EGA) and The Cancer Genome Atlas (TCGA) (Barrett et al., 2005; Cancer Genome
                                    Atlas Research et al., 2013; Lappalainen et al., 2015). In addition, online analysis websites
                                    such as ONCOMINE, cBioPortal, Kaplan Meier plotter and Gene Expression Profiling
                                    Interactive Analysis (GEPIA) have been used (Hou et al., 2017; Rhodes et al., 2007; Tang
                                    et al., 2019). It is useful for identifying the core genes related to HCC progression and
                                    prognosis by integrated bioinformatics analysis based on gene expression databases. At
                                    present, some core genes related to HCC have been found in some studies (Mi et al., 2020;
                                    Yang, Pan & You, 2019; Zhuang, Yang & Meng, 2018). However, the clinical sample size
                                    included in the analysis is not enough, and the mechanism of these genes in HCC has not
                                    been studied.
                                        In this study, four mRNA microarray datasets (GSE45267, GSE98383, GSE101685
                                    and GSE112790) were obtained from the GEO database (Diaz et al., 2018; Shimada et
                                    al., 2019; Wang et al., 2013). The online tool GEO2R was used to identify DEGs between
                                    HCC and normal hepatic tissues. Gene Ontology (GO) and Kyoto Encyclopedia of Genes
                                    and Genomes (KEGG) pathway enrichment analyses were conducted to further explore
                                    the functions of the DEGs (Huang da, Sherman & Lempicki, 2009). A protein-protein
                                    interaction (PPI) network was constructed to identify the hub genes associated with HCC
                                    via the Search Tool for the Retrieval of Interacting Genes (STRING) database (von Mering
                                    et al., 2003). Expression validation and survival analysis of the hub genes were conducted
                                    by Gene Expression Profiling Interactive Analysis (GEPIA), ONCOMINE, cBioPortal and
                                    Kaplan Meier plotter. Finally, the biological roles of the hub gene BUB1B in HCC were
                                    determined by in vitro experiments.

                                    MATERIALS & METHODS
                                    Microarray data
                                    Gene expression profile data of HCC patients were obtained from the GEO database. The
                                    GSE45267, GSE98383, GSE101685 and GSE112790 datasets included 46 HCC tissues and
                                    41 normal hepatic tissues, 11 HCC tissues and 27 normal hepatic tissues, 24 HCC tissues
                                    and eight normal hepatic tissues, and 183 HCC tissues and 15 normal hepatic tissues,
                                    respectively. All of the GEO datasets were based on the GPL570 platform.

Fu et al. (2021), PeerJ, DOI 10.7717/peerj.10943                                                                               2/22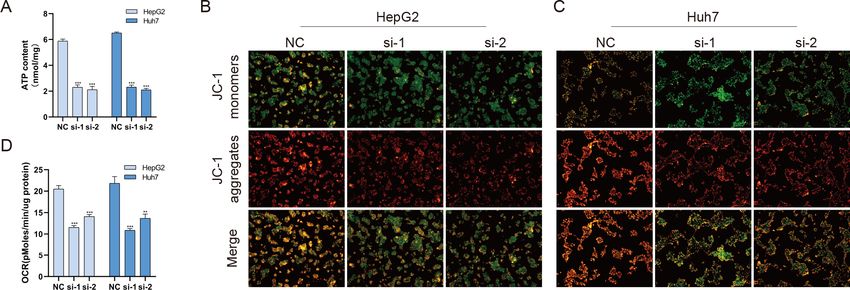
Identification of DEGs
                                    DEGs between HCC tissues and normal hepatic tissues were identified via GEO2R online
                                    tools. Genes with |log2FC| > 2 and adjusted P value < 0.05 were considered DEGs. The
                                    intersecting genes of the four GEO datasets were examined via a Venn diagram. DEGs
                                    with log2FC < 2 were considered downregulated genes, while DEGs with log2FC > 2 were
                                    considered upregulated genes.

                                    Gene ontology annotation and KEGG pathway enrichment analysis
                                    The functions of the DEGs were revealed by the online tool Database for Annotation,
                                    Visualization and Integrated Discovery (DAVID). Biological process (BP), cellular
                                    component (CC), molecular function (MF) and KEGG pathway analyses were conducted.
                                    Adj. P < 0.05 was considered statistically significant.

                                    PPI network construction and module analysis
                                    The PPI network of significantly differentially expressed genes was constructed by the
                                    STRING database. All PPI pairs with a combined score of > 0.4 were extracted. The degrees
                                    of all nodes were calculated by the MCODE plugin in Cytoscape software.

                                    Validation of the expression levels of hub genes
                                    To validate the mRNA expression levels of the identified hub genes between HCC and
                                    normal hepatic tissues, the ONCOMINE database and the online tool GEPIA were used.

                                    Genetic alterations and prognostic analysis of hub genes
                                    The liver hepatocellular carcinoma (TCGA, Firehose Legacy), liver hepatocellular
                                    carcinoma (TCGA, PanCancer Atlas) (TCGA, Firehose Legacy), hepatocellular carcinomas
                                    (INSERM, Nat Genet 2015) and liver hepatocellular carcinoma (AMC, Hepatology 2014)
                                    datasets were used for the analysis of the genetic alterations of the hub genes with the online
                                    tool cBioPortal. The genetic alterations were categorized as missense mutations, truncating
                                    mutations, amplifications, deep deletions and no alterations. Kaplan Meier plots were
                                    used to compare the overall survival (OS) and disease-free survival (DFS) of HCC patients
                                    with or without alterations in the mRNA expression levels of the 7 hub genes through the
                                    cBioPortal database.

                                    Survival analysis and correlation analysis
                                    The effects of the hub genes on overall survival (OS) and relapse-free survival (RFS) were
                                    determined by Kaplan Meier survival analysis. The log rank P value and hazard ratio (HR)
                                    with 95% confidence intervals are shown on the plot. Correlations between two hub genes
                                    were analyzed by the GEPIA online tool based on the TCGA database.

                                    Cell culture and transfection
                                    The human HCC cell lines HepG2 and Huh7 and the normal hepatic cell line
                                    LO2 were purchased from the Type Culture Collection of the Chinese Academy of
                                    Sciences (Shanghai, China). All cell lines were maintained in Dulbecco’s modified
                                    Eagle medium (Gibco, US) supplemented with 10% fetal bovine serum (Gibco,
                                    US), 100 U/ml penicillin and 100 µg/ml streptomycin (Gibco, US). Cells were

Fu et al. (2021), PeerJ, DOI 10.7717/peerj.10943                                                                              3/22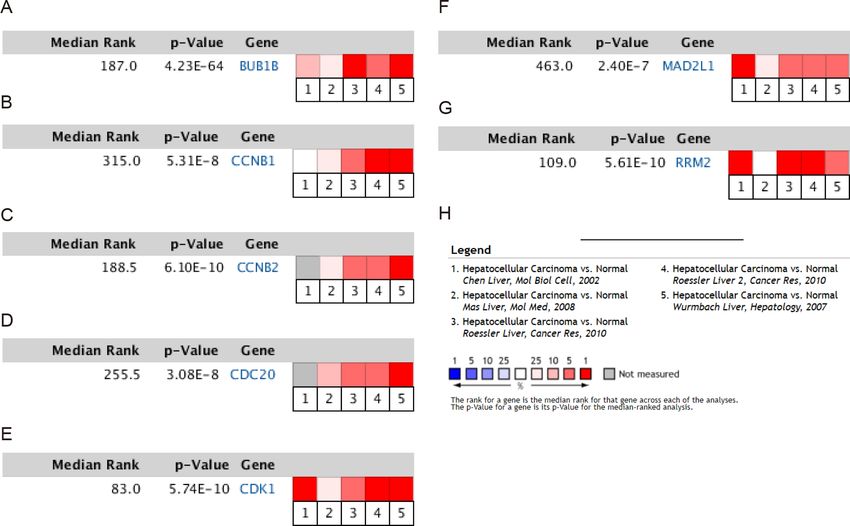
cultured at 37 ◦ C in 5% CO2. Overexpression plasmid and small interfering RNAs
                                    (siRNA) targeting BUB1B were purchased from ShenGong (Shanghai, China). SiRNA
                                    and plasmid were transfected into HCC cells with Lipofectamine 2000 Reagent
                                    (Invitrogen, US) according to the manufacturer’s instructions. The siRNA sequences
                                    of BUB1B were as follows: siRNA#1 (si 1): 50 -GAGAGUAAUAUGUCAACGUUATT-
                                    30 , siRNA#2 (si 2): 50 -GCGUUUAUGCAAUGAGCCUUUTT-30 , and siRNA#3 (si 3):
                                    50 -GAGACAACUAAACUGCAAAUUTT-30 .

                                    Colony formation assay
                                    Suspended HCC cells transfected with BUB1B-siRNA or normal control were seeded into
                                    six-well plates (1,500 cells/well) in two mL of complete medium. The cells were cultured
                                    for 2 weeks. The colonies were stained with 0.5% crystal violet for 20 min, and the colony
                                    numbers were counted.

                                    Cell counting Kit-8 (CCK-8) assay
                                    Cell proliferation and viability were assessed by CCK-8 assay (Dojindo, Japan) according
                                    to the manufacturer’s instructions. Briefly, HCC cells were seeded into 96-well plates at
                                    a density of 1,500 cells/well with 100 µl of culture medium. A total of 10 µl of CCK-8
                                    reagent was added to each well at the indicated time points (24, 48 and 72 h). The plates
                                    were incubated in the dark at 37 ◦ C for 2 h, and then the optical density was measured at
                                    450 nm. The experiments were performed in triplicate.

                                    Migration and invasion assays
                                    Cell migration and invasion assays were carried out in Transwell chambers (Corning, US).
                                    For the cell migration assay, a total of 4× 10⁴ cells in 200 µl of serum-free DMEM were
                                    seeded into the upper chamber. For the invasion assay, 4× 10⁴ cells suspended in serum-free
                                    medium were plated in the upper chamber coated with Matrigel (BD Biosciences, US).
                                    Lower chambers were filled with 500 µl of complete medium, and the cells were cultured
                                    for 48 h. The cells that passed through the membrane were stained with 0.5% crystal violet
                                    for 15 min. Cells were counted in five random areas to evaluate the migration and invasion
                                    abilities. The experiments were performed in triplicate.

                                    Quantitative real-time PCR (qRT-PCR)
                                    Total RNA was extracted from HCC cells and normal hepatic cells using TRIzol
                                    reagent (Invitrogen, US). The procedure was performed as described previously (Fang
                                    et al., 2018). GAPDH was used as an internal control. Relative expression levels of
                                    BUB1B were calculated according to the 2 11Ct method. All of the primers in
                                    this study were synthesized by ShenGong (Shanghai, China). The BUB1B primer
                                    sequences were as follows: (forward) 50 -CTGAGTGAAGCCATGTCCCT-30 and
                                    (reverse) 50 -AGATTCTTGTGCCAGTGCTCCC-30 . The GAPDH primer sequences
                                    were as follows: (forward) 50 -GCGACTTCAACAGCAACT CCC-30 and (reverse) 50 -
                                    CACCCTGTTGCTGTAGCCGTA-30 .

Fu et al. (2021), PeerJ, DOI 10.7717/peerj.10943                                                                          4/22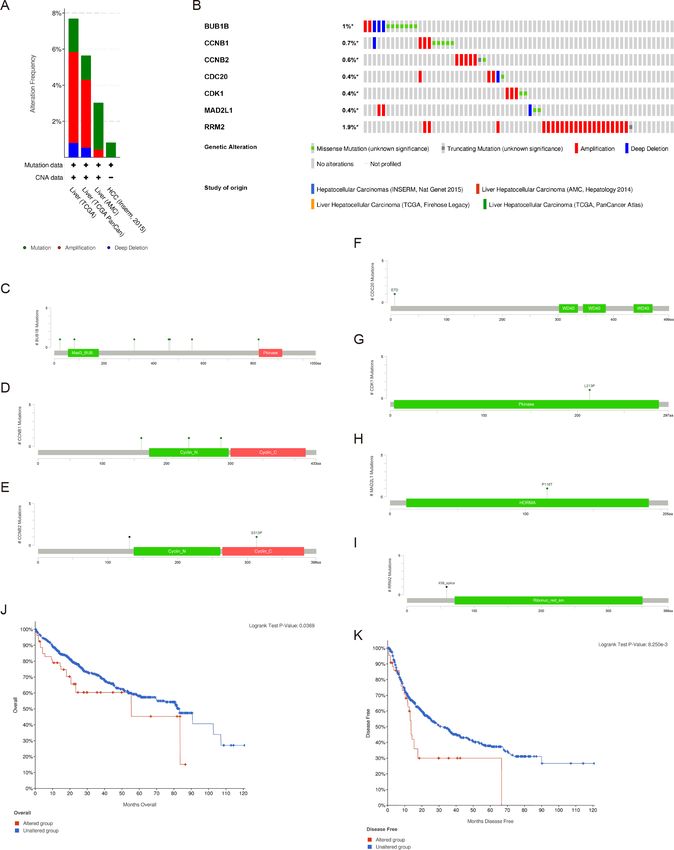
Flow cytometry
                                    The cell apoptosis rate and cell cycle were measured by flow cytometry. Briefly, HCC cells
                                    were subjected to various treatments, stained with 5 µl of FITC Annexin V and 5 µl PI (BD,
                                    US) for 15 min at RT in the dark, then cell apoptosis rate were analyzed by flow cytometry.
                                    For cell cycle, HCC cells after treatments were fixed in 70% ethanol at −20 ◦ C overnight.
                                    On the next day, cells were stained with PI (50 µg/mL, Sigma-Aldrich, US) for 20 min at
                                    room temperature in the dark and analyzed by flow cytometry.

                                    ATP and mitochondrial membrane potential detection
                                    Total ATP levels in HCC cells were measured using a luciferase-based ATP assay kit
                                    (Beyotime, China) according to the manufacturer’s instructions. The mitochondrial
                                    membrane potential was analyzed using JC 1 staining (Beyotime, China). Briefly, cells
                                    were washed with ice-cold PBS and then stained with JC-1 for 20 min at 37 ◦ C. After
                                    being washed with binding buffer, the cells were analyzed by fluorescence microscopy.
                                    The results are presented as the relative aggregate-to-monomer (red/green) fluorescence
                                    intensity ratio.

                                    Oxygen consumption rate (OCR) analysis
                                    Mitochondrial OCR of HCC cells were measured using the XF 24 analyzer (Seahorse
                                    Bioscience, US) according to the manufacturer’s instructions as previously described
                                    (Meng et al., 2017). Briefly, HepG2 and Huh7 cells treated with BUB1B siRNA or normal
                                    control were seeded into XF-24 microplates at 37 ◦ C with 5% CO2. Cells were maintained
                                    at 37 ◦ C in a non CO2 incubator for 1 h, and then the basal OCR of the HCC cells were
                                    measured. The OCR was normalized to the protein content.

                                    Statistical analysis
                                    SPSS version 19.0 was used to analyze the data. All data were expressed as the mean ± SEM.
                                    Student’s t -test was used in the two-group comparisons, and one-way ANOVA was used
                                    for more than two groups. P value < 0.05 was considered statistically significant.

                                    RESULTS
                                    Identification of DEGs in HCC
                                    There were 264 HCC tissues and 91 normal hepatic tissues included in our study. Via the
                                    GEO2R online tool, we identified 309, 288, 461 and 326 DEGs from GSE45267, GSE98383,
                                    GSE101685 and GSE112790, respectively. Then, we used a Venn diagram to identify the
                                    intersected DEGs among the four datasets. A total of 81 common DEGs were identified, of
                                    which 36 were upregulated (Fig. 1A) and 45 were downregulated (Fig. 1B) in HCC tissues
                                    compared with normal hepatic tissues (Table 1).

                                    GO annotation and KEGG pathway analysis of DEGs
                                    GO annotation and KEGG pathway enrichment analysis of all 81 DEGs were performed
                                    by the DAVID online tool. The top 5 enriched GO terms are listed (Table 2). The results
                                    of the GO BP analysis indicated that the upregulated DEGs were enriched in mitotic
                                    nuclear division, cell division, sister chromatid cohesion, G2/M transition of mitotic

Fu et al. (2021), PeerJ, DOI 10.7717/peerj.10943                                                                          5/22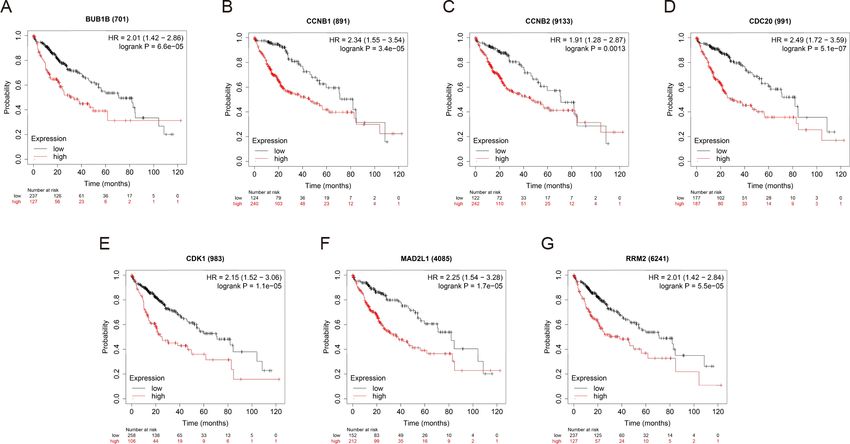
Figure 1 Identification of common DEGs from the GSE45267, GSE98383, GSE101685 and GSE112790
                                     datasets. Venn diagram of (A) upregulated and (B) downregulated DEGs between HCC tissues and nor-
                                     mal hepatic tissues based on the four GEO datasets. The intersecting areas represent the commonly altered
                                     DEGs. DEGs, differentially expressed genes; HCC, hepatocellular carcinoma; GEO, Gene Expression Om-
                                     nibus.
                                                                                                    Full-size DOI: 10.7717/peerj.10943/fig-1

                                     Table 1 Eighty-one common differentially expressed genes (DEGs) were detected from four GEO
                                     datasets, including 36 upregulated genes and 45 downregulated genes in the HCC tissues compared to
                                     normal hepatic tissues.

                                      DEGs                                        Genes Name
                                      Up-regulated                                KIF20A CDKN3 IGF2BP3 RRM2 AKR1B10 CCNB1 CDK1
                                                                                  PBK NUF2 NDC80 COCH NCAPG DUXAP10 TOP2A
                                                                                  CENPF GINS1 SPINK1 GPC3 CD109 MELK ASPM BUB1B
                                                                                  MAD2L1 CENPU HMMR DLGAP5 KIF4A DTL CCNB2
                                                                                  TTK CDC20 FAM83D NEK2 ANLN PRC1 BIRC5
                                      Down-regulated                              CETP CRHBP LPA RSPO3 EGR1 ADRA1A CLEC1B
                                                                                  IGFBP3 FOS FCN3 FOSB HHIP LIFR APOF APOA5
                                                                                  HAMP PDGFRA DNASE1L3 DCN TTC36 PGLYRP2
                                                                                  ADH1B CLEC4G C9 LINC01093 MARCO ADH4 CXCL14
                                                                                  GPM6A IGF1 SRPX SLCO1B3 CYP2E1 NNMT OIT3
                                                                                  HGF ADGRG7 LCAT CXCL12 GNMT C7 FCN2 LYVE1
                                                                                  SLC25A47 MFSD2A

                                    cell cycle, and mitotic spindle assembly checkpoint. The downregulated DEGs were
                                    enriched in lipoprotein metabolic process, phosphatidylcholine metabolic process, cell
                                    chemotaxis, positive regulation of phosphatidylinositol 3-kinase signaling, and lipid
                                    transport. In the GO CC analysis, upregulated DEGs were significantly enriched in the
                                    midbody, condensed chromosome kinetochore, kinetochore, spindle pole, and spindle.
                                    In addition, downregulated DEGs were enriched in extracellular region, high-density
                                    lipoprotein particle, extracellular space, integral component of plasma membrane,
                                    and blood microparticle. In the GO MF analysis, upregulated DEGs were significantly
                                    enriched in protein binding, microtubule binding, protein serine/threonine kinase activity,
                                    cyclin-dependent protein serine/threonine kinase activity, and protein kinase activity.

Fu et al. (2021), PeerJ, DOI 10.7717/peerj.10943                                                                                          6/22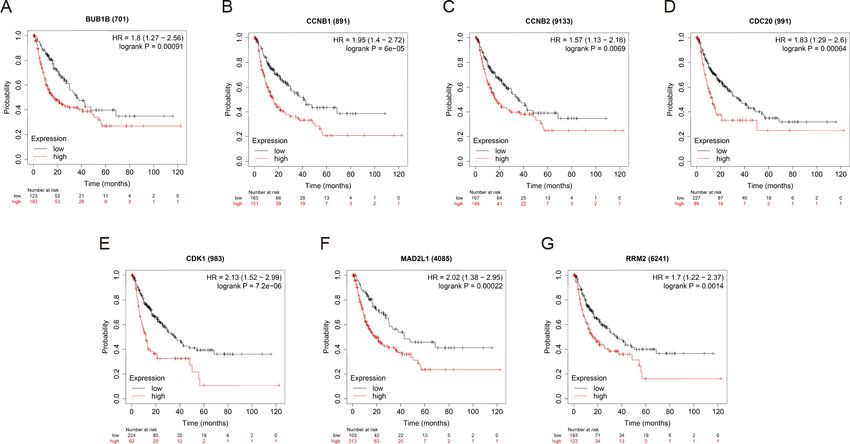
Table 2 Gene Ontology analysis of DEGs in HCC.

 Expression     Category                  Term                                                        Count   p-Value    FDR
 Up-            GOTERM_BP_DIRECT          GO:0007067∼mitotic nuclear division                         13      3.39E−14   4.51E−11
 regulated      GOTERM_BP_DIRECT          GO:0051301∼cell division                                    13      2.02E−12   2.70E−09
                GOTERM_BP_DIRECT          GO:0007062∼sister chromatid cohesion                        8       1.25E−09   1.66E−06
                GOTERM_BP_DIRECT          GO:0000086∼G2/M transition of mitotic cell cycle            7       2.94E−07   3.93E−04
                GOTERM_BP_DIRECT          GO:0007094∼mitotic spindle assembly checkpoint              4       8.44E−06   0.011255
                GOTERM_CC_DIRECT          GO:0030496∼midbody                                          8       3.47E−09   3.69E−06
                GOTERM_CC_DIRECT          GO:0000777∼condensed chromosome kinetochore                 7       1.20E−08   1.28E−05
                GOTERM_CC_DIRECT          GO:0000776∼kinetochore                                      6       3.85E−07   4.09E−04
                GOTERM_CC_DIRECT          GO:0000922∼spindle pole                                     6       1.69E−06   0.001798
                GOTERM_CC_DIRECT          GO:0005819∼spindle                                          6       2.83E−06   0.003011
                GOTERM_MF_DIRECT          GO:0005515∼protein binding                                  31      8.61E−06   0.009201
                GOTERM_MF_DIRECT          GO:0008017∼microtubule binding                              5       7.77E−04   0.827275
                GOTERM_MF_DIRECT          GO:0004674∼protein serine/threonine kinase activity         6       8.73E−04   0.928326
                GOTERM_MF_DIRECT          GO:0004693∼cyclin-dependent protein serine/threonine        3       0.002121   2.24328
                                          kinase activity
                GOTERM_MF_DIRECT          GO:0004672∼protein kinase activity                          5       0.005637   5.860713
 Down-          GOTERM_BP_DIRECT          GO:0042157∼lipoprotein metabolic process                    4       1.15E−04   0.16458
 regulated      GOTERM_BP_DIRECT          GO:0046470∼phosphatidylcholine metabolic process            3       2.71E−04   0.386322
                GOTERM_BP_DIRECT          GO:0060326∼cell chemotaxis                                  4       5.71E−04   0.810655
                GOTERM_BP_DIRECT          GO:0014068∼positive regulation of phosphatidylinositol 3-   4       5.71E−04   0.810655
                                          kinase signaling
                GOTERM_BP_DIRECT          GO:0006869∼lipid transport                                  4       9.01E−04   1.277227
                GOTERM_CC_DIRECT          GO:0005576∼extracellular region                             19      4.40E−09   4.54E−06
                GOTERM_CC_DIRECT          GO:0034364∼high-density lipoprotein particle                4       1.70E−05   0.017543
                GOTERM_CC_DIRECT          GO:0005615∼extracellular space                              11      7.78E−04   0.80017
                GOTERM_CC_DIRECT          GO:0005887∼integral component of plasma membrane            10      0.004284   4.333163
                GOTERM_CC_DIRECT          GO:0072562∼blood microparticle                              4       0.005147   5.185309
                GOTERM_MF_DIRECT          GO:0015485∼cholesterol binding                              3       0.004029   4.881137
                GOTERM_MF_DIRECT          GO:0004024∼alcohol dehydrogenase activity, zinc-            2       0.013784   15.80658
                                          dependent
                GOTERM_MF_DIRECT          GO:0004252∼serine-type endopeptidase activity               4       0.020868   23.00373
                GOTERM_MF_DIRECT          GO:0005548∼phospholipid transporter activity                2       0.02287    24.93304
                GOTERM_MF_DIRECT          GO:0017127∼cholesterol transporter activity                 2       0.034113   34.96525

                                    The downregulated DEGs were enriched in cholesterol binding, zinc-dependent alcohol
                                    dehydrogenase activity, serine-type endopeptidase activity, phospholipid transporter
                                    activity, cholesterol transporter activity. In addition, the top 4 enriched KEGG pathways of
                                    DEGs were listed as Table 3. Upregulated genes were enriched in cell cycle, oocyte meiosis,
                                    p53 signaling pathway, progesterone-mediated oocyte maturation. And downregulated
                                    genes were enriched in prion diseases, pathways in cancer, drug metabolism-cytochrome
                                    P450, and melanoma.

Fu et al. (2021), PeerJ, DOI 10.7717/peerj.10943                                                                                   7/22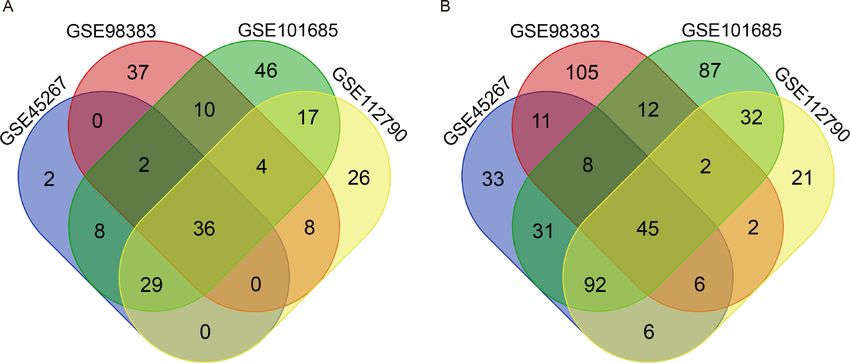
Table 3 KEGG pathway analysis of DEGs in HCC.

 Expression            Term                                                  Count        p-Value         Genes
 Upregulated           hsa04110: Cell cycle                                  7            1.30E−08        CCNB1, CDK1,
                                                                                                          MAD2L1, CCNB2,
                                                                                                          TTK, BUB1B, CDC20
                       hsa04114: Oocyte meiosis                              5            1.94E−05        CCNB1, CDK1,
                                                                                                          MAD2L1, CCNB2,
                                                                                                          CDC20
                       hsa04115: p53 signaling pathway                       4            1.38E−04        CCNB1, CDK1, CCNB2,
                                                                                                          RRM2
                       hsa04914: Progesterone-mediated oocyte maturation     4            3.00E−04        CCNB1, CDK1,
                                                                                                          MAD2L1, CCNB2
 Downregulated         hsa05020: Prion diseases                              3            0.005622        EGR1, C7, C9
                       hsa05200: Pathways in cancer                          6            0.008486        FOS, PDGFRA, IGF1,
                                                                                                          HHIP, HGF, CXCL12
                       hsa00982: Drug metabolism- cytochrome P450            3            0.02131         ADH4, ADH1B, CYP2E1
                       hsa05218: Melanoma                                    3            0.023107        PDGFRA, IGF1, HGF

                                      PPI and modular analysis
                                      The PPI network of the 81 DEGs was constructed by the STRING database, as shown in
                                      Fig. 2A. Then, we used the MCODE plugin of Cytoscape software for further modular
                                      analysis. The results showed that 29 central nodes were identified (Fig. 2B). Further KEGG
                                      analysis of the 29 genes in the central nodes showed that they were significantly enriched
                                      in the cell cycle, oocyte meiosis, p53 signaling pathway, progesterone-mediated oocyte
                                      maturation and HTLV-I infection (Table 4). The remaining 7 genes found in significantly
                                      enriched pathways, namely, mitotic checkpoint serine/threonine kinase B (BUB1B), cyclin
                                      B1 (CCNB1), cyclin B2 (CCNB2), cell division cycle 20 (CDC20), cyclin-dependent kinase
                                      1 (CDK1), MAD2 mitotic arrest deficient-like 1 (MAD2L1) and ribonucleotide reductase
                                      M2 (RRM2), were regarded as hub genes.

                                      Validation of the expression levels of the 7 Hub genes in HCC
                                      To validate the mRNA expression levels of the screened hub genes between HCC and
                                      normal hepatic tissues, a meta-analysis on the mRNA expression levels of BUB1B, CCNB1,
                                      CCNB2, CDC20, CDK1, MAD2L1 and RRM2 was performed based on the ONCOMINE
                                      database. As displayed in Fig. 3, all the hub genes were significantly highly expressed in
                                      HCC tissues (P < 0.05) compared with normal hepatic tissues. The results from the GEPIA
                                      database also revealed that the mRNA levels of all 7 hub genes were significantly highly
                                      expressed in HCC tissues (Fig. 4). These results were consistent with previous microarray
                                      data.

                                      Genetic alterations and prognostic values of the hub genes
                                      There were significant genetic alterations in the 7 hub genes in the HCC cases, as evaluated
                                      by the online tool cBioPortal. The mRNA sequences of the 7 hub genes in HCC were
                                      amplified (Figs. 5A, 5B). The specific mutation information of each hub gene is displayed
                                      individually (Figs. 5C–5I). Kaplan Meier plots were used to compare OS and DFS in

Fu et al. (2021), PeerJ, DOI 10.7717/peerj.10943                                                                               8/22
Figure 2 PPI network construction and module analysis. (A) A PPI network was constructed based
on all 81 DEGs using the STRING database. Module analysis of the PPI network was performed by the
MCODE plugin of Cytoscape. (B) Twenty-nine central nodes were identified. PPI, protein–protein inter-
action; DEGs, differentially expressed genes; STRING, Search Tool for the Retrieval of Interacting Genes.
Full-size DOI: 10.7717/peerj.10943/fig-2
Table 4 Reanalysis of the 29 genes in the central nodes by KEGG pathway enrichment.
Term Count p-Value Genes
hsa04110: Cell cycle 6 9.42E−08 CCNB1, CDK1, MAD2L1, CCNB2, BUB1B, CDC20
hsa04114: Oocyte meiosis 5 4.28E−06 CCNB1, CDK1, MAD2L1, CCNB2, CDC20
hsa04115: p53 signaling pathway 4 4.78E−05 CCNB1, CDK1, CCNB2, RRM2
hsa04914: Progesterone-mediated oocyte maturation 4 1.05E−04 CCNB1, CDK1, MAD2L1, CCNB2
hsa05166: HTLV-I infection 3 0.032823 MAD2L1, BUB1B, CDC20
HCC patients with or without alterations in the mRNA expression levels of the 7 hub genes
through cBioPortal. As revealed in Figs. 5J, 5K, HCC cases with altered hub gene expression
exhibited significantly worse OS and DFS than those with unaltered hub gene expression.
Survival analysis of the hub genes
OS and RFS analyses of the 7 hub genes were further performed by Kaplan Meier plotter. As
displayed in Fig. 6, the high expression levels of BUB1B, CCNB1, CCNB2, CDC20, CDK1,
MAD2L1 and RRM2 in patients with HCC were associated with poor OS. Unfavorable
RFS was also markedly observed in HCC patients with higher expression levels of the 7 hub
genes (Fig. 7). Patients were divided into two groups (‘‘high’’ and ‘‘low’’ group) according
to 50% cut-off value.
Decreased BUB1B expression inhibited the proliferation, migration,
and invasion, promoted the apoptosis and blocked cell cycle of hcc
cells
Except for BUB1B, the mechanisms of the other hub genes in hepatocarcinogenesis have
been elucidated to varying degrees (Foijer et al., 2017; Jin et al., 2020; Li et al., 2014; Li, Bai
Fu et al. (2021), PeerJ, DOI 10.7717/peerj.10943 9/22Figure 3 Meta-analysis of the mRNA expression levels of (A) BUB1B, (B) CCNB1, (C) CCNB2, (D)
CDC20, (E) CDK1, (F) MAD2L1 and (G) RRM2 in HCC tissues compared with normal hepatic tissues
using the ONCOMINE database. The colored squares represent the median rank of these genes across
five datasets in ONCOMINE. P < 0.05 was regarded as statistically significant. HCC, hepatocellular carci-
noma. The expression level is described by Z -score.
Full-size DOI: 10.7717/peerj.10943/fig-3
& Zhang, 2017; Liu et al., 2020; Wu et al., 2018b; Yang, Lin & Liu, 2020). Therefore, the
relationship between BUB1B and other hub genes was investigated first. As shown in Fig. 8,
BUB1B was significantly associated with the other six hub genes. To further investigate
the specific biological role of BUB1B in HCC, in vitro mechanistic experiments were
conducted. The expression levels of BUB1B in HCC cells and normal hepatic cells were
detected by qRT-PCR. The results showed that BUB1B mRNA levels were obviously higher
in the HCC cell lines HepG2 and Huh7 than in the normal cell line LO2 (Fig. 9A). To assess
the biological functions of BUB1B in HCC, we transfected small interfering RNA (siRNA)
or negative control into HepG2 and Huh7 cell lines. The knockdown efficiency of BUB1B
by the siRNAs was confirmed using qRT-PCR (Fig. 9B). The results suggested that si-1
and si-2 had clear knockdown effects and were selected for subsequent functional studies.
CCK-8 assays confirmed the inhibitory effect of decreased BUB1B expression on HCC
cells (Fig. 9C). Moreover, colony formation assays indicated that BUB1B downregulation
significantly suppressed the proliferation of HepG2 and Huh7 cells (Fig. 9D). Next, the
effects of BUB1B on the migration and invasion of HCC cells were explored by Transwell
assays. The results demonstrated that the numbers of migrated and invaded cells were
significantly lower in the BUB1B knockdown group than in the control group (Figs. 9E,
9F). We further investigated whether BUB1B played a role in the apoptosis and cell cycle
of HCC cells. Flow cytometry indicated that BUB1B knockdown resulted in a significantly
higher apoptosis rate and G0/G1 phase arrest compared with that in the control group
Fu et al. (2021), PeerJ, DOI 10.7717/peerj.10943 10/22Figure 4 Validation of the mRNA expression levels of (A) BUB1B, (B) CCNB1, (C) CCNB2, (D)
CDC20, (E) CDK1, (F) MAD2L1 and (G) RRM2 in LIHC tissues compared with normal hepatic tissues
using the GEPIA online tool. These box plots are based on 369 hepatocellular carcinoma samples (red)
and 160 normal liver samples (gray). *P < 0.05 was considered statistically significant. LIHC, liver
hepatocellular carcinoma. The expression level is described by log2(TPM + 1).
Full-size DOI: 10.7717/peerj.10943/fig-4
(Figs. 9G, 9H). These results indicate that downregulated BUB1B significantly inhibited
the proliferation, migration, and invasion, promoted the apoptosis and blocked cell cycle
of HCC cells in vitro. The oncogenic role of BUB1B in HCC was further validated by its
overexpression (Supporting Fig. 1).
BUB1B plays a role in mitochondrial function
Mitochondria are involved in energy synthesis, apoptosis and other important biological
processes and are vital for cell survival and function. Recently, mitochondrial dysfunction
has been reported to participate in tumorigenesis (Davis et al., 2020; Vyas, Zaganjor &
Haigis, 2016; Zhang et al., 2019). To further understand the mechanistic oncogenic role
of BUB1B, mitochondrial bioenergetics were investigated. As shown in Fig. 10A, total
ATP production was significantly downregulated after BUB1B knockdown. JC-1 staining
demonstrated that the mitochondrial membrane potential, which is a biomarker of
apoptosis, was also reduced after BUB1B deletion (Fig. 10B). Next, the mitochondrial OCR
of HCC cells were measured using the XF-24 analyzer. As shown in Fig. 10C, the basal OCR
Fu et al. (2021), PeerJ, DOI 10.7717/peerj.10943 11/22Figure 5 Genetic alterations and prognostic values of the seven hub genes. (A, B) The frequencies of
genetic alterations of the seven hub genes in HCC tissues were identified by cBioPortal. The specific mu-
tation information for (C) BUB1B, (D) CCNB1, (E) CCNB2, (F) CDC20, (G) CDK1, (H) MAD2L1 and
(I) RRM2 is displayed individually. (J, K) HCC cases with altered hub gene expression exhibited signif-
icantly worse OS and DFS compared to those with unaltered hub gene expression. HCC, hepatocellular
carcinoma. OS, overall survival; DFS, disease-free survival.
Full-size DOI: 10.7717/peerj.10943/fig-5
Fu et al. (2021), PeerJ, DOI 10.7717/peerj.10943 12/22Figure 6 OS of the seven hub genes (A) BUB1B, (B) CCNB1, (C) CCNB2, (D) CDC20, (E) CDK1, (F)
MAD2L1 and (G) RRM2 in patients with HCC were analyzed by Kaplan–Meier plotter. The data are
presented as the hazard ratios with 95% confidence intervals. Log–rank P < 0.01 was regarded as statisti-
cally significant. OS, overall survival; HCC, hepatocellular carcinoma.
Full-size DOI: 10.7717/peerj.10943/fig-6
Figure 7 RFS of the seven hub genes (A) BUB1B, (B) CCNB1, (C) CCNB2, (D) CDC20, (E) CDK1, (F)
MAD2L1 and (G) RRM2 in patients with HCC were analyzed by Kaplan–Meier plotter. The data are
presented as hazard ratios with 95% confidence intervals. Log–rank P < 0.01 was regarded as statistically
significant. RFS, relapse-free survival; HCC, hepatocellular carcinoma.
Full-size DOI: 10.7717/peerj.10943/fig-7
Fu et al. (2021), PeerJ, DOI 10.7717/peerj.10943 13/22Figure 8 Correlations between BUB1B and (A) CCNB1, (B) CCNB2, (C) CDC20, (D) CDK1, (E)
MAD2L1 and (F) RRM2 were analyzed by GEPIA. GEPIA, gene expression profiling interactive analysis.
Full-size DOI: 10.7717/peerj.10943/fig-8
was significantly decreased after BUB1B knockdown. On the contrary, overexpression of
BUB1B increased OCR, ATP content and mitochondrial membrane potential (Supporting
Fig. 2). These results indicate that BUB1B exerts its oncogenic effect partially by affecting
mitochondrial function.
DISCUSSION
To identify more specific and effective biomarkers in HCC that are closely related to
tumorigenesis, chemoresistance and prognosis, a combination analysis of bioinformatic
methods and chip data based on a large number of clinical samples was conducted.
In this study, four GEO datasets (GSE45267, GSE98383, GSE101685 and GSE112790)
were analyzed. DEGs between HCC tissues and normal hepatic tissues were identified by
GEO2R. Next, PPI network, GO annotation and KEGG pathway enrichment analyses of
the DEGs were conducted. There were 29 central nodes identified by STRING and the
MCODE plugin of Cytoscape. Further KEGG analysis of these 29 genes showed that they
were significantly enriched in the cell cycle, oocyte meiosis, the p53 signaling pathway,
progesterone-mediated oocyte maturation and HTLV-I infection. The remaining 7 genes
found in significantly enriched pathways, namely, BUB1B, CCNB1, CCNB2, CDC20,
CDK1, MAD2L1 and RRM2, were regarded as hub genes. The mRNA expression levels of
the 7 hub genes in HCC were further validated based on the online databases ONCOMINE
and GEPIA. Consistent with previous results, the 7 hub genes were significantly upregulated
in HCC tissues. Next, the frequencies of the genetic alterations and prognostic roles of
Fu et al. (2021), PeerJ, DOI 10.7717/peerj.10943 14/22Figure 9 Decreased BUB1B expression inhibited the proliferation, migration, and invasion, promoted
the apoptosis and blocked cell cycle of HCC cells. (A) The mRNA expression levels of BUB1B were de-
tected in HCC cells and normal hepatic cells. (B) qRT-PCR was used to confirm the knockdown efficiency
of the siRNAs against BUB1B. (C–G) CCK-8 assays and colony formation assays were performed to evalu-
ate the proliferation of the HCC cell lines. (H–M) The effects of BUB1B knockdown on cell migration and
invasion were determined by Transwell assays. (N–S) The cell apoptosis rate and cell cycle were analyzed
by flow cytometry in HCC cells. HCC, hepatocellular carcinoma; CCK-8, Cell Counting Cit-8. ∗ P < 0.05,
∗∗
P < 0.01, ∗∗∗ P < 0.001.
Full-size DOI: 10.7717/peerj.10943/fig-9
the 7 hub genes were evaluated by the online tool cBioPortal. Finally, the results showed
unfavorable OS and RFS in HCC patients with higher expression levels of the 7 hub genes,
which were confirmed by Kaplan Meier plotter.
CCNB1, CCNB2, CDK1 and CDC20, are all cell cycle-related proteins. Many studies
have demonstrated their oncogenic roles in the regulation of cell cycle progression in a
series of tumors, such as hepatocellular carcinoma (Jin et al., 2020; Li et al., 2014; Liu et al.,
2020; Wu et al., 2018a), bladder cancer (Heo et al., 2020; Kim et al., 2014), non-small lung
cancer (Qian et al., 2015; Wang et al., 2019a), pancreatic cancer (Wei et al., 2013; Zhang et
al., 2018) and breast cancer (Kidokoro et al., 2008; Kim et al., 2012; Parmar et al., 2018).
Fu et al. (2021), PeerJ, DOI 10.7717/peerj.10943 15/22Figure 10 BUB1B plays a role in mitochondrial function. Total ATP production was detected in differ-
ent treatment groups (A). Mitochondrial membrane potential was analyzed by JC-1 staining (B, C). The
basal OCR of HCC cells were measured using an XF-24 analyzer (D). OCR, oxygen consumption rate;
HCC, hepatocellular carcinoma. ∗ P < 0.05, ∗∗ P < 0.01, ∗∗∗ P < 0.001.
Full-size DOI: 10.7717/peerj.10943/fig-10
RRM2 is a reductase that catalyzes the formation of deoxyribonucleotides from
ribonucleotides. Synthesis of RRM2 is regulated in a cell cycle-dependent manner. RRM2
was reported to play an oncogenic role by protecting tumor cells from endogenous
replication stress (Zhang et al., 2019), defects in genes in the DNA repair pathways (Mazzu
et al., 2019), angiogenesis (Zhang et al., 2009), etc. Some recent studies also revealed that
RRM2 participated in hepatocellular carcinogenesis (Wang et al., 2016; Wu et al., 2018b;
Yang, Lin & Liu, 2020), consistent with our results.
MAD2L1 and BUB1B are proteins involved in cell mitosis. MAD2L1 was reported to
exert oncogenic effects in gastric cancer (Wang et al., 2019b) and lung cancer (Guo et al.,
2010), as well as HCC by regulating the malignant behaviors of tumor cells (Foijer et al.,
2017; Li, Bai & Zhang, 2017). BUB1B was also reported to play a role in a series of cancers,
such as colon cancer (Abal et al., 2007), brain tumor (Ding et al., 2013), glioblastoma
(Lee et al., 2017) and breast cancer (Scintu et al., 2007). However, its mechanistic role in
hepatocellular carcinogenesis remains unclear.
In this study, we further explored the role of BUB1B in HCC and its relationship with
the other identified hub genes. We found that BUB1B was closely related to the other hub
genes, and its expression was significantly higher in HCC cell lines than in normal hepatic
cells. Our in vitro experiments indicate that BUB1B plays roles in HCC cell proliferation,
migration, invasion, apoptosis and cell cycle. Further mechanistic studies showed that
BUB1B exerts its oncogenic effect partially by affecting mitochondrial function. However,
further studies based on larger sample sizes and a series of mechanistic experiments should
be carried out to validate the present findings.
CONCLUSIONS
We identified seven hub genes (BUB1B, CCNB1, CCNB2, CDC20, CDK1, MAD2L1 and
RRM2) that were associated with the expression and prognosis of HCC based on different
databases and a large number of clinical samples. And the oncogenic role of BUB1B in HCC
was first explained by integrated bioinformatics analysis and in vitro experiments. BUB1B
Fu et al. (2021), PeerJ, DOI 10.7717/peerj.10943 16/22exerts its oncogenic effect partially by affecting mitochondrial function. In summary, our
results provided a fundamental contribution for further researches aimed to find novel
diagnostic or prognostic biomarkers as well as therapeutic targets for HCC.
ACKNOWLEDGEMENTS
The authors want to thank the Medical Experimental Research Center, Second Xiangya
Hospital of Central South University, for providing the research platform.
ADDITIONAL INFORMATION AND DECLARATIONS
Funding
This work was supported by the National Natural Science Foundation of China, grant
81670111. The funders had no role in study design, data collection and analysis, decision
to publish, or preparation of the manuscript.
Grant Disclosures
The following grant information was disclosed by the authors:
National Natural Science Foundation of China: 81670111.
Competing Interests
The authors declare there are no competing interests.
Author Contributions
• Jie Fu conceived and designed the experiments, performed the experiments, analyzed
the data, prepared figures and/or tables, authored or reviewed drafts of the paper, and
approved the final draft.
• Xiao Zhang and Likun Yan performed the experiments, authored or reviewed drafts of
the paper, and approved the final draft.
• Yaoli Shao performed the experiments, prepared figures and/or tables, and approved
the final draft.
• Xinxu Liu, Yuan Chu and Ge Xu analyzed the data, prepared figures and/or tables, and
approved the final draft.
• Xundi Xu conceived and designed the experiments, authored or reviewed drafts of the
paper, and approved the final draft.
Data Availability
The following information was supplied regarding data availability:
Sequences are available at NCBI GEO: GSE45267, GSE98383, GSE101685 and
GSE112790.
Raw data are available in the Supplemental Files.
Supplemental Information
Supplemental information for this article can be found online at http://dx.doi.org/10.7717/
peerj.10943#supplemental-information.
Fu et al. (2021), PeerJ, DOI 10.7717/peerj.10943 17/22REFERENCES
Abal M, Obrador-Hevia A, Janssen KP, Casadome L, Menendez M, Carpentier S,
Barillot E, Wagner M, Ansorge W, Moeslein G, Fsihi H, Bezrookove V, Reventos
J, Louvard D, Capella G, Robine S. 2007. APC inactivation associates with abnormal
mitosis completion and concomitant BUB1B/MAD2L1 up-regulation. Gastroenterol-
ogy 132:2448–2458 DOI 10.1053/j.gastro.2007.03.027.
Barrett T, Suzek TO, Troup DB, Wilhite SE, Ngau WC, Ledoux P, Rudnev D, Lash AE,
Fujibuchi W, Edgar R. 2005. NCBI GEO: mining millions of expression profiles–
database and tools. Nucleic Acids Research 33:D562–D566 DOI 10.1093/nar/gki022.
Buisson R, Langenbucher A, Bowen D, Kwan EE, Benes CH, Zou L, Lawrence MS.
2019. Passenger hotspot mutations in cancer driven by APOBEC3A and mesoscale
genomic features. Science 364(6447):eaaw2872 DOI 10.1126/science.aaw2872.
Cancer Genome Atlas Research, Weinstein JN, Collisson EA, Mills GB, Shaw KR,
Ozenberger BA, Ellrott K, Shmulevich I, Sander C, Stuart JM. 2013. The Can-
cer Genome Atlas Pan-Cancer analysis project. Nature Genetics 45:1113–1120
DOI 10.1038/ng.2764.
Davis RT, Blake K, Ma D, Gabra MBI, Hernandez GA, Phung AT, Yang Y, Maurer D,
Lefebvre A, Alshetaiwi H, Xiao Z, Liu J, Locasale JW, Digman MA, Mjolsness E,
Kong M, Werb Z, Lawson DA. 2020. Transcriptional diversity and bioenergetic shift
in human breast cancer metastasis revealed by single-cell RNA sequencing. Nature
Cell Biology 22:310–320 DOI 10.1038/s41556-020-0477-0.
Diaz G, Engle RE, Tice A, Melis M, Montenegro S, Rodriguez-Canales J, Hanson J,
Emmert-Buck MR, Bock KW, Moore IN, Zamboni F, Govindarajan S, Kleiner
DE, Farci P. 2018. Molecular signature and mechanisms of hepatitis d virus-
associated hepatocellular carcinoma. Molecular Cancer Research 16:1406–1419
DOI 10.1158/1541-7786.mcr-18-0012.
Ding Y, Hubert CG, Herman J, Corrin P, Toledo CM, Skutt-Kakaria K, Vazquez J, Ba-
som R, Zhang B, Risler JK, Pollard SM, Nam DH, Delrow JJ, Zhu J, Lee J, DeLuca
J, Olson JM, Paddison PJ. 2013. Cancer-Specific requirement for BUB1B/BUBR1
in human brain tumor isolates and genetically transformed cells. Cancer Discovery
3:198–211 DOI 10.1158/2159-8290.cd-12-0353.
Emperle M, Adam S, Kunert S, Dukatz M, Baude A, Plass C, Rathert P, Bashtrykov
P, Jeltsch A. 2019. Mutations of R882 change flanking sequence preferences of the
DNA methyltransferase DNMT3A and cellular methylation patterns. Nucleic Acids
Research 47:11355–11367 DOI 10.1093/nar/gkz911.
Fang Y, Liu G, Xie C, Qian K, Lei X, Liu Q, Liu G, Cao Z, Fu J, Du H, Liu S, Huang
S, Hu J, Xu X. 2018. Pharmacological inhibition of TRPV4 channel suppresses
malignant biological behavior of hepatocellular carcinoma via modulation
of ERK signaling pathway. Biomedicine & Pharmacotherapy 101:910–919
DOI 10.1016/j.biopha.2018.03.014.
Foijer F, Albacker LA, Bakker B, Spierings DC, Yue Y, Xie SZ, Davis S, Lutum-Jehle
A, Takemoto D, Hare B, Furey B, Bronson RT, Lansdorp PM, Bradley A, Sorger
Fu et al. (2021), PeerJ, DOI 10.7717/peerj.10943 18/22PK. 2017. Deletion of the MAD2L1 spindle assembly checkpoint gene is tolerated
in mouse models of acute T-cell lymphoma and hepatocellular carcinoma. Elife
6:e20873 DOI 10.7554/eLife.20873.
Guo Y, Zhang X, Yang M, Miao X, Shi Y, Yao J, Tan W, Sun T, Zhao D, Yu D, Liu J, Lin
D. 2010. Functional evaluation of missense variations in the human MAD1L1 and
MAD2L1 genes and their impact on susceptibility to lung cancer. Journal of Medical
Genetics 47:616–622 DOI 10.1136/jmg.2009.074252.
Heo J, Noh BJ, Lee S, Lee HY, Kim Y, Lim J, Ju H, Yu HY, Ryu CM, Lee PC, Jeong H, Oh
Y, Kim K, Kim SY, Son J, Hong B, Kim JS, Cho YM, Shin DM. 2020. Phosphoryla-
tion of TFCP2L1 by CDK1 is required for stem cell pluripotency and bladder car-
cinogenesis. EMBO Molecular Medicine 12:e10880 DOI 10.15252/emmm.201910880.
Herrington DM, Mao C, Parker SJ, Fu Z, Yu G, Chen L, Venkatraman V, Fu Y, Wang
Y, Howard TD, Jun G, Zhao CF, Liu Y, Saylor G, Spivia WR, Athas GB, Troxclair
D, Hixson JE, Heide RSVander, Wang Y, Van Eyk JE. 2018. Proteomic architec-
ture of human coronary and aortic atherosclerosis. Circulation 137:2741–2756
DOI 10.1161/circulationaha.118.034365.
Hou GX, Liu P, Yang J, Wen S. 2017. Mining expression and prognosis of topoisomerase
isoforms in non-small-cell lung cancer by using Oncomine and Kaplan–Meier
plotter. PLOS ONE 12:e0174515 DOI 10.1371/journal.pone.0174515.
Huang da W, Sherman BT, Lempicki RA. 2009. Systematic and integrative analysis of
large gene lists using DAVID bioinformatics resources. Nature Protocols 4:44–57
DOI 10.1038/nprot.2008.211.
Jin J, Xu H, Li W, Xu X, Liu H, Wei F. 2020. LINC00346 acts as a competing en-
dogenous RNA regulating development of hepatocellular carcinoma via mod-
ulating CDK1/CCNB1 Axis. Frontiers in Bioengineering and Biotechnology 8:54
DOI 10.3389/fbioe.2020.00054.
Kidokoro T, Tanikawa C, Furukawa Y, Katagiri T, Nakamura Y, Matsuda K. 2008.
CDC20, a potential cancer therapeutic target, is negatively regulated by p53.
Oncogene 27:1562–1571 DOI 10.1038/sj.onc.1210799.
Kim SJ, Nakayama S, Shimazu K, Tamaki Y, Akazawa K, Tsukamoto F, Torikoshi Y,
Matsushima T, Shibayama M, Ishihara H, Noguchi S. 2012. Recurrence risk score
based on the specific activity of CDK1 and CDK2 predicts response to neoadjuvant
paclitaxel followed by 5-fluorouracil, epirubicin and cyclophosphamide in breast
cancers. Annals of Oncology 23:891–897 DOI 10.1093/annonc/mdr340.
Kim SK, Roh YG, Park K, Kang TH, Kim WJ, Lee JS, Leem SH, Chu IS. 2014. Expression
signature defined by FOXM1-CCNB1 activation predicts disease recurrence in
non-muscle-invasive bladder cancer. Clinical Cancer Research 20:3233–3243
DOI 10.1158/1078-0432.ccr-13-2761.
Lappalainen I, Almeida-King J, Kumanduri V, Senf A, Spalding JD, Ur-Rehman S,
Saunders G, Kandasamy J, Caccamo M, Leinonen R, Vaughan B, Laurent T,
Rowland F, Marin-Garcia P, Barker J, Jokinen P, Torres AC, Argila JRde, Llobet
OM, Medina I, Puy MS, Alberich M, De la Torre S, Navarro A, Paschall J, Flicek
Fu et al. (2021), PeerJ, DOI 10.7717/peerj.10943 19/22P. 2015. The European Genome-phenome Archive of human data consented for
biomedical research. Nature Genetics 47:692–695 DOI 10.1038/ng.3312.
Lee E, Pain M, Wang H, Herman JA, Toledo CM, DeLuca JG, Yong RL, Paddison P,
Zhu J. 2017. Sensitivity to BUB1B inhibition defines an alternative classification of
glioblastoma. Cancer Research 77:5518–5529 DOI 10.1158/0008-5472.can-17-0736.
Lee MS, Ryoo BY, Hsu CH, Numata K, Stein S, Verret W, Hack SP, Spahn J, Liu
B, Abdullah H, Wang Y, He AR, Lee KH. 2020. Atezolizumab with or with-
out bevacizumab in unresectable hepatocellular carcinoma (GO30140): an
open-label, multicentre, phase 1b study. The Lancet Oncology 21(20):808–820
DOI 10.1016/s1470-2045(20)30156-x.
Li J, Gao JZ, Du JL, Huang ZX, Wei LX. 2014. Increased CDC20 expression is associated
with development and progression of hepatocellular carcinoma. International Journal
of Oncology 45:1547–1555 DOI 10.3892/ijo.2014.2559.
Li Y, Bai W, Zhang J. 2017. MiR-200c-5p suppresses proliferation and metastasis of
human hepatocellular carcinoma (HCC) via suppressing MAD2L1. Biomedicine and
Pharmacotherapy 92:1038–1044 DOI 10.1016/j.biopha.2017.05.092.
Liu L, Chen A, Chen S, Song W, Yao Q, Wang P, Zhou S. 2020. CCNB2, NUSAP1 and
TK1 are associated with the prognosis and progression of hepatocellular carcinoma,
as revealed by co-expression analysis. Experimental and Therapeutic Medicine
19:2679–2689 DOI 10.3892/etm.2020.8522.
Mazzu YZ, Armenia J, Chakraborty G, Yoshikawa Y, Coggins SA, Nandakumar S,
Gerke TA, Pomerantz MM, Qiu X, Zhao H, Atiq M, Khan N, Komura K, Lee GM,
Fine SW, Bell C, O’Connor E, Long HW, Freedman ML, Kim B, Kantoff PW. 2019.
A Novel mechanism driving poor-prognosis prostate cancer: overexpression of the
DNA repair gene, Ribonucleotide reductase small subunit M2 (RRM2). Clinical
Cancer Research 25:4480–4492 DOI 10.1158/1078-0432.ccr-18-4046.
Meng W, Liang X, Chen H, Luo H, Bai J, Li G, Zhang Q, Xiao T, He S, Zhang Y, Xu Z,
Xiao B, Liu M, Hu F, Liu F. 2017. Rheb inhibits beiging of white adipose tissue via
PDE4D5-dependent downregulation of the cAMP-PKA signaling pathway. Diabetes
66:1198–1213 DOI 10.2337/db16-0886.
Mi N, Cao J, Zhang J, Fu W, Huang C, Gao L, Yue P, Bai B, Lin Y, Meng W, Li X.
2020. Identification of hub genes involved in the occurrence and development of
hepatocellular carcinoma via bioinformatics analysis. Oncology Letters 20:1695–1708
DOI 10.3892/ol.2020.11752.
Parmar MB, CR K, Löbenberg R, Uludağ H. 2018. Additive polyplexes to undertake
siRNA therapy against CDC20 and survivin in breast cancer cells. Biomacromolecules
19:4193–4206 DOI 10.1021/acs.biomac.8b00918.
Qian X, Song X, He Y, Yang Z, Sun T, Wang J, Zhu G, Xing W, You C. 2015. CCNB2
overexpression is a poor prognostic biomarker in Chinese NSCLC patients.
Biomedicine and Pharmacotherapy 74:222–227 DOI 10.1016/j.biopha.2015.08.004.
Qin S, Ren Z, Meng Z, Chen Z, Chai X. 2020. Effectiveness of anti-PD-1 for hepatocellu-
lar carcinoma - Authors’ reply. The Lancet Oncology 21:e294
DOI 10.1016/s1470-2045(20)30285-0.
Fu et al. (2021), PeerJ, DOI 10.7717/peerj.10943 20/22Raoul JL, Edeline J. 2020. Systemic treatment of hepatocellular carcinoma: stan-
dard of care in China and elsewhere. The Lancet Oncology 21(20):479–481
DOI 10.1016/s1470-2045(20)30082-6.
Rhodes DR, Kalyana-Sundaram S, Mahavisno V, Varambally R, Yu J, Briggs BB,
Barrette TR, Anstet MJ, Kincead-Beal C, Kulkarni P, Varambally S, Ghosh
D, Chinnaiyan AM. 2007. Oncomine 3.0: genes, pathways, and networks in
a collection of 18, 000 cancer gene expression profiles. Neoplasia 9:166–180
DOI 10.1593/neo.07112.
Scintu M, Vitale R, Prencipe M, Gallo AP, Bonghi L, Valori VM, Maiello E, Ri-
naldi M, Signori E, Rabitti C, Carella M, Dallapiccola B, Altomare V, Fazio
VM, Parrella P. 2007. Genomic instability and increased expression of BUB1B
and MAD2L1 genes in ductal breast carcinoma. Cancer Letters 254:298–307
DOI 10.1016/j.canlet.2007.03.021.
Shimada S, Mogushi K, Akiyama Y, Furuyama T, Watanabe S, Ogura T, Ogawa K, Ono
H, Mitsunori Y, Ban D, Kudo A, Arii S, Tanabe M, Wands JR, Tanaka S. 2019.
Comprehensive molecular and immunological characterization of hepatocellular
carcinoma. EBioMedicine 40:457–470 DOI 10.1016/j.ebiom.2018.12.058.
Siegel RL, Miller KD, Jemal A. 2017. Cancer statistics, 2017. CA: A Cancer Journal for
Clinicians 67:7–30 DOI 10.3322/caac.21387.
Tang Z, Kang B, Li C, Chen T, Zhang Z. 2019. GEPIA2: an enhanced web server for
large-scale expression profiling and interactive analysis. Nucleic Acids Research
47:w556–W560 DOI 10.1093/nar/gkz430.
Von Mering C, Huynen M, Jaeggi D, Schmidt S, Bork P, Snel B. 2003. STRING: a
database of predicted functional associations between proteins. Nucleic Acids
Research 31:258–261 DOI 10.1093/nar/gkg034.
Vyas S, Zaganjor E, Haigis MC. 2016. Mitochondria and cancer. Cell 166:555–566
DOI 10.1016/j.cell.2016.07.002.
Wang F, Chen X, Yu X, Lin Q. 2019a. Degradation of CCNB1 mediated by APC11
through UBA52 ubiquitination promotes cell cycle progression and proliferation
of non-small cell lung cancer cells. American Journal of Translational Research
11:7166–7185.
Wang HW, Hsieh TH, Huang SY, Chau GY, Tung CY, Su CW, Wu JC. 2013. Forfeited
hepatogenesis program and increased embryonic stem cell traits in young hepa-
tocellular carcinoma (HCC) comparing to elderly HCC. BMC Genomics 14:736
DOI 10.1186/1471-2164-14-736.
Wang Y, Wang F, He J, Du J, Zhang H, Shi H, Chen Y, Wei Y, Xue W, Yan J, Feng Y,
Gao Y, Li D, Han J, Zhang J. 2019b. miR-30a-3p targets MAD2L1 and regulates
proliferation of gastric cancer cells. OncoTargets and Therapy 12:11313–11324
DOI 10.2147/ott.s222854.
Wang Y, Zhi Q, Ye Q, Zhou C, Zhang L, Yan W, Wu Q, Zhang D, Li P, Huo K. 2016.
SCYL1-BP1 affects cell cycle arrest in human hepatocellular carcinoma cells via
Cyclin F and RRM2. Anti-Cancer Agents in Medicinal Chemistry 16:440–446
DOI 10.2174/1871520615666150518093814.
Fu et al. (2021), PeerJ, DOI 10.7717/peerj.10943 21/22Wei D, Parsels LA, Karnak D, Davis MA, Parsels JD, Marsh AC, Zhao L, May-
baum J, Lawrence TS, Sun Y, Morgan MA. 2013. Inhibition of protein phos-
phatase 2A radiosensitizes pancreatic cancers by modulating CDC25C/CDK1
and homologous recombination repair. Clinical Cancer Research 19:4422–4432
DOI 10.1158/1078-0432.ccr-13-0788.
Wu CX, Wang XQ, Chok SH, Man K, Tsang SHY, Chan ACY, Ma KW, Xia W, Che-
ung TT. 2018a. Blocking CDK1/PDK1/ β-Catenin signaling by CDK1 inhibitor
RO3306 increased the efficacy of sorafenib treatment by targeting cancer stem
cells in a preclinical model of hepatocellular carcinoma. Theranostics 8:3737–3750
DOI 10.7150/thno.25487.
Wu Y, Sun J, Li A, Chen D. 2018b. The promoted delivery of RRM2 siRNA to vascular
smooth muscle cells through liposome-polycation-DNA complex conjugated
with cell penetrating peptides. Biomedicine and Pharmacotherapy 103:982–988
DOI 10.1016/j.biopha.2018.03.068.
Xia Y, Li J, Liu G, Wang K, Qian G, Lu Z, Yang T, Yan Z, Lei Z, Si A, Wan X, Zhang
H, Gao C, Cheng Z, Pawlik TM, Wang H, Lau WY, Wu M, Shen F. 2019. Long-
term effects of repeat hepatectomy vs percutaneous radiofrequency ablation among
patients with recurrent hepatocellular carcinoma: a randomized clinical trial. JAMA
Oncology 6:255–263 DOI 10.1001/jamaoncol.2019.4477.
Yang PM, Lin LS, Liu TP. 2020. Sorafenib inhibits ribonucleotide reductase regulatory
subunit M2 (RRM2) in hepatocellular carcinoma cells. Biomolecules 10(1):117
DOI 10.3390/biom10010117.
Yang WX, Pan YY, You CG. 2019. CDK1, CCNB1, CDC20, BUB1, MAD2L1, MCM3,
BUB1B, MCM2, and RFC4 may be potential therapeutic targets for hepatocellular
carcinoma using integrated bioinformatic analysis. BioMed Research International
2019:1245072 DOI 10.1155/2019/1245072.
Zhang H, Zhang X, Li X, Meng WB, Bai ZT, Rui SZ, Wang ZF, Zhou WC, Jin XD. 2018.
Effect of CCNB1 silencing on cell cycle, senescence, and apoptosis through the p53
signaling pathway in pancreatic cancer. Journal of Cellular Physiology 234:619–631
DOI 10.1002/jcp.26816.
Zhang K, Hu S, Wu J, Chen L, Lu J, Wang X, Liu X, Zhou B, Yen Y. 2009. Overexpres-
sion of RRM2 decreases thrombspondin-1 and increases VEGF production in human
cancer cells in vitro and in vivo: implication of RRM2 in angiogenesis. Molecular
Cancer 8:11 DOI 10.1186/1476-4598-8-11.
Zhang Y, Wang Y, Xu J, Tian F, Hu S, Chen Y, Fu Z. 2019. Melatonin attenuates my-
ocardial ischemia-reperfusion injury via improving mitochondrial fusion/mitophagy
and activating the AMPK-OPA1 signaling pathways. Journal of Pineal Research
66:e12542 DOI 10.1111/jpi.12542.
Zhuang L, Yang Z, Meng Z. 2018. Upregulation of BUB1B, CCNB1, CDC7, CDC20, and
MCM3 in tumor tissues predicted worse overall survival and disease-free survival
in hepatocellular carcinoma patients. BioMed Research International 2018:7897346
DOI 10.1155/2018/7897346.
Fu et al. (2021), PeerJ, DOI 10.7717/peerj.10943 22/22You can also read