Macrosynteny analysis between Lentinula edodes and Lentinula novae zelandiae reveals signals of domestication in Lentinula edodes
←
→
Page content transcription
If your browser does not render page correctly, please read the page content below
www.nature.com/scientificreports
OPEN Macrosynteny analysis
between Lentinula edodes
and Lentinula novae‑zelandiae
reveals signals of domestication
in Lentinula edodes
Christopher Alan Smith
The basidiomycete fungus Lentinula novae-zelandiae is endemic to New Zealand and is a sister taxon
to Lentinula edodes, the second most cultivated mushroom in the world. To explore the biology of this
organism, a high-quality chromosome level reference genome of L. novae-zelandiae was produced.
Macrosyntenic comparisons between the genome assembly of L. novae-zelandiae, L. edodes and a
set of three genome assemblies of diverse species from the Agaricomycota reveal a high degree of
macrosyntenic restructuring within L. edodes consistent with signal of domestication. These results
show L. edodes has undergone significant genomic change during the course of its evolutionary
history, likely a result of its cultivation and domestication over the last 1000 years.
The genus Lentinula from the Basidiomycete order Agaricales, has a global distribution and consists of 7
described species, one of which is the well-known gourmet edible mushroom Lentinula edodes, colloquially
known as Shiitake. New Zealand is home to a single endemic species of Lentinula that represents the mono-
phyletic lineage Lentinula novae-zelandiae. Research investigating the biogeography and phylogenetic history
of the Lentinula genus strongly supports a Laurasian descent for L. novae-zelandiae, with a single long-distance
dispersal event from Australia sometime within the last 8 million years1. This data confirms earlier research that
shows L. novae-zelandiae belongs to a monophyletic clade found only in New Zealand. Aside from these articles,
little research has been undertaken on L. novae-zelandiae.
In contrast to this, L. edodes has a large natural range spanning mainland China and an even larger expanded
range as it is now the second most cultivated mushroom in the world2. Known as the Shiitake mushroom after
its common host, the Shii Tree (Castanopsis cuspidate), this fungus has been cultivated in China for at least
900–1000 years, with wild foraging being undertake for at least 1800 years2. This process has resulted in a
number of highly productive domesticated strains that are used to produce what has become the second largest
mushroom food crop in the world3–6.
The genomic impact of domestication has been comparatively well studied within the animal and plant king-
doms compared with the fungal k ingdom7, although some research has been u ndertaken4,7–12. The outcome of
this work has identified several features associated with domestication, such as interspecific hybridization events,
horizonal gene transfer events, copy number variations, genome decay, and chromosomal rearrangements. Fur-
thermore, a large body of evidence exists showing that mobile genetic elements can play a crucial role in shaping
the genomic architecture of an organism regardless of whether it has undergone a domestication process11,13.
No work to date has investigated whether there is any genomic signal of domestication in the Lentinula genus.
Species within the genus Lentinula, and in fact most Basidiomycete fungi, exist in the dikaryotic state during
vegetative growth14. This is a life stage where each cell is home to two nuclei, one from each of the parental strains.
When the fungus is preparing to produce fruit bodies, the two separate nuclei fuse in a process known as karyo-
gamy, followed by meiosis. This process results in four daughter spores produced through sexual recombination.
In brief, during meiosis homologous chromosomes pair, replicate, then separate. The pairing of homologous
chromosomes allows for crossing-over events in which genetic material is exchanged between them14. This
crossing-over is one of the sources of genetic variation derived through sexual recombination. It can even result
in entire arms of a chromosome pair being swapped between homologous chromosomes in extreme cases.
Manaaki Whenua – Landcare Research, Auckland, New Zealand. email: smithc@landcareresearch.co.nz
Scientific Reports | (2021) 11:9845 | https://doi.org/10.1038/s41598-021-89146-y 1
Vol.:(0123456789)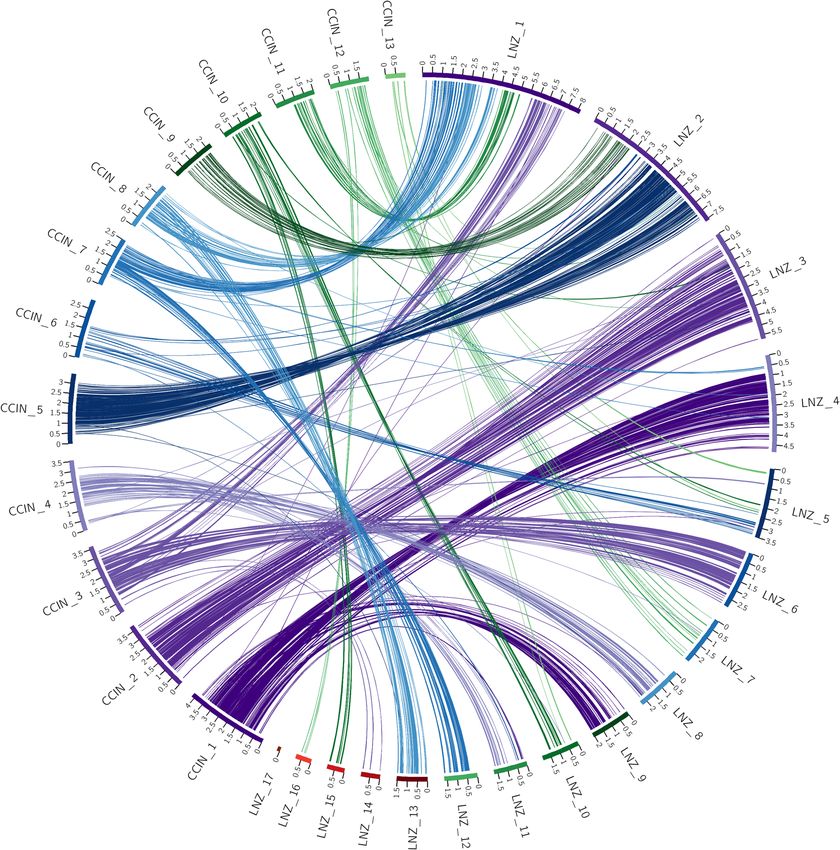
www.nature.com/scientificreports/
Non-homologous cross-over events, known as ectopic recombination, are likely to occur between repetitive
regions within homologous chromosomes which can result in chromosome length polymorphisms15–17. Ectopic
recombination between non-homologous chromosomes however is rare15–17. Research conducted in the 1990′s
showed that chromosome length polymorphisms (CLP) existed within species from a number of different fungal
lineages and suggested that this was a widespread phenomenon15–17. The results from this work show that crosses
between strains with CLP’s show progeny with CLP’s intermediate of the parental strains and that crosses between
non-polymorphic strains did not produce progeny with CLP’s. Due to the technical methodology at the time the
authors were unable to verify whether the CLP’s observed were due to ectopic recombination between repetitive
elements on non-homologous chromosomes or homologous pairing between polymorphic chromosomes. The
authors do suggest it is highly likely the latter and not the former due to the progeny results between strains with
CLP and non-polymorphic s trains16. No research in this space has been undertaken within the Omphalotaceae
or the genus Lentinula.
The importance of Shiitake as a food crop has led to efforts to produce a range of high-quality genomic
resources, with the current reference genome assembly on NCBI’s GenBank created from Pacific Biosciences
long-read technology18 and a further six other genome assemblies for L. edodes available for public research. In
parallel to this, at least seven efforts have been made to produce genetic linkage maps of L. edodes from 2002
through to 2 01919–25, which has resulted in the identification of 11–14 linkage groups. Work by many of the
same authors has also developed quantitative trait loci (QTL) associated with important agronomic t raits3,6,21,26.
Furthermore, RNA-Seq experiments have been conducted to understand how Shiitake responds to different
environments and t reatments27–29.
With the advent of third generation long-read sequencing technologies there has been an explosion of new
bioinformatic tools to process these data as well as a wealth of new research using this technology. This has
allowed for the production of genome assemblies with high levels of contiguity, something previously difficult and
expensive to attain with second generation short-read sequencing technologies. These highly contiguous genomes
allow for exploration of a number of areas that were previously intractable, such as: large-scale genome structure
analysis, known as m acrosynteny30; and longitudinal studies investigating how genome structure changes over
31
time . Large-scale genome synteny analysis is difficult to undertake with fragmented genomes, with previous
efforts focused on specific loci and the ordering of the genes; this is known as microsynteny32–35.
Macrosynteny analysis of fungal genomes is limited. While some work30,36 has been done in this area in
the Agaricales, there is much still to be done. Exploration of these macrosyntenic relationships findings so far
highlight a large degree of conserved macrosyntenic structure within the order Agaricales, with an early study
finding extensive synteny between the model organism Coprinopsis cinerea and the mycorrhizal agaric Laccaria
bicolor36. A recent article found a similar degree of conserved macrosynteny between the edible mushrooms
Agrocybe cylindracea and Agrocybe aegerita and the toxic mushroom Galerina marginata30.
The monophyletic nature of the Lentinula novae-zelandiae lineage combined with the geographic isolation
of this species make it a prime candidate for comparative genomic analysis with L. edodes. A high-quality chro-
mosome scale genome assembly of L. novae-zelandiae was created to be used as the lynchpin for macrosyntenic
analysis between it and L. edodes to explore whether the domestication of L. edodes has resulted in any changes
at the chromosome level.
Results
Genome assembly and annotation of Lentinula novae‑zelandiae ICMP 18003. The genome of
L. novae-zelandiae ICMP 18003 was assembled using 8 Gb of base called long-read MinION data and 18 Gb
of paired-end short-read Illumina data, to an average depth of 127X and 137X coverage respectively following
quality control. Analysis of the illumina dataset with GenomeScope reported a haploid genome length between
38.58 to 38.63 Mb, consisting of 5.88 to 5.89 Mb of repetitive content and with a heterozygosity of 0.871% to
0.879%. The model fit for these metrics was 95.25% to 96.98%.
The assembly pipeline produced a chromosome scale genome assembly consisting of 17 scaffolds with a
total genome size of 48.9 Mb. The assembled genome had a GC content of 46.49%, an N50 of 4,832,147 bp and
a L50 of 4, with the largest scaffold being 8,122,969 nucleotides long. Of these 17 scaffolds, the second-longest
scaffold is a fully assembled chromosome capped with telomeric sequences on each end and with only a single
gap in the scaffold. A further 13 sequences had at least one end capped by telomeric sequence. These telomeric
sequences consisted of the repeating motif of TTAGGGG, with between 26 and 31 repetitions, with nucleotide
lengths ranging from 183 to 220 bp.
Analysis with BUSCO reported the L. novae-zelandiae ICMP 18003 genome assembly has a completeness
score of 96.5%. This consists of 3,636 complete single-copy BUSCOs out of a total of 3870, with 98 duplicated
BUSCOs and 109 missing BUSCOs.
Genome assembly annotation. The L. edodes B17 and L. novae-zelandiae ICMP 18003 genome assem-
blies had their repetitive content analysed as part of the assembly pipeline. In total the L. edodes B17 genome
had 24.9% identified as repetitive elements and the L. novae-zelandiae ICMP 18003 had 31.82% of its genome
identified as repetitive elements. The larger repetitive content of the L. novae-zelandiae ICMP 18003 genome
compared to the L. edodes B17 genome was primarily due to an increase in the number of LTR elements, with
significant increases in the number of Gypsy DIRS1 elements accounting for the large bulk of the LTR elements,
with the remainder mostly made up of Type 1 Copia elements. There are more than 1000 unclassified repetitive
elements identified within the L. novae-zelandiae ICMP 18003 assembly than compared with the L. edodes B17
genome assembly.
Scientific Reports | (2021) 11:9845 | https://doi.org/10.1038/s41598-021-89146-y 2
Vol:.(1234567890)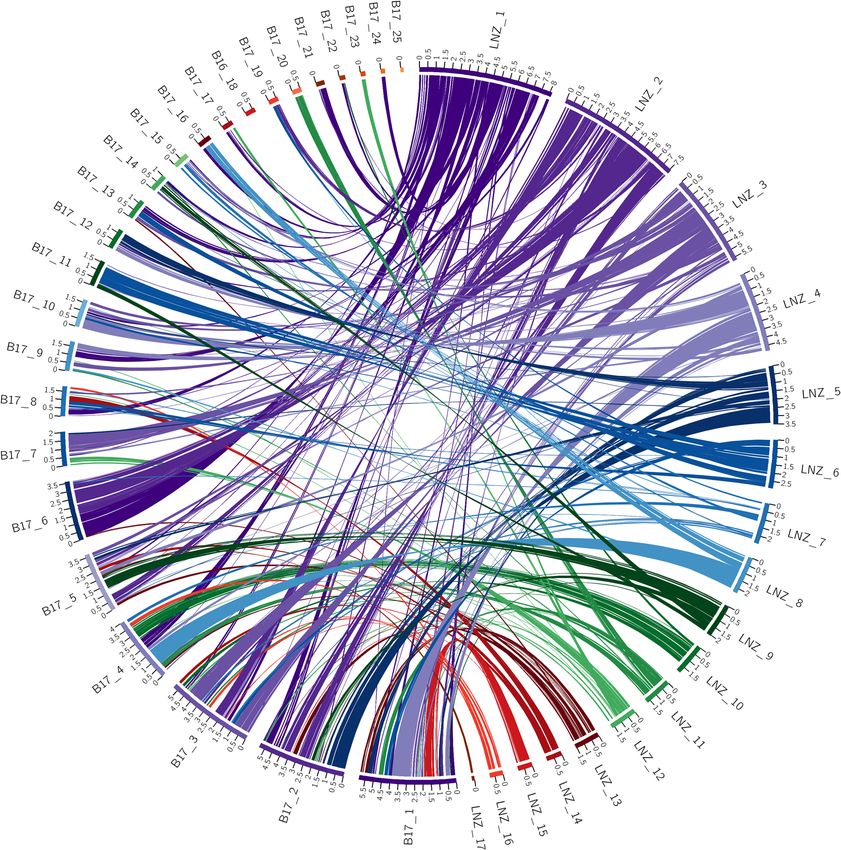
www.nature.com/scientificreports/
The Funannotate pipeline produced a set of high-quality gene models for both the L. novae-zelandiae ICMP
18003 genome and the L. edodes B17 genome, with 12,443 gene models predicted for L. novae-zelandiae ICMP
18003 and 11,999 for L. edodes B17.
Comparative genomics and macrosynteny. Agaricomycete reference genomes. One L. edodes genome
was identified as suitable for macrosyntenic analysis; the representative genome assembly of L. edodes, assembly
GCA_001562095.1 identified as strain B1718. This genome was selected as the long-read based genome assembly
as it was assembled with F ALCON37 using 61X coverage of long-read data produced via a PacBio RS II system.
This assembly was further scaffolded using 120X coverage of long-mated pair reads (5-kb and 10-kb libraries) as
well as 86.1X coverage of short-insert reads (500-bp library) with the software SSPACE and G apCloser18.
NCBI’s GenBank database yielded 270 genome assemblies for within the Agaricomycetes. Of those, six genome
assemblies were identified as being chromosome scale genome assemblies; Agaricus bisporus ASM30057v2, Flam-
mulina velutipes Fv1.0, Hericium erinaceus HeCS-4_2.0, Pleurotus ostreatus 03989_v2, Pyrrhoderma noxium
ASM228747v2 and Trametes hirsuta TraHir072. In addition to this, the C. cinerea CC3 assembly was selected as
a candidate as it is considered a chromosome-scale genome assembly and syntenic analysis has been undertaken
on it previously36. Furthermore, work done in a recent article38 on the genus Armillaria produced 11 putative
chromosomes for A. ostoyae, bringing the total number of chromosome scale assemblies within the Agaricomy-
cetes to eight. The genome assemblies of C. cinerea CC3 and P. noxium had predicted gene sets and as such were
deemed suitable for macrosyntenic analysis.
The L. edodes B17 genome had five telomeric regions identified. Of these, three are located embedded within
the scaffold in which they were identified, with only two capping the end of a scaffold. None of the embedded
telomeric sequences had flanking assembly gaps. The telomeric sequences in the B17 genome ranged from 10
to 25 repeats of the telomeric motif and had nucleotide lengths from 73 to 179 bp. No telomeric regions were
identified within the C. cinerea CC3 genome. The P. noxium genome assembly had 13 telomeric regions identi-
fied, all at terminal ends of assembled scaffolds. A summary of genome assembly metrics identified telomeric
regions can be found in Supplementary Table 1.
Macrosynteny analysis. Pairwise macrosynteny analysis was conducted using both SynChro and Satsuma2 on
the following genomes: C. cinerea CC3, L. edodes B17, L. novae-zelandiae ICMP 18003 and P. noxium.
A summary of the quantitative results from analysis with SynChro can be found in Supplementary Table 2. In
general, SynChro found 67.23% average similarity between syntenic homologs across assessed genome assem-
blies, except for the Lentinula species, which shared 86.21% average similarity. The average number of genes
per syntenic block ranged from 4.73 through to 28.91; however, the Lentinula species skew that result with an
average of 28.91 genes per block, whereas on average all the other pairwise comparisons had an average of 5.56
genes per block. The number of syntenic blocks identified between pairwise comparisons ranged from 361 to
715, with an average of 546.83 syntenic blocks per pairwise comparison. Interestingly, the fewest syntenic blocks
were found between L. edodes B17 and L. novae-zelandiae ICMP 18003 at 361 blocks, however this appears to
be due to the number of genes per syntenic block for those comparisons.
Supplementary Table 2 shows how many times two consecutive blocks from one genome were found on the
same chromosome of the compared genome. These data provide insights into the macrosyntenic relationships
between the pairwise species comparisons. Comparisons between the L. edodes B17 genome assembly and any
of the other analysed genomes showed a stark difference compared with the pairwise comparisons between the
rest of the compared species.
For example, L. edodes B17 when compared against C. cinerea showed 416 sets of two consecutive blocks of
the L. edodes genome were found within the C. cinerea genome; yet the P. noxium genome when compared against
C. cinerea in the same manner showed 668 blocks, despite it being from a basal order to that which L. edodes is
found. When comparing L. novae-zelandiae to the L. edodes B17 genome, only 166 syntenic blocks are identified.
In contrast, L. novae-zelandiae shows 573 consecutive blocks of its genome are found on the same chromosomes
within the C. cinerea genome and 402 consecutive blocks shared between it and P. noxium.
The ordering of the syntenic blocks identified across pairwise comparisons also matches this trend. Visuali-
zation of the macrosyntenic relationships between the pairwise comparisons of genome assemblies with Circos
highlight the above-stated trend. These plots readily show the high level of conservation of macrosyntenic struc-
ture in all comparisons except for those with L. edodes. In these plots the colored ribbon connections between
scaffolds represent syntenic blocks, with the width of the connection points scaled to the size of the syntenic
block. For each plot the ribbons have been labelled according to one of the genomes as stated in the legend for
each. This allows for identifying rearrangements between the query and target genome.
The SynChro results in Fig. 1 show a high degree of conserved macrosyntenic structure. For example, scaffold
1 in the C. cinerea genome primarily links with scaffold 4 and 9 of the L. novae-zelandiae ICMP 18003 genome
assembly. Of significance is that there are only four small ribbons linking scaffold 4 of the L. novae-zelandiae
ICMP 18003 genome assembly to scaffold 7 of the C. cinerea genome assembly and no other links to scaffold
9. In contrast to this, Fig. 2 shows the macrosyntenic relationship between C. cinerea and L. edodes B17, with
scaffold 1 of the C. cinerea genome assembly linking with eight scaffolds in the L. edodes B17 genome assembly,
each of which has numerous links to other scaffolds within the C. cinerea genome assembly. Furthermore, the
ordering of ribbon links within the L. edodes B17 genome assembly shows a high level of disorder, evidenced by
16 of the 25 scaffolds having ribbon links back to at least two or more C. cinerea assembly scaffolds. The pattern
observed in Fig. 1 is representative of a high level of conserved macrosynteny, whereas the pattern observed in
Fig. 2 shows a low level of conserved macrosynteny.
Scientific Reports | (2021) 11:9845 | https://doi.org/10.1038/s41598-021-89146-y 3
Vol.:(0123456789)www.nature.com/scientificreports/
Figure 1. Circos plot of shared syntenic regions between C. cinerea and L. novae-zelandiae ICMP 18003.
Syntenic regions are connected with colored ribbons scaled to the size of the syntenic regions. These ribbons
match the colors of the C. cinerea scaffold blocks. Genomic scaffold lengths are in Mb and are indicated by the
numerals on each scaffold.
Syntenic relationships as identified with SynChro between the L. novae-zelandiae ICMP 18003 genome assem-
bly and the L. edodes B17 genome assembly are shown in Fig. 3. Despite SynChro finding the highest number of
syntenic blocks between these species out of all pairwise comparisons, the macrosyntenic structure is massively
disordered when compared with that seen in Fig. 1. Of the 25 scaffolds within the L. edodes B17 genome assembly,
17 have significant links to two or more scaffolds within the L. novae-zelandiae ICMP 18003 genome assembly.
Some of these links may simply be a signal that they are part of the same chromosome but were unable to be
assembled together due to the bioinformatics processes used and/or the nature of the dataset. However, scaffolds
1 to 6, all of which are 3.5 Mb or more, appear to have a high degree of macrosyntenic restructuring. Scaffold
1 for example, has links to 9 scaffolds within the L. novae-zelandiae ICMP 18003 genome assembly. Given that
scaffold 2 of the L. novae-zelandiae ICMP 18003 assembly is a fully assembled telomere to telomere chromosome
it represents a powerful data resource in this context. Interestingly, scaffold 6 of the L. edodes B17 genome has
almost equal syntenic links to scaffold 1 and scaffold 2 of the L. novae-zelandiae ICMP 18003 genome assembly.
Analysis with Satsuma2 identified the same trend of macrosyntenic relationships as SynChro did, as evi-
denced by the Circos plots produced from the results. Overall Satsuma2 found significantly fewer macrosyntenic
blocks than SynChro did; however, the pattern of organisation of those blocks is consistent with those found by
SynChro. A composite image of all pair-wise syntenic analyses with both SynChro and Satsuma2 can be found
in Supplementary Image 1.
Scientific Reports | (2021) 11:9845 | https://doi.org/10.1038/s41598-021-89146-y 4
Vol:.(1234567890)www.nature.com/scientificreports/
Figure 2. Circos plot of shared syntenic regions between C. cinerea and L. edodes B17. Syntenic regions are
connected with colored ribbons scaled to the size of the syntenic regions. These ribbons match the colors of
the C. cinerea scaffold blocks. Genomic scaffold lengths are in Mb and are indicated by the numerals on each
scaffold.
Discussion
In this study a chromosome-scale genome assembly for L. novae-zealandiae ICMP 18003 was created using ONT
long-read data, illumina short-read data, and state-of-the-art bioinformatics tools. This assembly was produced
using a bespoke hybrid assembly pipeline that has resulted in the first chromosome-scale genome assembly for
the Lentinula genus. The L. novae-zelandiae ICMP 18003 genome assembly was used as a focal data set to con-
duct macrosyntenic analyses between it, L. edodes, and two other chromosome-scale genome assemblies from
the taxonomic class Agaricomycota to identify whether there were any signals of domestication within the L.
edodes lineage.
When considering the known history and biogeography of L. edodes and L. novae-zelandiae, the obvious fea-
ture that marks a difference between the two closely related species is the long history of cultivation across a large
geographic region of L. edodes. This cultivation has spanned an estimated 1000 years, whereas L. novae-zelandiae
has no history of cultivation and is a geographically isolated monophyletic lineage1,39,40. This history and how
closely related these species are makes L. novae-zelandiae an ideal species against which to compare L. edodes.
Research on fungal genome structure in response to domestication suggests large macrosyntenic rear-
rangements can occur frequently and rapidly within populations and can even lead to diversification of
lineages7–9,11,13,31,41. For example, research in brewer’s yeast has shown that chromosomes can fragment and sub-
sequently be misrepaired by being fused together at telomere regions, resulting in new chromosomes with embed-
ded telomeric sequences within t hem11,13,41. The results presented here identified telomeric regions embedded
Scientific Reports | (2021) 11:9845 | https://doi.org/10.1038/s41598-021-89146-y 5
Vol.:(0123456789)www.nature.com/scientificreports/
Figure 3. Circos plot of shared syntenic regions between L. edodes B17 and L. novae-zelandiae ICMP 18003.
Syntenic regions are connected with colored ribbons scaled to the size of the syntenic regions. These ribbons
match the colors of the L. novae-zelandiae ICMP 18003 scaffold blocks. Genomic scaffold lengths are in Mb and
are indicated by the numerals on each scaffold.
within scaffolds of the L. edodes genomes with no assembly gaps on either side. Given the high-quality nature of
the genome and the lack of assembly gaps, the location of these telomeric regions is highly supported. Further
potential signal of domestication is readily apparent in the high degree of macrosyntenic rearrangements that
has occurred within the L. edodes B17 genome. Macrosyntenic analysis results from both SynChro and Satsuma2
show the same high level of conserved macrosyntenic structure shared between all genome assemblies assessed
except for the L. edodes B17 genome. Previous research has found a similar level of conserved macrosynteny
across species within the Agaricales30,36. The trend of conserved macrosynteny is supported by these results for
all species except for L. edodes, with even the distantly related P. noxium from the basal order Hymenochaetales
conforming to the trend. The B17 L. edodes genome assembly used within this study was derived from a single
spore monokaryotic strain and as such some of its genomic structure may be due to inherited CLP’s from the
parental strains15–17. The research in this area suggests that these CLP’s are derived from recombination of homol-
ogous chromosomes of differing lengths. If the parental strains of the B17 monokaryon had CLP’s then this may
explain some of the structural differences observed, but it cannot explain the embedded telomeric regions nor
the high degree of observed restructuring between scaffolds 1 through 6 identified via SynChro and Satsuma2.
The finding of such a large degree of macrosyntenic differences between these two species within the same
genus is therefore remarkable. Furthermore, these results could explain the varying results produced in the
linkage group analysis work previously done, where between 11 and 14 linkage groups have been found. It may
be that these results are not an artifact of the protocols used but are simply due to different cultures having dif-
ferent karyotypes.
Scientific Reports | (2021) 11:9845 | https://doi.org/10.1038/s41598-021-89146-y 6
Vol:.(1234567890)www.nature.com/scientificreports/
The biological ramifications of these genomic restructuring events are unknown, yet it is possible that these
macrosyntenic changes have been underpinning adaptation of L. edodes to the commercial production environ-
ment. Future work in this area should focus on assessing the macrosyntenic differences within a large number of
L. edodes cultivars through whole-genome sequencing. Research has shown that contiguity of a genome assembly
is critical for meaningful macrosyntenic analysis, as such future assemblies should ideally be produced de novo
using third-generation long-read sequencing technology with a robust quality-controlled assembly pipeline that
involves a final curation step42. This final curation step is highly recommended43 but rarely undertaken in contem-
porary genome assembly projects. Studies have identified many genome assemblies across all organismal groups
that have significant amounts of contaminant s equence44–49. It would be prudent to investigate the gene regions
flanking these structural re-arrangements as these may have given rise to fusion genes, pseudogenes or differen-
tially regulated genes. Further validation of these structural rearrangements with wet-lab based techniques such
as karyotyping and PCR amplification of fusion genes would provide strong evidence to support these findings.
With only a single highly-contiguous L. edodes genome available, it is beyond the scope of this research
to report on how much macrosyntenic diversity exists within the population of L. edodes. It is reasonable to
hypothesize that there may be significant macrosyntenic variation within the L. edodes population, and it is
likely these differences would be readily found between wild populations and cultivars that are commercially
used. The genome assembly of L. novae-zelandiae reported here will provide a valuable resource for researchers
undertaking comparative genomic studies within the genus Lentinula as well as for those with an interest in
exploring the effects of domestication on fungi.
Conclusion
The highly contiguous genome assembly of L. novae-zelandiae produced here has provided the means to make a
meaningful macrosyntenic comparison between it and L. edodes. This comparison has revealed a large degree of
macrosyntenic re-structuring within the B17 genome assembly of L. edodes that is potentially due to domestica-
tion. The genome assembly of L. novae-zelandiae is the first chromosome-scale assembly for the Lentinula genus
and as such it represents a rich resource for future research; not only this but the methodology presented here
provides a means for the production of high-quality fungal reference genomes using state-of-the-art technology.
Methods
Fungal culture. A culture of Lentinula novae-zelandiae was obtained from the International Collection of
Microorganisms from Plants held by Manaaki Whenua – Landcare Research in New Zealand50. This axenic cul-
ture was isolated from a fruiting body collected in the Dunedin Botanic Gardens in 1991 by Dr Peter Buchanan
and was deposited as ICMP 18003.
Lentinula novae‑zelandiae ICMP 18003 DNA extraction and sequencing. Fungal genomic DNA
was extracted from the dikaryotic culture ICMP 18003 of Lentinula novae-zelandiae that had been grown on
PDA media at 23 °C for two weeks. Fungal tissue was ground into a fine powder using liquid nitrogen in a mortar
and pestle before being extracted using the phenol/chloroform based protocol: High-quality DNA from fungi for
long-read sequencing protocol51 DNA purity was assessed on a Nanodrop spectrophotometer. DNA fragmenta-
tion was assessed by running 1 ul of DNA extract on a 1% agarose gel at 80 V for 120 min. Concentration of DNA
was assessed using the dsDNA HS assay on a Qubit 4 fluorometer (Thermo Fisher).
Illumina library preparation and sequencing. A library was prepared from the extracted DNA by Mac-
rogen using the TruSeq Nano DNA kit with a 350 bp insert size. This was then sequenced on an illumina MiSeq
platform with 100 bp paired end reads.
DNA Size selection and library preparation. DNA fragments less than 10 kb were depleted via a size
selection protocol using AMPure XP beads (Beckman Coulter). 0.45X volume of resuspended AMPure XP bead
solution was added to the extracted DNA and incubated at room temperature with gentle mixing for 20 min.
The sample was then placed onto a magnetic rack until the solution was clear, following which the supernatant
was removed and the sample was then washed twice with 200 ul of fresh 70% EtOH. DNA was then eluted in 50
ul of EB (10 mM Tris pH 8.0) at room temperature for 2 min before being returned to the magnetic rack until
the solution was clear. The DNA containing supernatant was then transferred to a fresh 1.5-ml Eppendorf DNA
LoBind tube.
DNA repair (NEBNext FFPE DNA Repair Mix, NEB M6630) was performed on extracted fungal genomic
DNA following Oxford Nanopore Technologies recommended protocol. The repaired DNA was then purified
by adding 60 ul of resuspended AMPure XP beads to the sample in a fresh 1.5 ml Eppendorf DNA LoBind tube.
The sample was incubated at room temperature for 5 min with gentle mixing, washed twice with 200 ul fresh
70% ethanol, pellet allowed to dry for 30 s, and DNA eluted in 61 ul of EB (10 mM Tris pH 8.0). A 1 ul aliquot
was quantified by fluorometry (Qubit 4) to ensure ≥ 1 ug DNA was retained.
Ligation was performed by adding 25 ul of Ligation Buffer, 10 ul of NEBNext Quick T4 DNA Ligase and 5
ul Adapter Mix (SQK-LSK109 Ligation Sequencing Kit, Oxford Nanopore Technologies (ONT)) to the 60 ul
of DNA sample from the previous step. This was mixed gently and incubated at room temperature for 10 min.
The adaptor-ligated DNA was cleaned using 40 ul of AMPure XP beads and Short Fragment Buffer (SQK-
LSK109). The purified-ligated DNA was resuspended in 15 ul EB (10 mM Tris pH 8.0), incubated at room
temperature for 10 min, pelleting the beads again, and transferring the supernatant to a new tube. A 1-ul aliquot
was quantified by fluorometry (Qubit 4) to ensure ≥ 500 ng DNA was retained.
Scientific Reports | (2021) 11:9845 | https://doi.org/10.1038/s41598-021-89146-y 7
Vol.:(0123456789)www.nature.com/scientificreports/
MinION sequencing. MinIon sequencing was performed as per manufacturer’s guidelines using a single
R9.4 flow cell (FLO-MIN106D). MinION sequencing was controlled using Oxford Nanopore Technologies Min-
KNOW software.
Genome assembly and annotation of Lentinula novae‑zelandiae ICMP 18003. Genome size and
heterozygosity estimation. Genome size, repetitive content and heterozygosity were estimated using the illumi-
na sequence data set and the online web tool GenomeScope52. Kmer counting was done using Jellyfish v. 2.2.1053
with the resulting histogram uploaded to the GenomeScope server for analysis.
DNA sequence processing and quality control. The illumina short-read data set was trimmed using Sickle v. 1.33
in the paired-end mode54. Raw minion signal data was basecalled using Guppy v. 3.3.0 using the high accuracy
dna_r9.4.1_450bps_hac.cfg model with homopolymer correction and a qscore filter set to a minimum of 6. The
basecalled long-read MinION data was trimmed using Porechop v. 0.2.4 (Wick, R)55 with default parameters.
The trimmed long-read dataset was corrected using NECAT v. 2020011956 with an estimated genome size of
60 M with all other settings as default.
Genome assembly and quality control. The NECAT corrected long-read MinION data set was assembled using
Canu v. 2.057. The assembled sequences were polished using HyPo v. 1.0.258 with the trimmed illumina short-
read data set and the NECAT corrected MinION data set. The genome assembly was then phased using the
Purge Haplotigs v. 1.1.1 p ipeline59. Scaffolding of the assembled sequences was undertaken with SLR v. 1.060
using the NECAT corrected long-read MinION data set. SLR was run with default settings.
Curation of the genome was undertaken using Tapestry v. 1.0.061, with a read depth subsampling of 50X
coverage. Contaminant or residual duplicated sequences were removed when they had a read depth coverage
that fell outside the range of 30–50X coverage, or with a GC content of less than 45%. These parameters were
selected based on recommendations from the Tapestry documentation and the GC content of the L. edodes
genomes. Following this curation, the assembly was polished a final time using Pilon v. 1.2362 using the illumina
short-read data set. Core genome metrics were assessed using QUAST with default settings, v. 5.0.263. Genome
completeness was assessed using BUSCO v. 4.0.264 with the agaricales_odb10.2019-11-20 dataset and Coprinus
as the Augustus species in the genome mode.
Genome annotation. RepeatModeler v. 2.0.165 was used to produce a custom repeat database for each Lentinula
genome assembly with the -LTRStruct option. The resultant repeat database was used with RepeatMasker v.
4.1.066 to mask repeats in each genome assembly.
The Funannotate v. 1.7.467 pipeline was used to predict gene sets for the repeat masked Lentinula genome
assemblies, with a minimum protein length of 20 amino acids. Transcript evidence to be used for downstream
gene model prediction was created using Trinity v. 2.8.568. The following datasets were downloaded from NCBI
Genbank with SRAtoolkit 2.9.6: SRR527823, SRR5891391, SRR5891392, SRR5891393. Each dataset was aligned
to the L. edodes B17 genome using STAR v. 2.7.069. Each dataset was assembled using Trinity in the genome
guided assembly mode with the jaccard clip option turned on and a max intron size set to 7568. Funannotate used
the assembled RNAseq data and the Basidiomycota BUSCO ODB9 dataset to train the ab initio gene prediction
programs Augustus v. 3.3.370, GeneMark-ET v. 4.071 and GlimmerHMM v. 3.0.472. EVidence Modeler v. 1.1.173
was used to generate a consensus set of gene predictions from the ab initio prediction programs. In the training
step, the four assembled transcriptome datasets previously described were used as well as the UniProt/SwissProt
protein database74. tRNAscan-SE v. 2.0.575 was used to predict tRNA genes.
Comparative analysis. Agaricomycete reference genomes. The NCBI GenBank genome database was
searched to identify L. edodes genomes appropriate for this study as well as to identify chromosome-scale ge-
nome assemblies within the taxonomic class Agaricomycetes. This was done by searching for “Agaricomycetes”,
with subsequent manual parsing of the summary file produced. Assemblies identified as chromosome scale
were flagged for further analysis with QUAST and had their telomeric regions identified. Assemblies that had
predicted gene sets were identified as suitable for downstream macrosynteny analysis.
Macrosynteny analysis. To analyse the macrosyntenic relationships between the different genome assemblies
thoroughly and reliably, macrosynteny analysis was conducted using two different pieces of software, each of
which takes a different approach to identifying macrosyntenic relationships.
The January 2015 version of the SynChro package from the CHROnicle software suite76,77 was used with
a delta value of 2. This software aims to identify homologous gene regions and takes as input the assembled
genomes and a set of gene predictions for each assembly. In parallel to this, genome synteny analysis was also
conducted with Satsuma2 v.2016112378. This software aims to identify homologous nucleotide regions and takes
as input the assembled genome. To visualize the output from these software, Circos v. 0.69-879 was used.
Data availability
The genomic data generated and analysed during this study are available at the Joint Genome Institute: https://
mycocosm.jgi.doe.gov/LnoICMP18003A_1/LnoICMP18003A_1.home.html.
Received: 11 November 2020; Accepted: 8 April 2021
Scientific Reports | (2021) 11:9845 | https://doi.org/10.1038/s41598-021-89146-y 8
Vol:.(1234567890)www.nature.com/scientificreports/
References
1. Hibbett, D. S. Shiitake mushrooms and molecular clocks: historical biogeography of Lentinula: historical biogeography of Lentinula.
J. Biogeogr. 28(2), 231–241. https://doi.org/10.1046/j.1365-2699.2001.00528.x (2001).
2. Chang, S. & Miles, P. Mushrooms: Cultivation, Nutritional Value, Medicinal Effect, and Environmental Impact 2nd edn. (CRC Press,
2004).
3. Gong, W. et al. Detection of quantitative trait loci underlying yield-related traits in shiitake culinary-medicinal mushroom, Lentinus
edodes (Agaricomycetes). Int. J. Med. Mushrooms 20(5), 451–458. https://doi.org/10.1615/IntJMedMushrooms.2018026236 (2018).
4. Ha, B. et al. Diversity of a mating type in Lentinula edodes and mating type preference in the cultivated strains. J. Microbiol. 56(6),
416–425. https://doi.org/10.1007/s12275-018-8030-6 (2018).
5. Lee, H.-Y. et al. Development of 44 novel polymorphic SSR markers for determination of shiitake mushroom (Lentinula edodes)
cultivars. Genes 8(4), 109. https://doi.org/10.3390/genes8040109 (2017).
6. Li, C. et al. Association mapping reveals genetic loci associated with important agronomic traits in Lentinula edodes shiitake
mushroom. Front. Microbiol. https://doi.org/10.3389/fmicb.2017.00237 (2017).
7. Steensels, J., Gallone, B., Voordeckers, K. & Verstrepen, K. J. Domestication of industrial microbes. Curr. Biol. 29(10), R381–R393.
https://doi.org/10.1016/j.cub.2019.04.025 (2019).
8. Baker, E. et al. The genome sequence of Saccharomyces eubayanus and the domestication of lager-brewing yeasts. Mol. Biol. Evol.
32(11), 2818–2831. https://doi.org/10.1093/molbev/msv168 (2015).
9. Gibbons, J. G. et al. The evolutionary imprint of domestication on genome variation and function of the filamentous fungus
Aspergillus oryzae. Curr. Biol. 22(15), 1403–1409. https://doi.org/10.1016/j.cub.2012.05.033 (2012).
10. Steenwyk, J. L. & Rokas, A. Copy number variation in fungi and its implications for wine yeast genetic diversity and adaptation.
Front. Microbiol. 9, 288. https://doi.org/10.3389/fmicb.2018.00288 (2018).
11. Stukenbrock, E. H. & Croll, D. The evolving fungal genome. Fungal Biol. Rev. 28(1), 1–12. https://doi.org/10.1016/j.fbr.2014.02.
001 (2014).
12. Wu, L. et al. Cloning of the Lentinula edodes B mating-type locus and identification of the genetic structure controlling B mating.
Gene 531(2), 270–278. https://doi.org/10.1016/j.gene.2013.08.090 (2013).
13. Castanera, R. et al. Transposable elements versus the fungal genome: impact on whole-genome architecture and transcriptional
profiles. PLOS Genet. 12(6), e1006108. https://doi.org/10.1371/journal.pgen.1006108 (2016).
14. Röhr, H., Stahl, U. & Kües, U. Recombination: meiotic recombination in fungi. In Progress in Botany (eds Behnke, H.-D. et al.)
307–351 (Springer, 1997). https://doi.org/10.1007/978-3-642-60458-4_13.
15. Fierro, F. & Martín, J. F. Molecular mechanisms of chromosomal rearrangement in fungi. Crit. Rev. Microbiol. 25(1), 1–17. https://
doi.org/10.1080/10408419991299185 (1999).
16. Zolan, M. E. Chromosome-Length Polymorphism in Fungi. Microbiol. Rev. 59(4), 686–698 (1995).
17. Zolan, M. E., Heyler, N. K. & Stassen, N. Y. Inheritance of chromosome-length polymorphisms in Coprinus cinereus. Genetics
137(1), 87–94 (1994).
18. Shim, D. et al. Whole genome de novo sequencing and genome annotation of the world popular cultivated edible mushroom,
Lentinula edodes. J. Biotechnol. 223, 24–25. https://doi.org/10.1016/j.jbiotec.2016.02.032 (2016).
19. Au, C. et al. Rapid genotyping by low-coverage resequencing to construct genetic linkage maps of fungi: a case study in Lentinula
edodes. BMC Res. Notes 6(1), 307. https://doi.org/10.1186/1756-0500-6-307 (2013).
20. Dong, H. et al. Construction of a genetic linkage map of Lentinula edodes based on SSR, SRAP and TRAP markers. Breed. Sci.
69(4), 585–591. https://doi.org/10.1270/jsbbs.18123 (2019).
21. Gong, W.-B. et al. Constructing a new integrated genetic linkage map and mapping quantitative trait loci for vegetative mycelium
growth rate in Lentinula edodes. Fungal Biol. 118(3), 295–308. https://doi.org/10.1016/j.funbio.2014.01.001 (2014).
22. Hoi-Shan, K. & Hai-Lou, X. Construction of a genetic linkage map of shiitake mushroom Lentinula edodes strain L-54. BMB Rep.
35(5), 465–471. https://doi.org/10.5483/BMBRep.2002.35.5.465 (2002).
23. Miyazaki, K. et al. Genetic map of a basidiomycete fungus, Lentinula edodes (Shiitake mushroom), constructed by tetrad analysis.
Breed. Sci. 58(1), 23–30. https://doi.org/10.1270/jsbbs.58.23 (2008).
24. Terashima, K. et al. Construction of a linkage map of Lentinula edodes (Shiitake) with the HEGS (high-efficiency genome scanning)
system: use of versatile AFLP and PCR-based gene markers. Mycoscience 47(6), 336–346. https://doi.org/10.1007/S10267-006-
0310-Z (2006).
25. Terashima, K., Matsumoto, T., Hayashi, E. & Fukumasa-Nakai, Y. A genetic linkage map of Lentinula edodes (Shiitake) based on
AFLP markers. Mycol. Res. 106(8), 911–917. https://doi.org/10.1017/S0953756202006275 (2002).
26. Gong, W. et al. Genetic dissection of fruiting body-related traits using quantitative trait loci mapping in Lentinula edodes. Appl.
Microbiol. Biotechnol. 100(12), 5437–5452. https://doi.org/10.1007/s00253-016-7347-5 (2016).
27. Kim, J. Y., Kim, D. Y., Park, Y.-J. & Jang, M.-J. Transcriptome analysis of the edible mushroom Lentinula edodes in response to blue
light. PLoS ONE 15(3), e0230680. https://doi.org/10.1371/journal.pone.0230680 (2020).
28. Tang, L. et al. Transcriptome analysis of candidate genes and signaling pathways associated with light-induced brown film forma-
tion in Lentinula edodes. Appl. Microbiol. Biotechnol. 97(11), 4977–4989. https://doi.org/10.1007/s00253-013-4832-y (2013).
29. Wang, Y., Zeng, X. & De, L. W. Novo transcriptomic analysis during Lentinula edodes fruiting body growth. Gene 641, 326–334.
https://doi.org/10.1016/j.gene.2017.10.061 (2018).
30. Liang, Y. et al. Genome assembly and pathway analysis of edible mushroom Agrocybe cylindracea. Genom. Proteom. Bioinform.
https://doi.org/10.1016/j.gpb.2018.10.009 (2020).
31. Large, C. R. L. et al. Genomic stability and adaptation of beer brewing yeasts during serial repitching in the brewery. Evol. Biol.
https://doi.org/10.1101/2020.06.26.166157 (2020).
32. Awan, A. R. et al. Convergent evolution of psilocybin biosynthesis by psychedelic mushrooms. Evol. Biol. https://doi.org/10.1101/
374199 (2018).
33. James, T. Y. et al. Polyporales genomes reveal the genetic architecture underlying tetrapolar and bipolar mating systems. Mycologia
105(6), 1374–1390. https://doi.org/10.3852/13-162 (2013).
34. Mujic, A. B. et al. Comparative genomics of the ectomycorrhizal sister species Rhizopogon Vinicolor and Rhizopogon Vesiculosus
(Basidiomycota: Boletales) reveals a divergence of the mating type B locus. G3amp58 GenesGenomesGenetics 7(6), 1775–1789.
https://doi.org/10.1534/g3.117.039396 (2017).
35. van Peer, A. F. et al. comparative genomics of the mating-type loci of the mushroom Flammulina velutipes reveals widespread
synteny and recent inversions. PLoS ONE 6(7), e22249. https://doi.org/10.1371/journal.pone.0022249 (2011).
36. Stajich, J. E. et al. Insights into evolution of multicellular fungi from the assembled chromosomes of the mushroom Coprinopsis
cinerea (Coprinus cinereus). Proc. Natl. Acad. Sci. 107(26), 11889–11894. https://doi.org/10.1073/pnas.1003391107 (2010).
37. Chin, C.-S. et al. phased diploid genome assembly with single-molecule real-time sequencing. Nat. Methods 13(12), 1050–1054.
https://doi.org/10.1038/nmeth.4035 (2016).
38. Heinzelmann, R., Rigling, D., Sipos, G., Münsterkötter, M. & Croll, D. Chromosomal assembly and analyses of genome-wide
recombination rates in the forest pathogenic fungus Armillaria ostoyae. Heredity 124(6), 699–713. https://d oi.o
rg/1 0.1 038/s 41437-
020-0306-z (2020).
Scientific Reports | (2021) 11:9845 | https://doi.org/10.1038/s41598-021-89146-y 9
Vol.:(0123456789)www.nature.com/scientificreports/
39. Fukumasa-Nakai, Y., Matsumoto, T. & Tokimoto, K. Detection and distribution of six linear mitochondrial plasmids in the shiitake
mushroom, Lentinula edodes. Mycoscience 39(2), 123–134. https://doi.org/10.1007/BF02464050 (1998).
40. Hibbett, D. S., Hansen, K. & Donoghue, M. J. Phylogeny and biogeography of Lentinula inferred from an expanded RDNA dataset.
Mycol. Res. 102(9), 1041–1049. https://doi.org/10.1017/S0953756297005996 (1998).
41. Gordon, J. L., Byrne, K. P. & Wolfe, K. H. Mechanisms of chromosome number evolution in yeast. PLoS Genet. 7(7), e1002190.
https://doi.org/10.1371/journal.pgen.1002190 (2011).
42. Liu, D., Hunt, M. & Tsai, I. J. Inferring synteny between genome assemblies: a systematic evaluation. BMC Bioinform. 19(1), 26.
https://doi.org/10.1186/s12859-018-2026-4 (2018).
43. Howe, K. et al. Significantly improving the quality of genome assemblies through curation. Bioinformatics https://doi.org/10.1101/
2020.08.12.247734 (2020).
44. Fierst, J. L. & Murdock, D. A. Decontaminating Eukaryotic genome assemblies with machine learning. BMC Bioinform. 18(1), 533.
https://doi.org/10.1186/s12859-017-1941-0 (2017).
45. Kryukov, K. & Imanishi, T. Human contamination in public genome assemblies. PLoS ONE 11(9), e0162424. https://doi.org/10.
1371/journal.pone.0162424 (2016).
46. Kumar, S., Jones, M., Koutsovoulos, G., Clarke, M. & Blaxter, M. Blobology: exploring raw genome data for contaminants, sym-
bionts and parasites using taxon-annotated GC-coverage plots. Front. Genet. https://doi.org/10.3389/fgene.2013.00237 (2013).
47. Laetsch, D. R. & Blaxter, M. L. BlobTools: interrogation of genome assemblies. F1000Research 6, 1287. https://doi.org/10.12688/
f1000research.12232.1 (2017).
48. Longo, M. S., O’Neill, M. J. & O’Neill, R. J. Abundant human DNA contamination identified in non-primate genome databases.
PLoS ONE 6(2), e16410. https://doi.org/10.1371/journal.pone.0016410 (2011).
49. Steinegger, M. & Salzberg, S. L. Terminating contamination: large-scale search identifies more than 2,000,000 contaminated entries
in GenBank. Genome Biol. 21(1), 115. https://doi.org/10.1186/s13059-020-02023-1 (2020).
50. Johnston, P. R., Weir, B. S. & Cooper, J. A. Open data on fungi and bacterial plant pathogens in New Zealand. Mycology 8(2), 59–66.
https://doi.org/10.1080/21501203.2016.1278409 (2017).
51. Schwessinger, B. High quality DNA from fungi for long read sequencing e.g. PacBio V11 (Protocols.Io.2yfgftn). https://doi.org/
10.17504/protocols.io.2yfgft n.
52. Vurture, G. W. et al. GenomeScope: fast reference-free genome profiling from short reads. Bioinforma. Oxf. Engl. 33(14), 2202–2204.
https://doi.org/10.1093/bioinformatics/btx153 (2017).
53. Marçais, G. & Kingsford, C. A fast, lock-free approach for efficient parallel counting of occurrences of k-mers. Bioinformatics 27(6),
764–770. https://doi.org/10.1093/bioinformatics/btr011 (2011).
54. Joshi, N. A., Fass, J. N. Sickle: a sliding-window, adaptive, quality-based trimming tool for FastQ files, (2011).
55. Wick, R. R., Judd, L. M., Gorrie, C. L. & Holt, K. E. Completing bacterial genome assemblies with multiplex minION sequencing.
Microb. Genom.3(10). (2017). https://doi.org/10.1099/mgen.0.000132.
56. Chen, Y. et al. Fast and accurate assembly of nanopore reads via progressive error correction and adaptive read selection. Bioin-
formatics https://doi.org/10.1101/2020.02.01.930107 (2020).
57. Koren, S. et al. Canu: scalable and accurate long-read assembly via adaptive k -mer weighting and repeat separation. Genome Res.
27(5), 722–736. https://doi.org/10.1101/gr.215087.116 (2017).
58. Kundu, R., Casey, J. & Sung, W.-K. HyPo: super fast & accurate polisher for long read genome assemblies. Bioinformatics https://
doi.org/10.1101/2019.12.19.882506 (2019).
59. Roach, M. J., Schmidt, S. A. & Borneman, A. R. Purge haplotigs: allelic contig reassignment for third-gen diploid genome assem-
blies. BMC Bioinform. 19(1), 460. https://doi.org/10.1186/s12859-018-2485-7 (2018).
60. Luo, J. et al. SLR: a Scaffolding algorithm based on long reads and contig classification. BMC Bioinformatics 20(1), 539. https://
doi.org/10.1186/s12859-019-3114-9 (2019).
61. Davey, J. W., Davis, S. J., Mottram, J. C. & Ashton, P. D. Tapestry: validate and edit small eukaryotic genome assemblies with long
reads. Bioinformatics https://doi.org/10.1101/2020.04.24.059402 (2020).
62. Walker, B. J. et al. Pilon: an integrated tool for comprehensive microbial variant detection and genome assembly improvement.
PLoS ONE 9(11), e112963. https://doi.org/10.1371/journal.pone.0112963 (2014).
63. Gurevich, A., Saveliev, V., Vyahhi, N. & Tesler, G. QUAST: quality assessment tool for genome assemblies. Bioinformatics 29(8),
1072–1075. https://doi.org/10.1093/bioinformatics/btt086 (2013).
64. Seppey, M., Manni, M. & Zdobnov, E. M. BUSCO: assessing genome assembly and annotation completeness. In Gene Prediction
Methods in Molecular Biology (ed. Kollmar, M.) 227–245 (Springer, 2019). https://doi.org/10.1007/978-1-4939-9173-0_14.
65. Smit, A. F. A. & Hubley, R. RepeatModeler.
66. Smit, A. F. A., Hubley, R & Green, P. RepeatMasker Open-4.0., (2013).
67. Palmer, J., & Stajich, J. Funannotate v1.7.4; Zenodo, (2019). https://doi.org/10.5281/ZENODO.2604804.
68. Haas, B. J. et al. Novo transcript sequence reconstruction from RNA-seq using the trinity platform for reference generation and
analysis. Nat. Protoc. 8(8), 1494–1512. https://doi.org/10.1038/nprot.2013.084 (2013).
69. Dobin, A. et al. STAR: ultrafast universal RNA-seq aligner. Bioinformatics 29(1), 15–21. https://doi.org/10.1093/bioinformatics/
bts635 (2013).
70. Keller, O., Kollmar, M., Stanke, M. & Waack, S. A novel hybrid gene prediction method employing protein multiple sequence
alignments. Bioinformatics 27(6), 757–763. https://doi.org/10.1093/bioinformatics/btr010 (2011).
71. Lomsadze, A., Burns, P. D. & Borodovsky, M. Integration of mapped RNA-Seq reads into automatic training of Eukaryotic gene
finding algorithm. Nucl. Acids Res. 42(15), e119–e119. https://doi.org/10.1093/nar/gku557 (2014).
72. Majoros, W. H., Pertea, M. & Salzberg, S. L. TigrScan and GlimmerHMM: two open source ab initio Eukaryotic gene-finders.
Bioinformatics 20(16), 2878–2879. https://doi.org/10.1093/bioinformatics/bth315 (2004).
73. Haas, B. J. et al. Automated Eukaryotic gene structure annotation using evidencemodeler and the program to assemble spliced
alignments. Genome Biol. 9(1), R7. https://doi.org/10.1186/gb-2008-9-1-r7 (2008).
74. The UniProt Consortium. UniProt: a worldwide hub of protein knowledge. Nucl. Acids Res. 47(D1), D506–D515. https://doi.org/
10.1093/nar/gky1049 (2019).
75. Chan, P. P. & Lowe, T. M. TRNAscan-SE: searching for TRNA genes in genomic sequences. In Gene Prediction Methods in Molecular
Biology (ed. Kollmar, M.) 1–14 (Springer, 2019). https://doi.org/10.1007/978-1-4939-9173-0_1.
76. Drillon, G., Carbone, A. & Fischer, G. SynChro: a fast and easy tool to reconstruct and visualize synteny blocks along Eukaryotic
chromosomes. PLoS ONE 9(3), e92621. https://doi.org/10.1371/journal.pone.0092621 (2014).
77. Drillon, G., Carbone, A. & Fischer, G. Combinatorics of chromosomal rearrangements based on synteny blocks and synteny packs.
J. Log. Comput. 23(4), 815–838. https://doi.org/10.1093/logcom/exr047 (2013).
78. Grabherr, M. G. et al. Genome-wide synteny through highly sensitive sequence alignment: Satsuma. Bioinformatics 26(9), 1145–
1151. https://doi.org/10.1093/bioinformatics/btq102 (2010).
79. Krzywinski, M. et al. Circos: an information aesthetic for comparative genomics. Genome Res. 19(9), 1639–1645. https://doi.org/
10.1101/gr.092759.109 (2009).
Scientific Reports | (2021) 11:9845 | https://doi.org/10.1038/s41598-021-89146-y 10
Vol:.(1234567890)www.nature.com/scientificreports/
Author contributions
C.A. Smith designed and executed all work that comprises this research article and confirms that he has read
and approved the final manuscript.
Funding
The author is supported by funding from the New Zealand Ministry of Business and Innovation (MBIE) Infra-
structure Programme of the Strategic Science Investment Fund (SSIF) C09X1703 through the Biota Portfolio of
Manaaki Whenua – Landcare Research. The author is supported by funding from the Kiwi Innovation Network
of New Zealand. All study design, collection, analysis and interpretation of the data was conducted by the author.
Competing interests
The author declares no competing interests.
Additional information
Supplementary Information The online version contains supplementary material available at https://doi.org/
10.1038/s41598-021-89146-y.
Correspondence and requests for materials should be addressed to C.A.S.
Reprints and permissions information is available at www.nature.com/reprints.
Publisher’s note Springer Nature remains neutral with regard to jurisdictional claims in published maps and
institutional affiliations.
Open Access This article is licensed under a Creative Commons Attribution 4.0 International
License, which permits use, sharing, adaptation, distribution and reproduction in any medium or
format, as long as you give appropriate credit to the original author(s) and the source, provide a link to the
Creative Commons licence, and indicate if changes were made. The images or other third party material in this
article are included in the article’s Creative Commons licence, unless indicated otherwise in a credit line to the
material. If material is not included in the article’s Creative Commons licence and your intended use is not
permitted by statutory regulation or exceeds the permitted use, you will need to obtain permission directly from
the copyright holder. To view a copy of this licence, visit http://creativecommons.org/licenses/by/4.0/.
© The Author(s) 2021
Scientific Reports | (2021) 11:9845 | https://doi.org/10.1038/s41598-021-89146-y 11
Vol.:(0123456789)You can also read